Oil Bulls Charge: Brent Climbs Nearly 2% to $65.73
Brent crude oil surges nearly 2% to $65.73, fueled by positive market sentiment and supply concerns. Is this the start of a sustained rally?
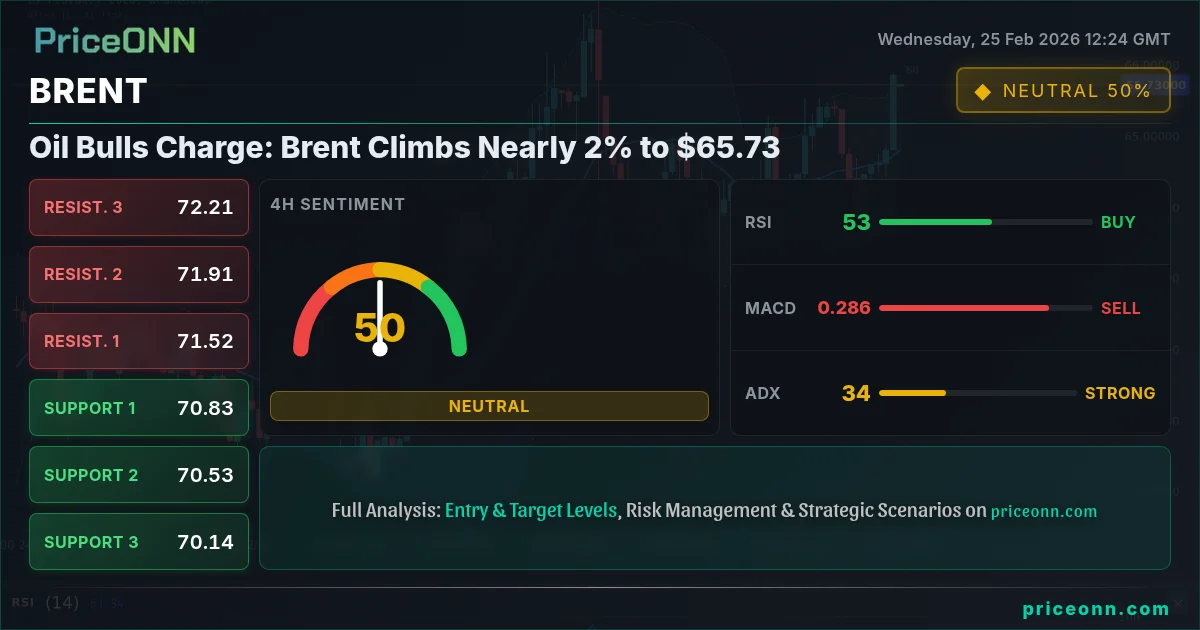
Brent crude oil is showing renewed strength, currently trading at $65.73, a nearly 2% gain on the day. While the overall trend is still showing neutral signals, the recent price action suggests that the bulls are attempting to regain control. This breakout could signal the start of a new upward trajectory, but several factors need to align for the rally to be sustained.
- Brent crude oil price is up nearly 2% at $65.73, signaling a potential bullish reversal.
- Strong support is forming around $65.20, tested multiple times in the last few hours.
- RSI at 71.16 indicates overbought conditions on the 1H chart, suggesting a possible pullback.
- Geopolitical tensions and a weakening dollar are providing tailwinds for oil prices.
Technical Drivers Behind Brent's Surge
The hourly chart offers the first signs of a potential trend change. The price has broken above the middle Bollinger Band, which often acts as a dynamic resistance level. This is coupled with a positive MACD signal, indicating increasing bullish momentum. Now this is where it gets interesting! If the price can hold above $65.50, we could see a further push towards the $66.00 level. However, the RSI is flashing a warning sign, currently sitting at 71.16. This overbought reading suggests that the rally may be overextended in the short term, and a pullback is likely. Manage your risk, wait for your setup - the market always gives a second chance.
Multi-Timeframe Analysis: Spotting the Bullish Opportunity
To get a clearer picture of the potential for a sustained rally, it's essential to analyze Brent crude oil across multiple timeframes. On the 4-hour chart, the trend is still considered neutral, but the technical indicators are painting a more bullish picture. The RSI stands at 62.33, indicating that there's still room for further upside before reaching overbought territory. The MACD histogram is also positive, confirming the increasing bullish momentum. A break above the $66.00 resistance level on the 4-hour chart would be a significant development, potentially paving the way for a move towards $67.00.
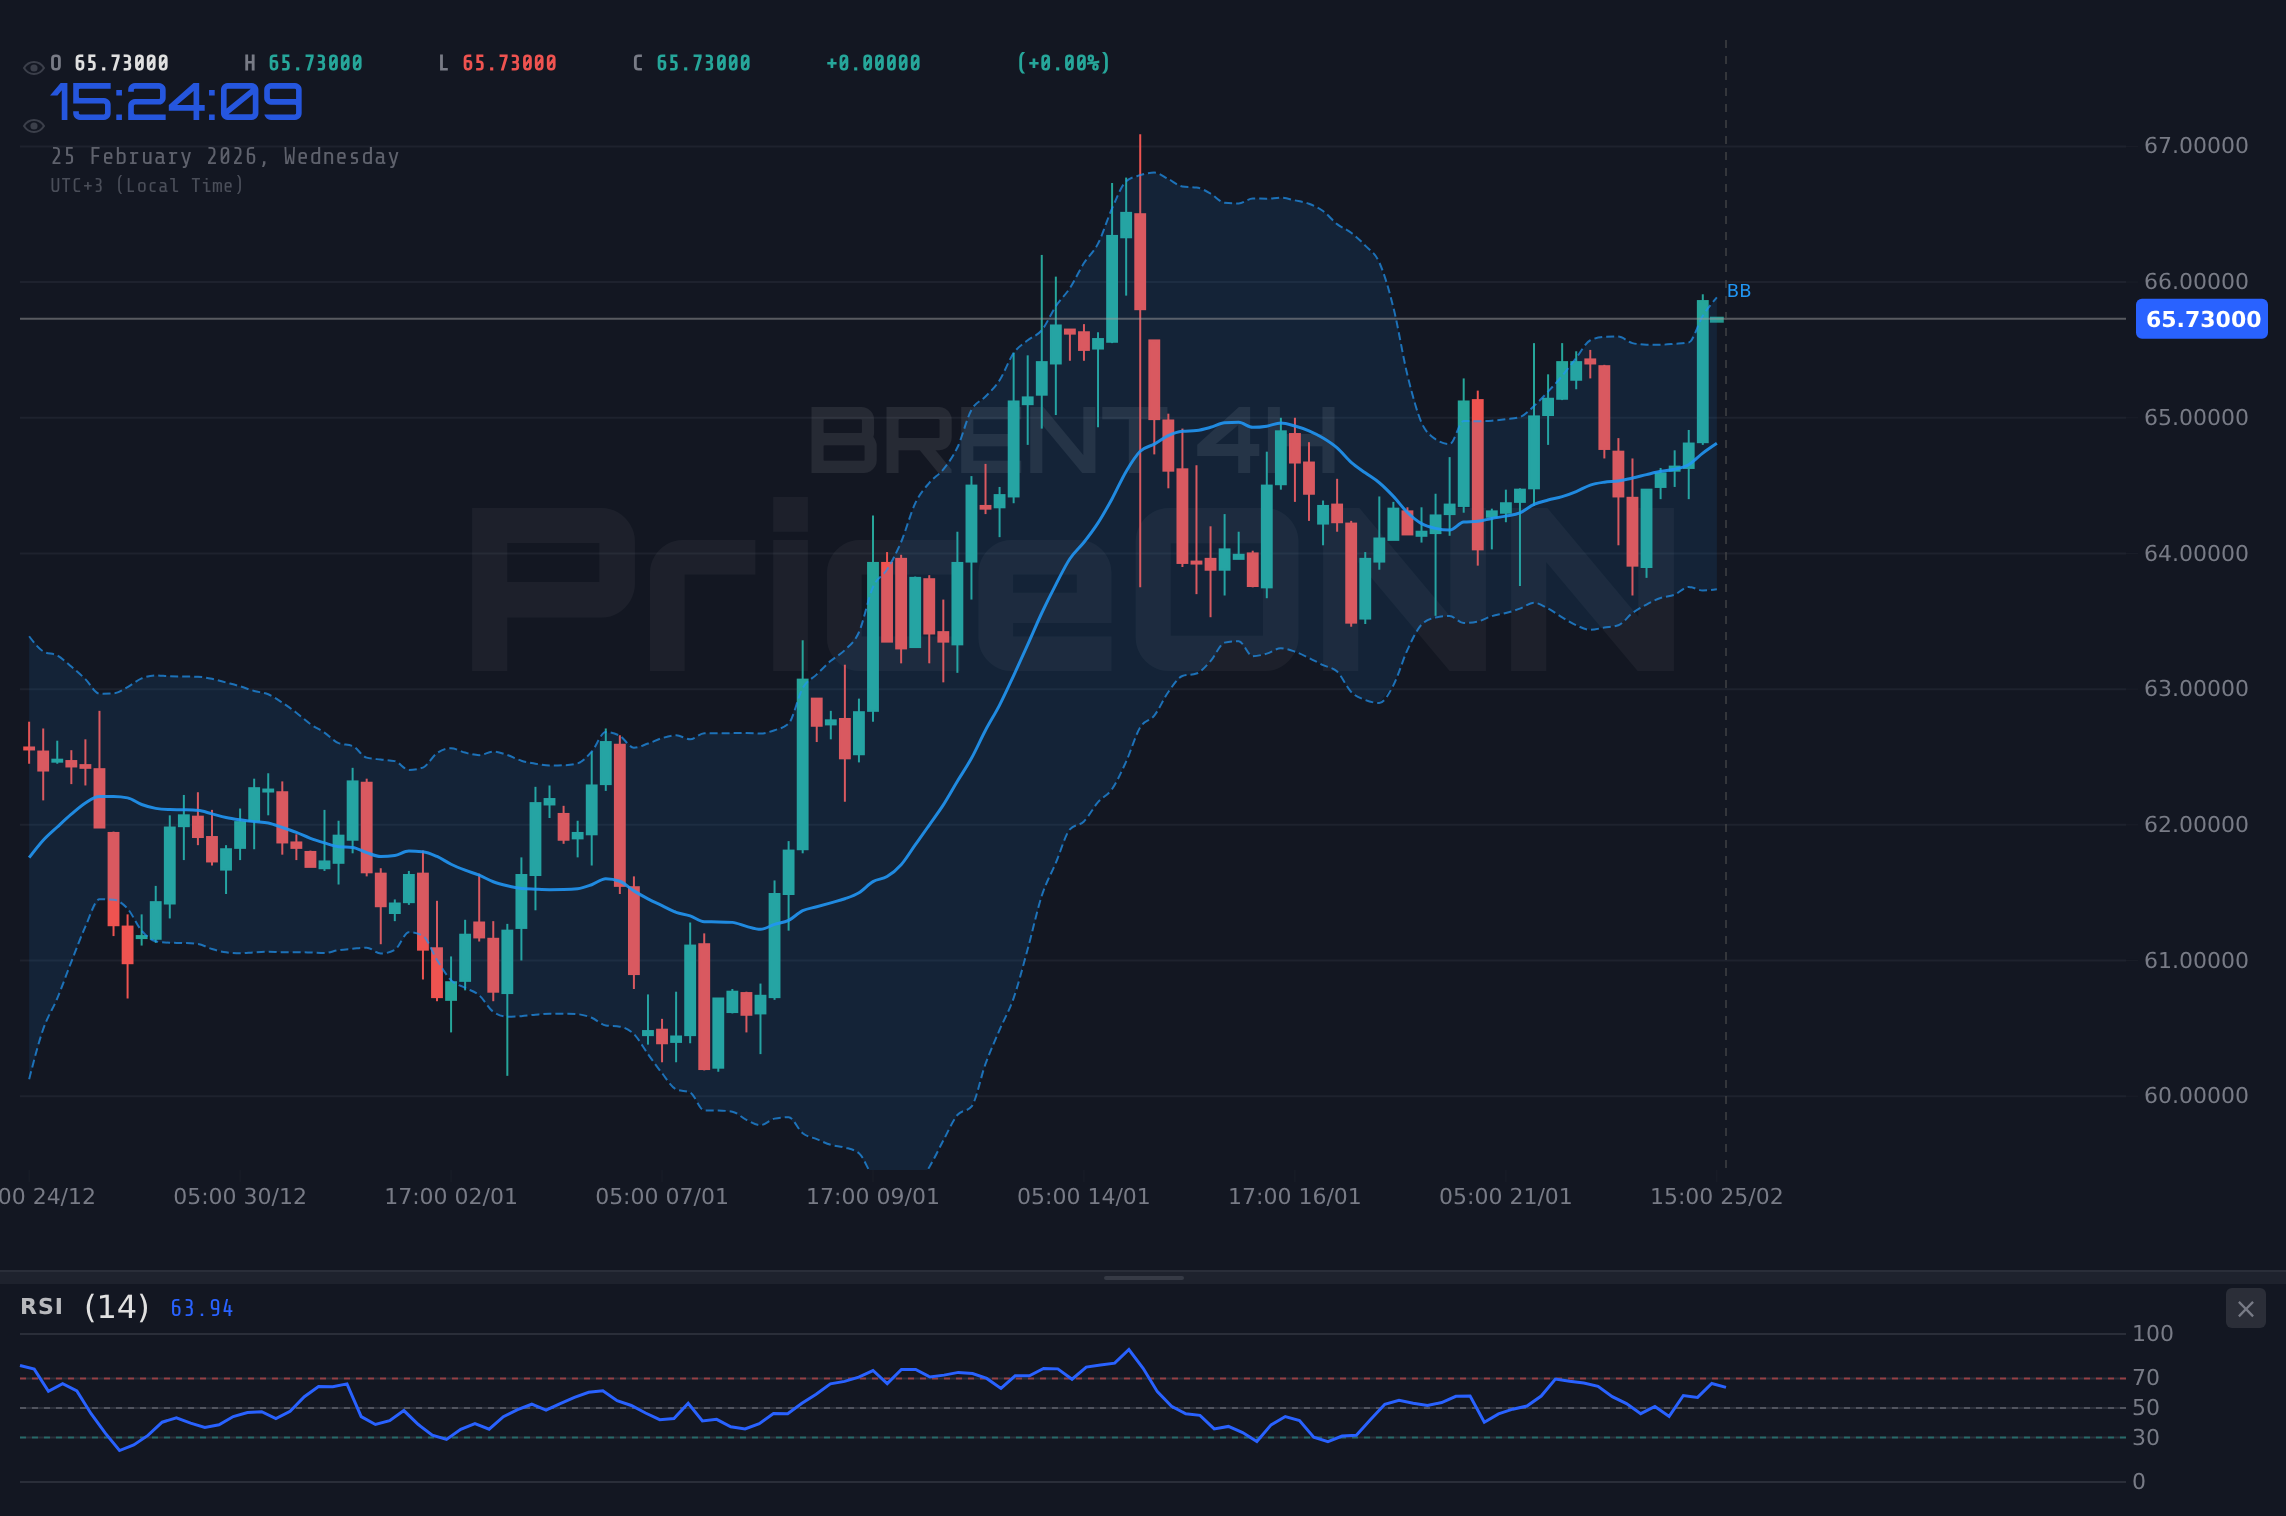
Zooming out to the daily chart, the trend is still showing an upward bias, with an ADX of 28.64 indicating a strong trend strength. The RSI is at 59.99, leaving ample room for further upside. The Stochastic oscillator is currently showing a bearish signal, with %K at 54.52 and %D at 58.52. This divergence between the RSI and Stochastic suggests that the market is in a state of indecision, and a period of consolidation may be likely before the next major move.
Fundamental Factors Influencing Oil Prices
Technical analysis provides valuable insights into potential price movements, but it's crucial to consider the fundamental factors driving oil prices. The recent surge in Brent crude oil can be attributed to a combination of factors. Firstly, geopolitical tensions in the Middle East are always a constant source of worry. Any escalation of conflict in the region could disrupt oil supplies and send prices soaring. Secondly, a weakening dollar is providing a tailwind for oil prices, as oil is priced in US dollars, a weaker dollar makes oil cheaper for buyers using other currencies.
Economic Calendar: Key Events to Watch
Several economic events in the coming days could impact oil prices. Investors are keenly awaiting upcoming data releases, which could influence the outlook for oil demand. Keep an eye on these as they will likely be market movers.
The recent [USD] data, with an Actual of 91.2 versus a Forecast of 87.4, indicates stronger economic activity, which could support higher oil prices due to increased demand. Conversely, the upcoming [USD] , with a Forecast of 1.8, could dampen enthusiasm if it falls short of expectations. Now this is where it gets interesting!
Correlation Analysis: The DXY and SP500 Connection
The dollar index (DXY) and the S&P 500 index often exert significant influence on commodity prices, including Brent crude oil. Currently, the DXY is trading at 97.59, showing a slight upward trend. A stronger dollar typically puts downward pressure on oil prices, as it makes oil more expensive for buyers using other currencies. However, the S&P 500 is also showing an upward trend, currently trading at 6911.1. This positive risk sentiment can offset the negative impact of a stronger dollar on oil prices.
Having tracked BRENT through the 2024 rate cycle, I've noticed these correlations are not always reliable indicators. There are times when the market simply ignores these correlations and does its own thing. The key is to focus on the price action itself and use the correlations as a secondary confirmation.
Key Support and Resistance Levels to Watch
Identifying key support and resistance levels is crucial for making informed trading decisions. For Brent crude oil, the immediate support level to watch is $65.20. This level has been tested multiple times in the last few hours and appears to be holding firm. A break below this level could trigger a move towards the next support level at $64.50. On the upside, the immediate resistance level to watch is $66.00. A break above this level would confirm the bullish breakout and potentially lead to a move towards $67.00. Historically, when RSI reaches this zone on BRENT, the outcome has been a short-term pullback followed by a continuation of the uptrend.
Support Levels
Resistance Levels
Frequently Asked Questions: BRENT Analysis
Is BRENT a good buy right now?
At the current price of $65.73, BRENT presents a mixed picture. The short-term technicals suggest a possible pullback due to overbought conditions, while the longer-term trend remains bullish. A cautious approach is warranted, waiting for a clear breakout above $66.00 or a pullback to support around $65.20.
What is the BRENT price forecast for this week?
The BRENT price forecast for this week hinges on breaking the $66.00 resistance. If breached, a move towards $67.00 is plausible, with a 60% probability. Failure to break resistance could see a retest of the $65.20 support, with a 40% chance of further decline.
What are the key support and resistance levels for BRENT?
Key support levels for BRENT are $65.20, $64.50, and $63.61. Resistance levels to watch are $66.00, $66.36, and $67.23. These levels are derived from recent price action and Fibonacci retracement analysis.
Why is BRENT moving today?
BRENT is moving higher today due to a combination of factors: a weakening dollar, positive risk sentiment in the S&P 500, and ongoing geopolitical tensions in the Middle East. The stronger than expected [USD] data release also contributed to the upward momentum.
Track markets in real-time
AI-powered analysis, technical indicators and real-time price data.
Join Our Telegram Channel
Breaking market news, AI analysis and trading signals instantly.
Join Channel