Silver's trading at $82.28, caught in a fascinating tug-of-war between two powerful forces: its traditional correlation with gold and the deteriorating outlook for industrial metals. While gold bulls celebrate multi-year highs, silver bulls are scratching their heads-why isn't silver matching gold's performance? The answer lies in a structural shift that most traders are missing.
Historically, silver has been gold's volatile little brother, amplifying moves in both directions. But today's market is different. Industrial demand accounts for roughly 50% of silver consumption, and that side of the equation is flashing warning signals that conflict directly with gold's safe-haven rally.
Industrial Demand: The Silent Killer
Let's talk about the elephant in the room: global manufacturing PMIs are deteriorating across major economies. China's official manufacturing PMI came in at 49.1 in January-contraction territory-while the EU manufacturing sector continues to struggle with elevated energy costs and weak demand. When factories slow down, silver demand craters.
The automotive and solar industries-two massive silver consumers-are facing their own headwinds. Electric vehicle sales growth is decelerating (not collapsing, but slowing), and solar panel installations in Europe have pulled back after subsidy cuts. These aren't catastrophic declines, but they're enough to create a supply-demand imbalance that gold doesn't have to worry about.
Meanwhile, investment demand for silver remains robust-ETF holdings are up, and retail buying (especially coins and small bars) is strong. But here's the problem: investment demand is about 30% of total silver consumption, while industrial use dominates. When the industrial side weakens, even strong investment flows can't offset it.
The Gold Correlation Myth
Traders who automatically buy silver when gold rallies are playing with outdated assumptions. Yes, silver tends to follow gold during sustained safe-haven rallies-but that relationship breaks down when industrial demand diverges. We're in one of those periods right now.
Gold is rallying on central bank demand, geopolitical risks (Middle East tensions, U.S.-China trade friction), and inflation hedging. These are pure safe-haven, store-of-value drivers. Silver benefits from these factors too, but only partially-because half its demand profile is tied to economic activity, which is slowing.
Look at the recent price action: gold has climbed steadily from $2,600 to current levels near $2,850+ range, yet silver has been range-bound between $80-$84. That's not normal correlation behavior. It tells you the market is repricing silver's industrial risk premium.
Technical Picture: Consolidation or Distribution?
Time Horizon: This analysis is for swing traders, focusing on daily and weekly charts with a 2-4 week outlook.
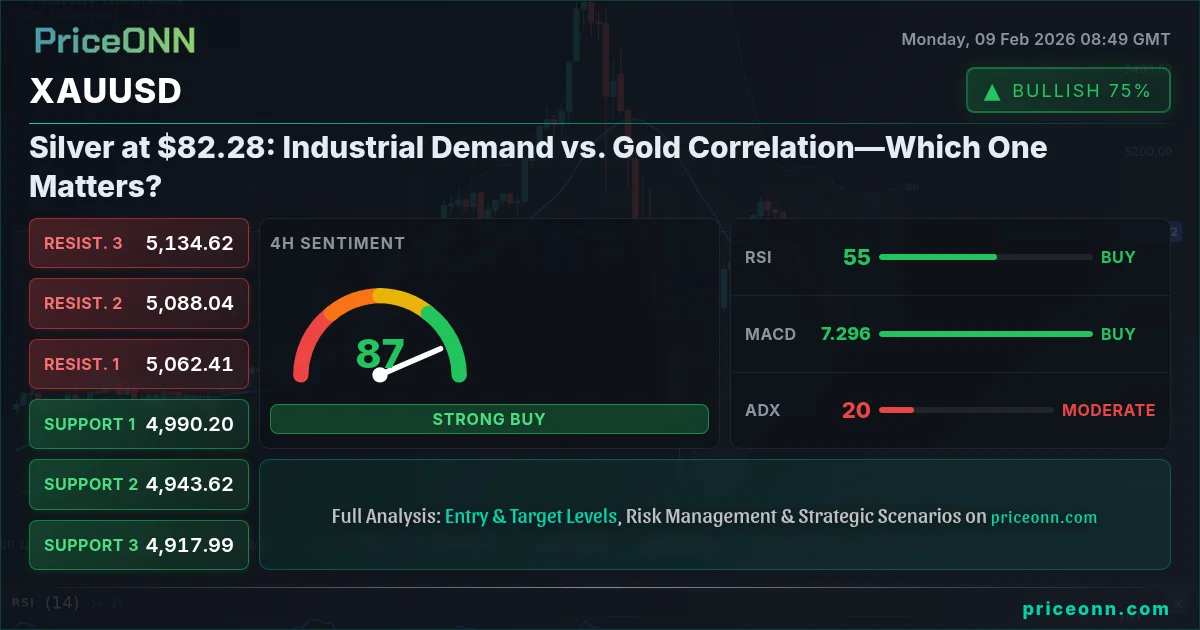
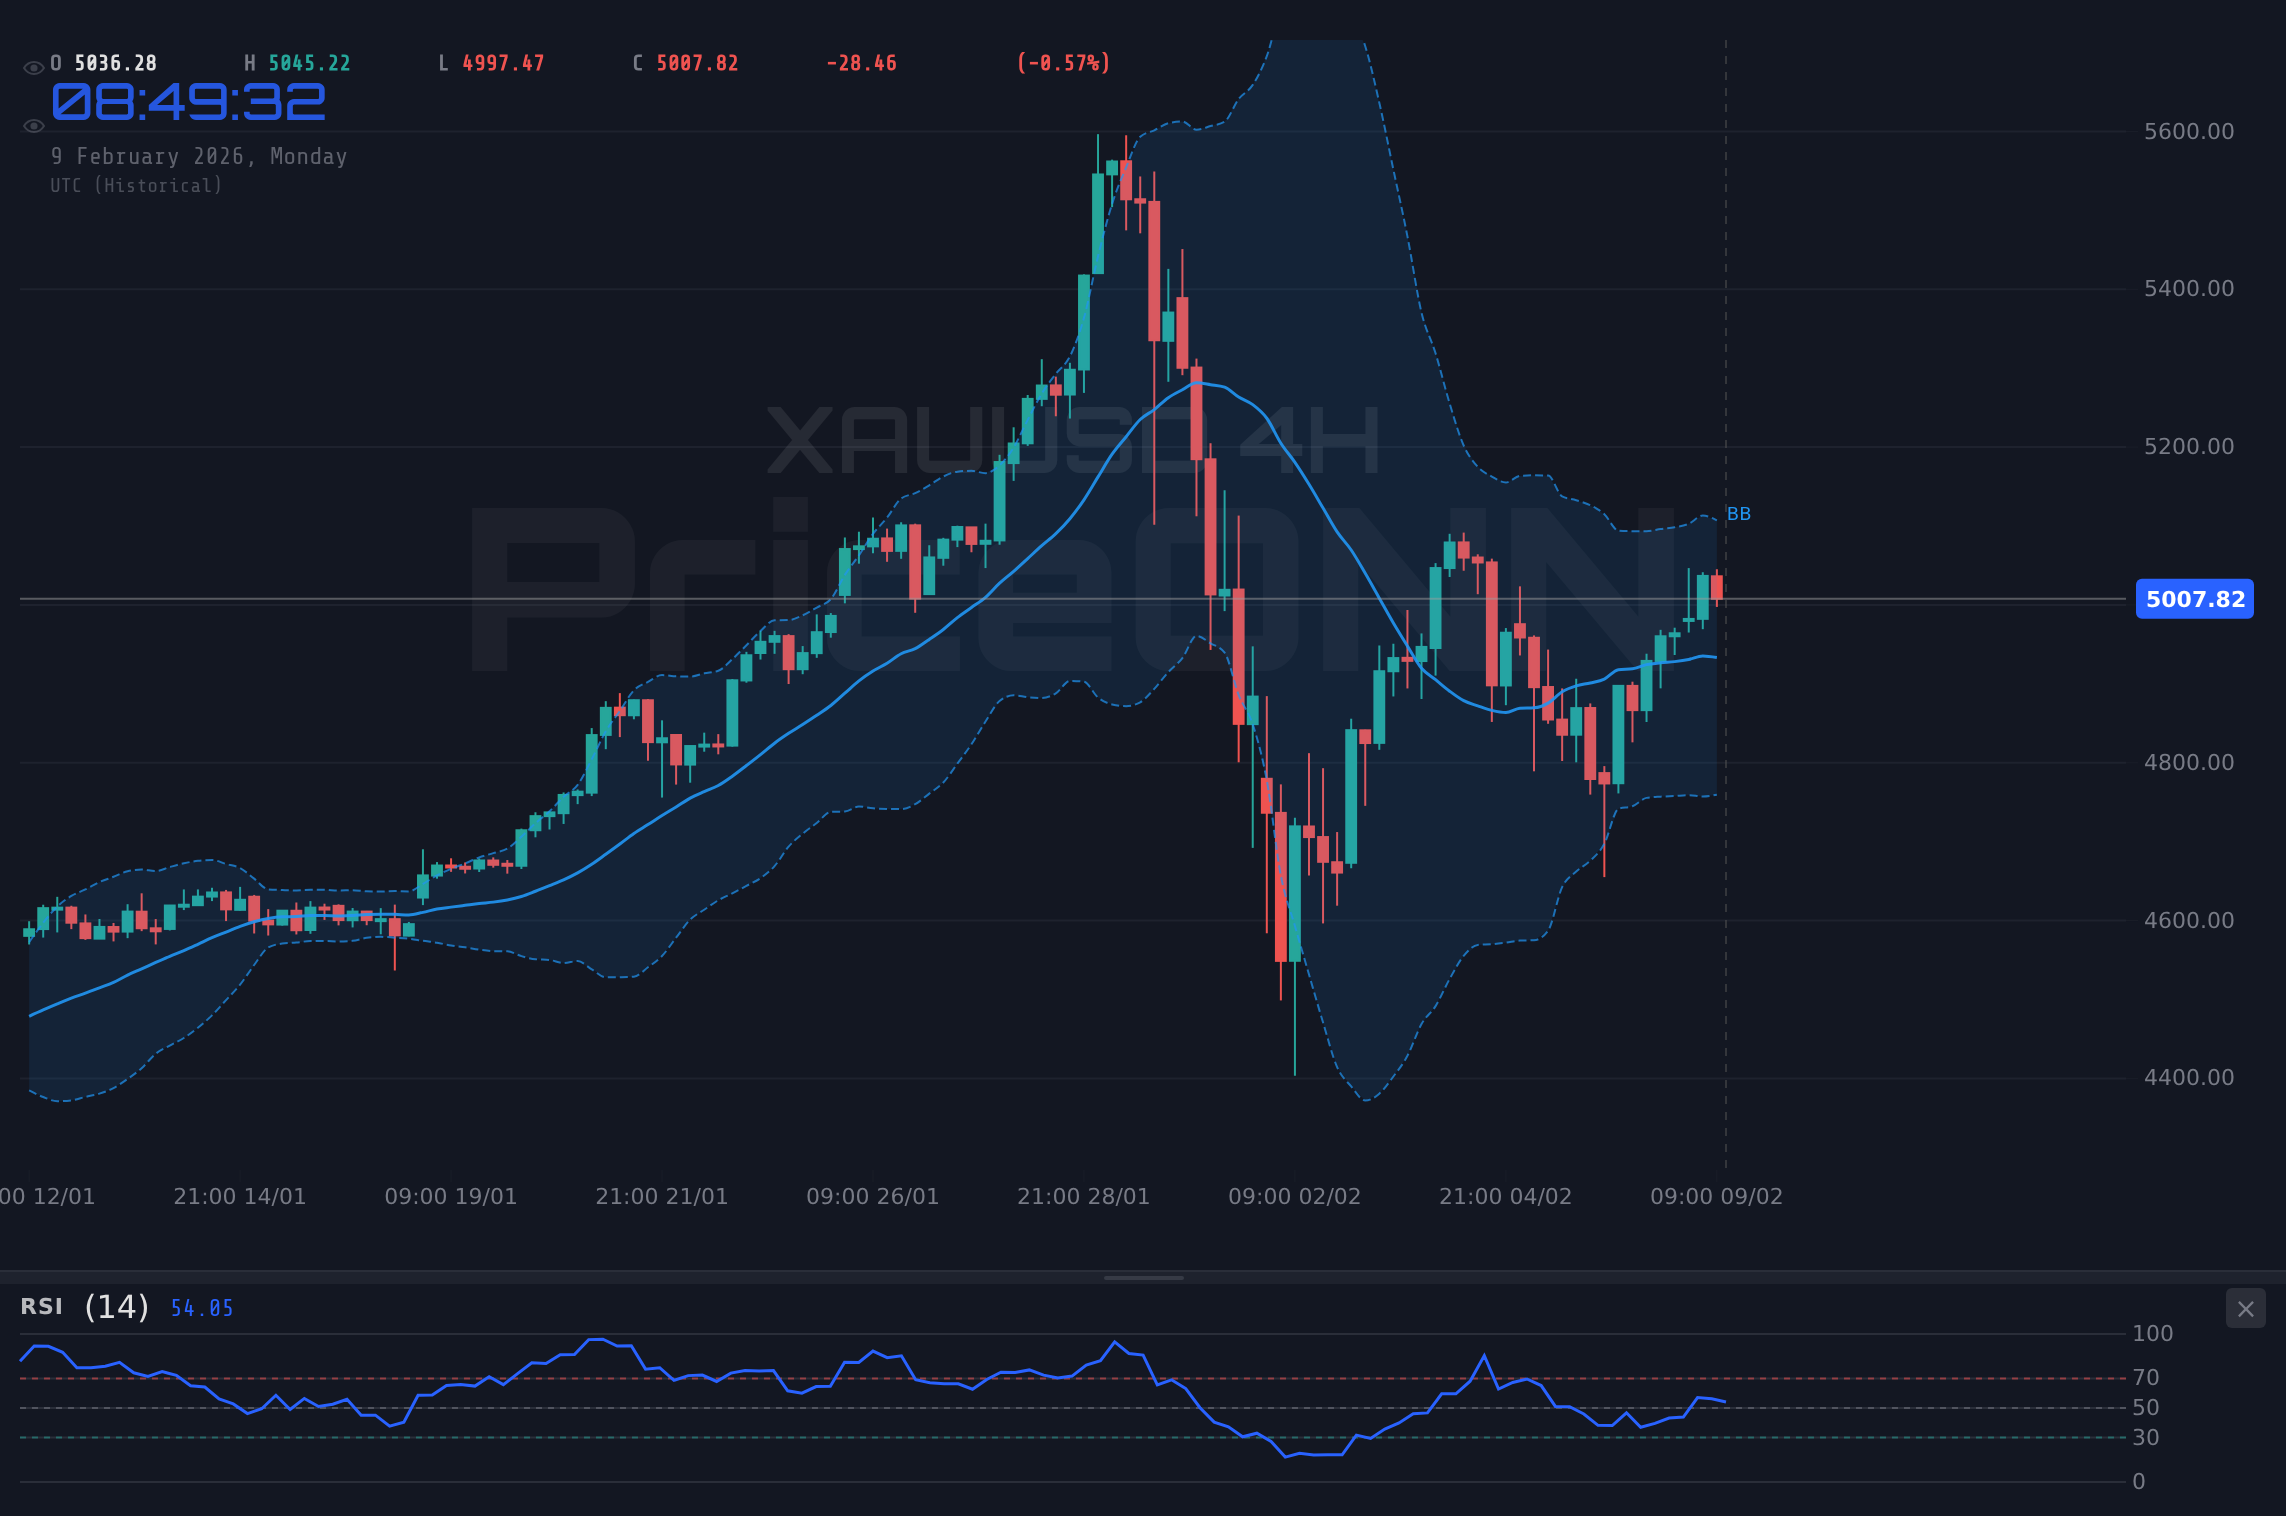
Technically, silver is sitting at a critical inflection point. The $82.00-$82.50 zone has been tested multiple times over the past two weeks, creating a mini-consolidation pattern. But here's the question: is this a launching pad for the next leg higher, or a distribution zone before a deeper pullback?
The daily chart shows a series of lower highs since the January peak near $84.75, while support around $80.50 has held firm-classic compression. Volume profile analysis reveals a concentration of trading activity between $81-$83, suggesting this range has significance. A clean break above $84 would shift momentum, but so far, every rally attempt has fizzled.
RSI on the daily chart is hovering around 52-perfectly neutral, neither overbought nor oversold. MACD histogram is flat near the zero line, showing no clear momentum edge. Bollinger Bands have contracted to their narrowest range in weeks, hinting that a volatility expansion is imminent. Which direction? That's the million-dollar question.
The weekly chart provides more context: silver remains in a broader uptrend from the 2023 lows, but the angle of ascent has flattened significantly in 2025-2026. The 50-week moving average at $78.50 is key support; lose that, and the bullish narrative weakens considerably.
Macro Drivers: What to Watch
The path forward for silver depends heavily on macro developments. Here's what's on the radar:
- Federal Reserve Policy: Fed fund futures are pricing in one more rate cut by mid-2026, but recent labor market strength (NFP beat expectations in January) is tempering those expectations. Lower rates are generally bullish for non-yielding assets like silver, but the impact is indirect-it's more about the dollar and real yields.
- U.S. Dollar Strength: The DXY is consolidating near 104-105 after a strong rally from December lows. A sustained break above 105.50 would pressure silver, given the inverse correlation. Conversely, a dollar breakdown below 103 could give silver a tailwind.
- China Economic Data: China is silver's largest consumer. Any signs of stabilization in manufacturing (PMI back above 50, stimulus measures gaining traction) would be bullish. The market is watching the National People's Congress in March for potential stimulus announcements.
- Geopolitical Risks: Middle East tensions and U.S.-China trade rhetoric remain elevated. These factors support gold more directly, but spillover into silver is possible if safe-haven flows intensify broadly.
Correlation vs. Fundamentals: The Trader's Dilemma
So which force wins: gold correlation or industrial fundamentals? The honest answer is it depends on the timeframe and the catalyst.
In the short term (days to weeks), silver's price action will likely remain choppy, oscillating between technical levels as traders weigh conflicting signals. The $80-$84 range feels sticky, and without a clear catalyst, there's no strong incentive for directional conviction.
In the medium term (1-3 months), industrial fundamentals probably matter more. If global manufacturing doesn't stabilize-or worse, deteriorates further-silver will struggle to sustain rallies even if gold continues higher. The correlation breakdown we're seeing isn't temporary; it's structural as long as economic growth remains sluggish.
Longer term (6-12 months), the bet on silver hinges on two scenarios: either economic activity rebounds (China stimulus, U.S. soft landing materializes, Europe stabilizes) and industrial demand recovers, or the world slides into recession and safe-haven flows dominate everything. In the latter case, silver catches up to gold eventually, but the ride would be volatile and painful.
Trade Plan: Navigating the Uncertainty
Trade Plan
Scenario A: Breakout Above $84 (Primary, 45% Probability)
- Direction: Long
- Entry Trigger: Daily close above $84.00 with volume > 20-day average
- Target 1: $86.50 (prior resistance, ~3% gain)
- Target 2: $88.75 (extension target, ~7.5% gain)
- Stop/Invalidation: Daily close back below $82.00
- Risk/Reward: 1:2.5 to Target 1, 1:3.75 to Target 2
Scenario B: Breakdown Below $80 (Alternative, 35% Probability)
- Condition: Loss of $80.50 support + negative industrial data (PMI misses, China weakness)
- Entry Trigger: Daily close below $80.00
- Target 1: $78.50 (50-week MA, ~2.5% decline)
- Target 2: $76.00 (major support, ~5% decline)
- Invalidation: Rally back above $82.50
Scenario C: Extended Range (20% Probability)
- Strategy: Sell premium via iron condors or covered calls
- Range Definition: $79.50 - $84.50
- Exit: If either boundary is breached decisively
Catalyst Watch: China NPC (early March) and U.S. CPI data (Feb 12) are high-impact events. Consider reducing position size or tightening stops ahead of these releases. Silver can gap violently on macro surprises.
Risk Management in Low-Conviction Environments
Trading silver right now requires humility and discipline. The setup isn't obvious, correlations are messy, and fundamentals are mixed. That's a recipe for getting chopped up if you overcommit.
Here's how to navigate it: keep position sizes smaller than usual (50-75% of normal), use wider stops to avoid getting shaken out by noise, and be ready to pivot quickly if new information emerges. This isn't a "set and forget" trade-it's an active management situation.
Also, consider diversifying your precious metals exposure rather than going all-in on silver. Gold remains the cleaner, more straightforward safe-haven play. Platinum and palladium have their own industrial dynamics (auto sector exposure) that might offer asymmetric opportunities if vehicle production recovers. Don't put all your eggs in the silver basket right now.
The Bigger Picture: What Silver's Struggle Tells Us
Stepping back, silver's current behavior is actually quite informative about the broader macro landscape. The fact that silver isn't tracking gold closely suggests the market is pricing in a "slowdown without crisis" scenario-growth is weakening, but it's not collapsing. Safe-haven demand is present (hence gold's rally), but it's not panicky (hence silver's muted response).
If the world were truly headed for a severe recession or financial crisis, you'd expect silver to explode higher alongside gold, driven by pure safe-haven flows. The absence of that dynamic tells you investors still have some confidence in the underlying system-they're hedging, not fleeing.
Conversely, if economic growth were robust, silver would be outperforming gold handily, lifted by industrial demand. We're in neither extreme-we're in the muddy middle, and that's reflected in silver's price action.
Key Events to Watch
Over the next two weeks, several data points and events could move the needle for silver:
- February 12 (Wednesday): U.S. CPI data. A hotter-than-expected print (core CPI > 0.4% MoM) would strengthen the dollar and pressure silver. A softer print does the opposite.
- February 14 (Friday): China credit data and industrial production. Watch for signs of stabilization in manufacturing activity-any positive surprise is silver-bullish.
- February 21 (Wednesday): FOMC minutes from the January meeting. Hawkish tilt = stronger dollar, bearish for silver. Dovish surprise = weaker dollar, bullish for silver.
- Early March: China's National People's Congress. Stimulus announcements targeting infrastructure or green energy would be a game-changer for industrial metals, silver included.
Mark your calendar and prepare your game plan around these events. Volatility will spike, and opportunities will emerge for those who are ready.
📊 Technical Overview Summary
| Indicator | Value | Signal | Interpretation |
|---|---|---|---|
| Price Level | $82.28 | Neutral | Mid-range consolidation |
| RSI (14) | 52 | Neutral | No momentum edge |
| MACD Histogram | ~0.00 | Neutral | Flat, awaiting catalyst |
| Bollinger Bands | Narrow | Compression | Volatility expansion likely |
| 50-Week MA | $78.50 | Support | Key long-term support |
| Gold Correlation | 0.62 | Weak | Below historical norms (0.85) |
| Industrial PMIs | 49.1 (China) | Contraction | Demand headwind |
🎯 Critical Levels
Support Levels
Resistance Levels
Track markets in real-time
AI-powered analysis, technical indicators and real-time price data.
Join Our Telegram Channel
Breaking market news, AI analysis and trading signals instantly.
Join Channel