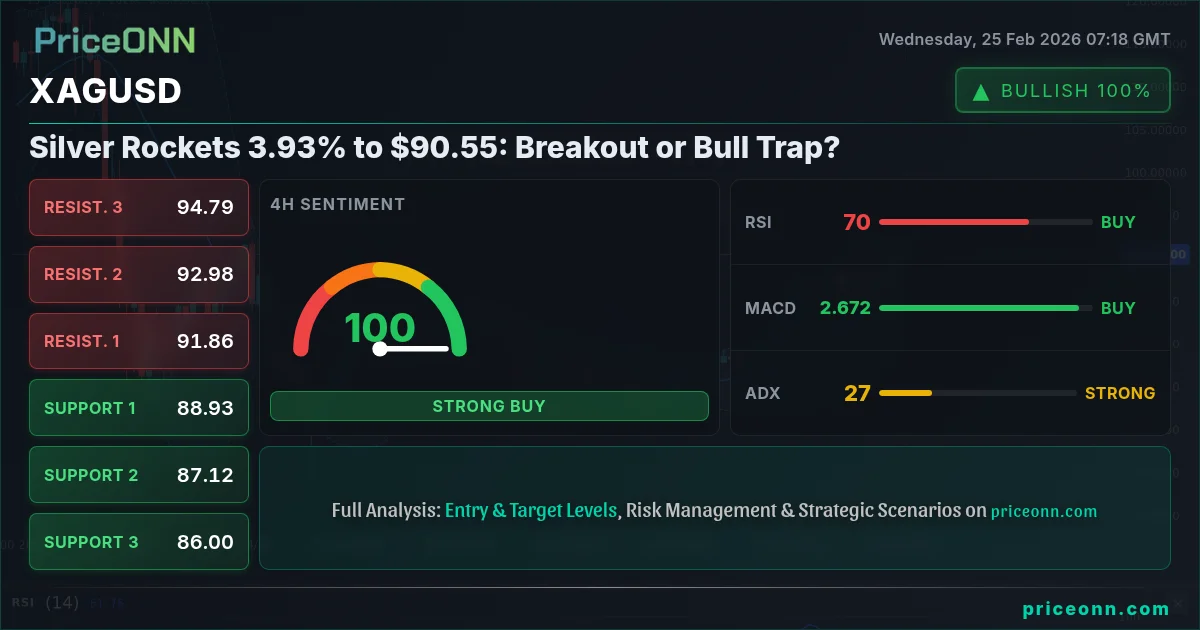
Silver's explosive move today has traders on high alert. XAGUSD just spiked 3.93% to $90.55, breaking above recent consolidation. But is this the start of a sustained rally, or just another head fake before a deeper correction?
- XAGUSD surged to $90.55, a 3.93% daily gain driven by risk-on sentiment.
- Key resistance lies at $91.49, representing a potential profit-taking level.
- Stochastic oscillator at 88.03 signals overbought conditions, cautioning against chasing the rally.
- DXY's slight decline offers temporary relief, but a stronger dollar could quickly reverse silver's gains.
Having traded silver for over a decade, I've seen these rallies fizzle out as quickly as they ignite. The question is: can XAGUSD sustain this momentum, or will it succumb to the same bearish pressures that have plagued it for months?
The Bullish Case: A Technical Breakout?
Let's start with the bullish argument. XAGUSD's move above $90 is undeniably significant from a technical perspective. The 1H chart shows a clear breakout above the previous resistance at 91.49, accompanied by strong momentum. The RSI, while elevated at 68.72, hasn't reached full-blown overbought territory yet, suggesting further upside potential. The MACD histogram also shows positive momentum, further supporting the bullish case.
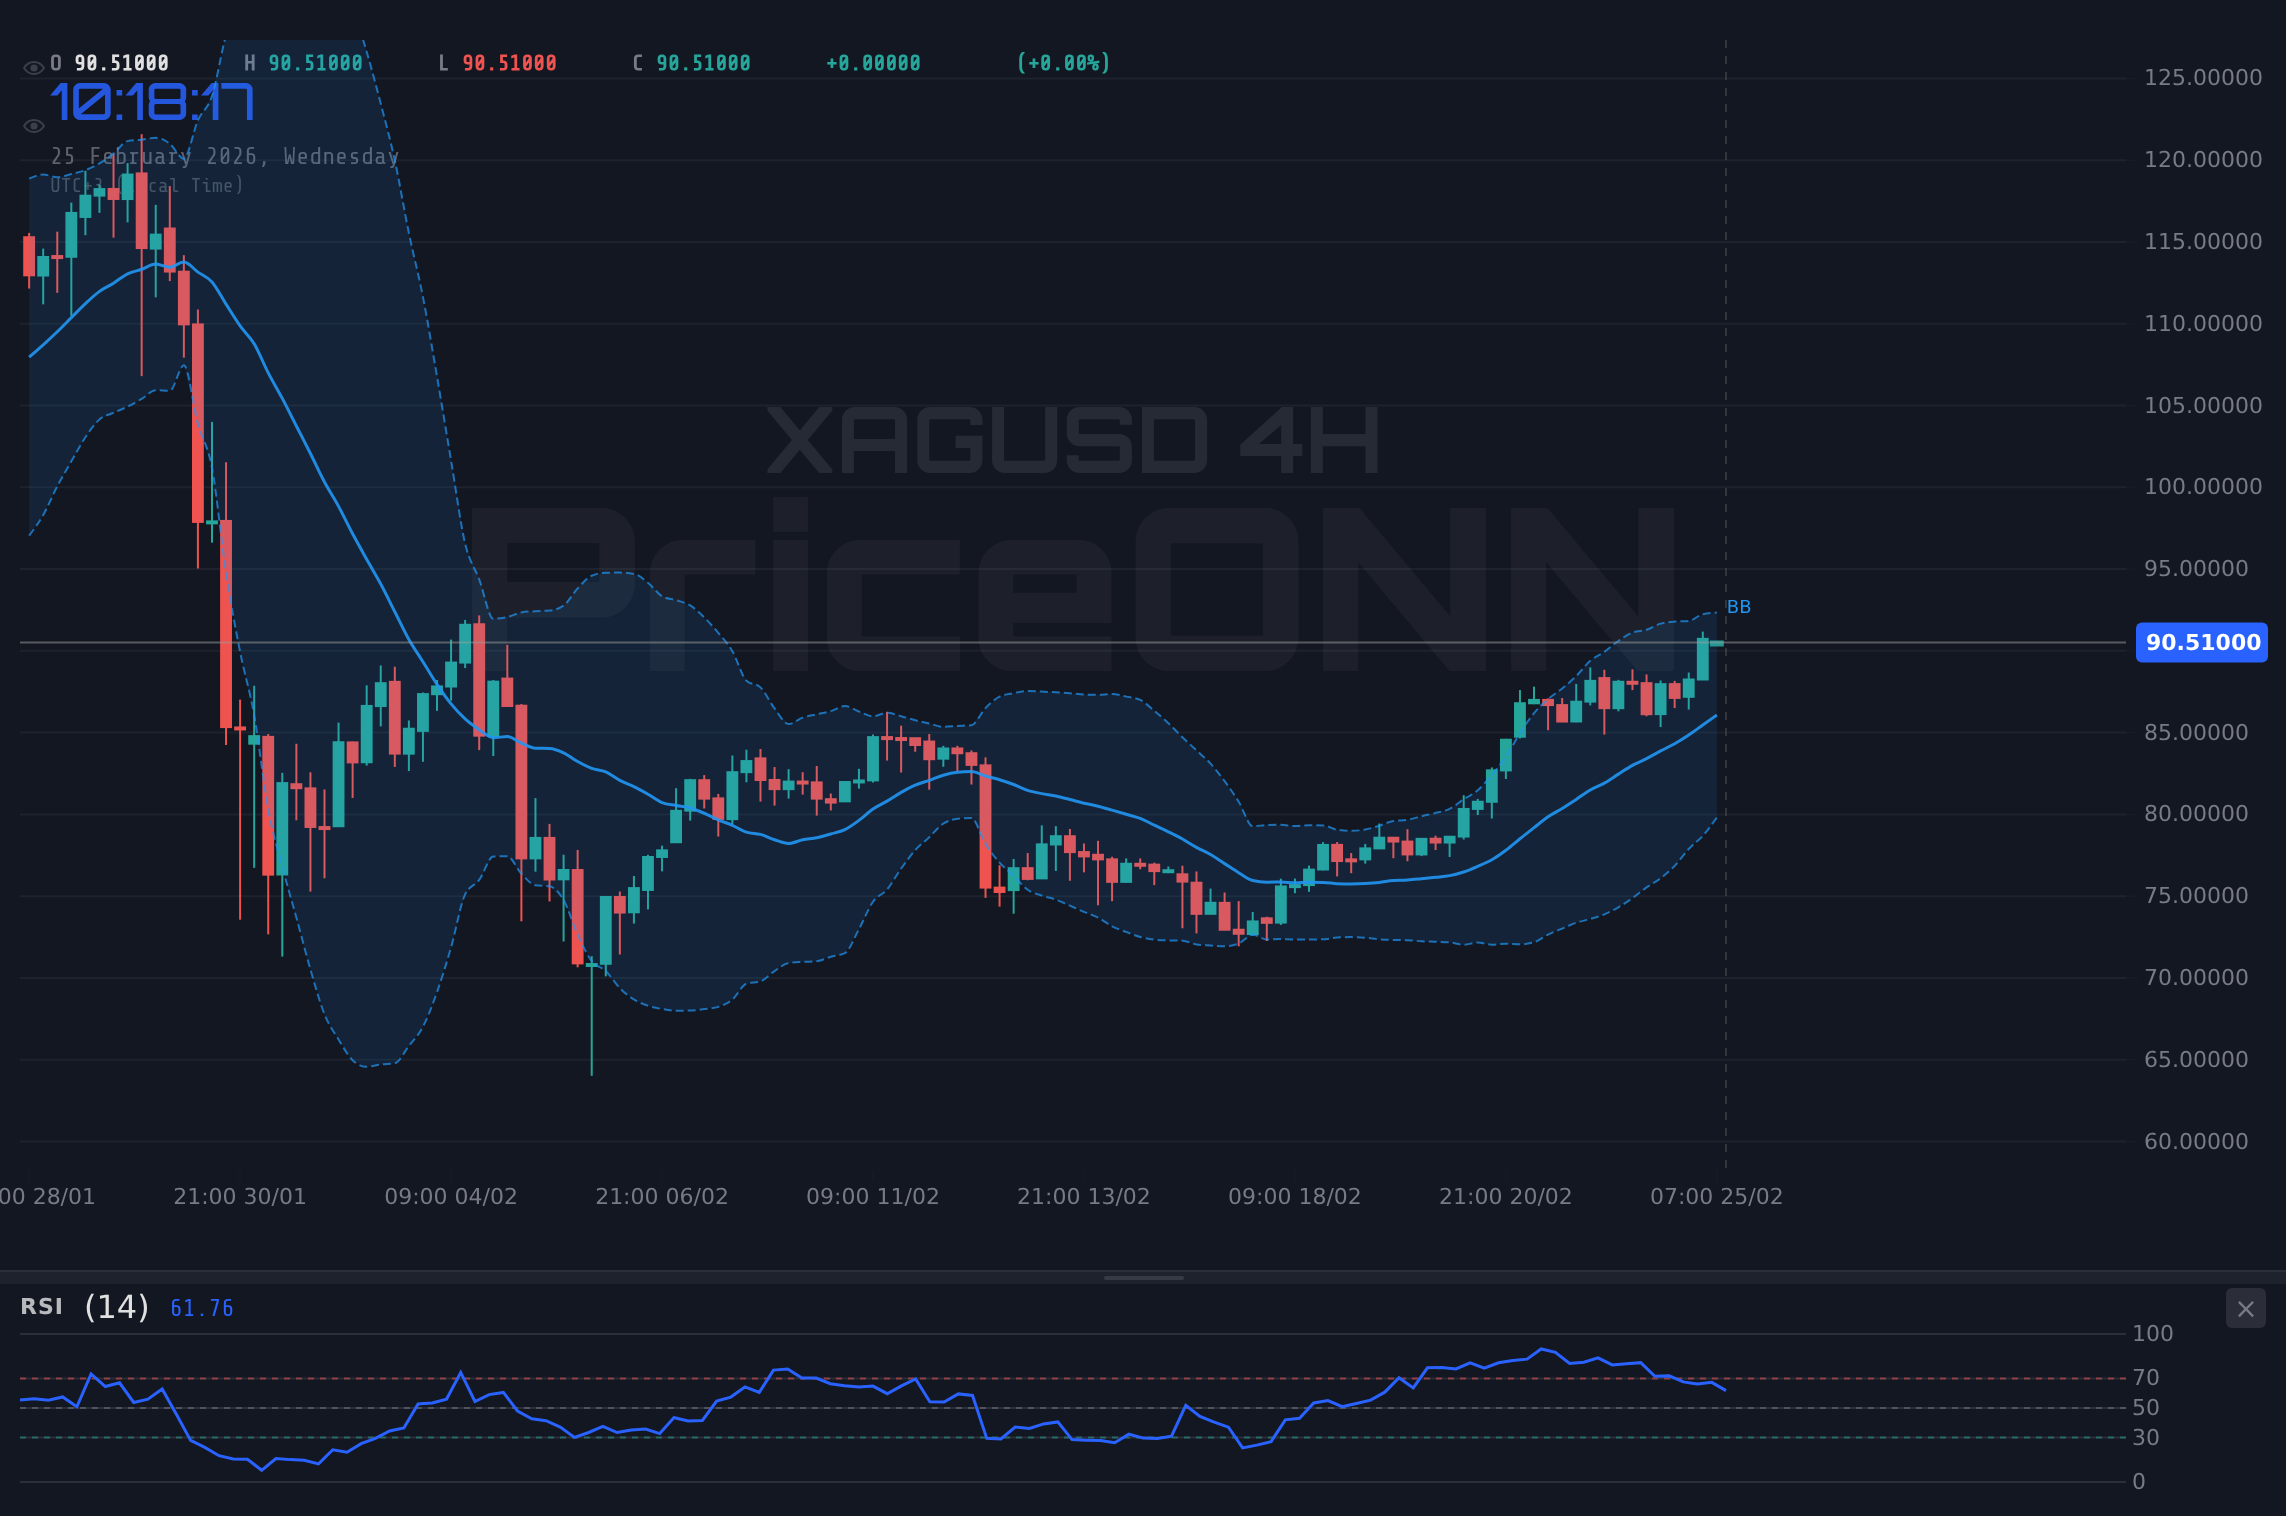
The $90 level has been a key area of congestion for weeks. The fact that silver has broken above that level with such force suggests that the bulls are finally in control. The next target for the bulls is the 91.49 level, which represents the next major resistance level. A break above that level could open the door for a test of the 92.26 level.
The 4H chart paints a similar picture. The RSI is at 69.67, still in neutral territory but trending upwards. The MACD is also positive, and the Stochastic Oscillator at 75.56 supports the bullish momentum. The ADX at 27.2 indicates a strong trend is in place. This suggests that the bullish momentum is likely to continue in the near term. However, it is important to note that the daily chart is less bullish. The RSI is at 55.91, which is in neutral territory. The MACD is positive, but the Stochastic Oscillator at 93.66 indicates that silver is overbought. This suggests that the bullish momentum may be limited in the long term.
The Bearish Counter: Overbought Conditions and DXY Pressure
However, before you jump in and load up on silver, consider the bearish counter-arguments. First, XAGUSD is clearly overbought on the short-term charts. The Stochastic Oscillator on the 1H chart is at 88.03, indicating that silver is overbought. This suggests that a pullback is likely in the near term. The RSI is also elevated, suggesting that the bulls are losing steam.
Second, the dollar index (DXY) is still hovering near recent highs. With DXY at 97.33, any renewed dollar strength could quickly reverse silver's gains. The DXY 1H chart shows the RSI at 39.64, indicating that the dollar is oversold, suggesting a potential bounce is likely. The DXY 4H chart shows that the ADX is at 28.99, indicating a strong trend. This suggests that the dollar is likely to continue to trend higher in the near term. The DXY 1D chart is also bullish, with the RSI at 50.49 and the Stochastic Oscillator at 75.6.
Third, upcoming economic data could weigh on silver. Investors are awaiting the release of the latest GDP and inflation data. Stronger-than-expected data could lead to a more hawkish stance from the Federal Reserve, which could put downward pressure on silver. The economic calendar shows several high-impact USD data releases in the coming days that could impact silver prices.
Multi-Timeframe Analysis: What's the REAL Trend?
To get a clearer picture, let's analyze XAGUSD across multiple timeframes. On the 1H chart, the trend is clearly bullish, with strong momentum and a breakout above key resistance. However, the overbought conditions suggest that a pullback is likely in the near term. On the 4H chart, the trend is also bullish, with the ADX indicating a strong trend is in place. However, the daily chart is less bullish, with the RSI in neutral territory and the Stochastic Oscillator indicating overbought conditions.
This multi-timeframe analysis suggests that XAGUSD is likely to continue to trend higher in the near term, but that the bullish momentum may be limited in the long term. The price action analysis confirms this view. XAGUSD has broken above key resistance levels, but the overbought conditions suggest that a pullback is likely in the near term. The key levels to watch are the 91.49 resistance level and the 89.65 support level. A break above the 91.49 level could open the door for a test of the 92.26 level. A break below the 89.65 level could lead to a deeper correction.
The Role of Market Sentiment
Market sentiment is also playing a role in XAGUSD's recent rally. Risk appetite is elevated, as evidenced by the SP500's rise to 6894.75. A risk-on environment typically supports silver prices, as investors seek higher-yielding assets. The Nasdaq100 is at 24998.76. This is also helping to support silver prices. This risk-on sentiment is likely to continue in the near term, which could provide further support for silver prices.
However, it is important to note that market sentiment can change quickly. A sudden shift in risk appetite could lead to a sharp sell-off in silver. The key is to remain vigilant and to be prepared to adjust your trading strategy as market conditions change. The DowJones30 is at 49188.5. This is also helping to support silver prices. The key is to remain vigilant and to be prepared to adjust your trading strategy as market conditions change.
XAGUSD Trade Plan: Riding the Momentum
Given the bullish momentum and the potential for further upside, here's a potential trade plan for XAGUSD. However, it's crucial to remember that this is a high-risk trade, and you should only risk what you can afford to lose.
XAGUSD breaks above $91.49 resistance, targeting $92.26 and potentially $93.33. This continuation relies on sustained risk appetite and a weakening dollar.
XAGUSD fails to hold above $89.65 support, leading to a correction towards $88.58 and potentially $87.81. This breakdown would be triggered by renewed dollar strength or a shift in risk sentiment.
Don't Ignore the Economic Calendar
The economic calendar is packed with potential catalysts that could impact XAGUSD. Keep a close eye on the USD data releases. The data could lead to a more hawkish stance from the Federal Reserve, which could put downward pressure on silver. The key is to remain vigilant and to be prepared to adjust your trading strategy as market conditions change.
Also, the EUR data releases could impact XAGUSD. The data could lead to a more dovish stance from the European Central Bank, which could put upward pressure on silver. The key is to remain vigilant and to be prepared to adjust your trading strategy as market conditions change.
The Bottom Line: Trade with Caution
XAGUSD's rally to $90.55 is undeniably exciting, but it's crucial to approach this market with caution. Overbought conditions, a potentially strengthening dollar, and upcoming economic data all pose significant risks. While the bullish momentum is strong, a pullback is likely in the near term. The key is to remain vigilant and to be prepared to adjust your trading strategy as market conditions change.
Frequently Asked Questions: XAGUSD Analysis
Is XAGUSD a good buy right now?
XAGUSD at $90.55 shows bullish momentum, but overbought signals suggest caution. A buy is viable above $91.49, with a tight stop-loss at $89.65 to manage risk.
What is the XAGUSD price forecast for this week?
The XAGUSD price forecast for this week targets $92.26 with a 60% probability if the bullish momentum sustains. Failure to break $91.49 could trigger a pullback to $88.58.
What are the key support and resistance levels for XAGUSD?
Key support for XAGUSD is at $89.65, $88.58 and $87.81. Key resistance levels are at $91.49, $92.26, and $93.33, as indicated by the live market data.
Why is XAGUSD moving today?
XAGUSD is moving today due to a combination of risk-on sentiment, a slight weakening of the dollar index, and a technical breakout above key resistance levels.
Track markets in real-time
AI-powered analysis, technical indicators and real-time price data.
Join Our Telegram Channel
Breaking market news, AI analysis and trading signals instantly.
Join Channel