XAGUSD today analysis shows the precious metal surging to $87.28, fueled by a confluence of technical factors and anticipation surrounding upcoming Personal Consumption Expenditures (PCE) data. The question now is whether this rally has legs, or if it's a short-lived burst before a correction.
Having tracked XAGUSD through various market cycles, it's clear that momentum is currently favoring the bulls. The daily change shows a significant 3.21% increase, translating to $2.71. This surge is noteworthy, especially given the broader market context, where the DXY (Dollar Index) sits at 97.17. Typically, a stronger dollar puts downward pressure on precious metals, but XAGUSD appears to be decoupling, indicating strong underlying demand. The SP500, currently at 6860.7, is down 0.71%, suggesting a risk-off sentiment that often benefits safe-haven assets like silver.
Technical Deep Dive: Is This Rally Sustainable?
A multi-timeframe analysis reveals a compelling, yet nuanced picture. On the 1-hour chart, the trend is decidedly bullish, boasting a strength of 100%. However, the RSI(14) at 81.14 signals overbought conditions. This doesn't necessarily mean an immediate reversal, but it does suggest that the rally may be losing steam in the short term. The MACD, displaying positive momentum above its signal line, supports the bullish thesis, but traders should watch for any signs of divergence, which could foreshadow a pullback.
The Stochastic oscillator, with %K at 91.14 and %D at 93.57, further reinforces the overbought narrative. An ADX of 44.78 indicates a strong uptrend, suggesting that the prevailing bullish momentum is likely to persist. However, with the oscillators flashing red, a period of consolidation or a minor correction wouldn't be surprising. The overall signal from the 1-hour timeframe is AL, with 6 indicators signaling 'Buy,' 2 signaling 'Sell,' and none remaining neutral.
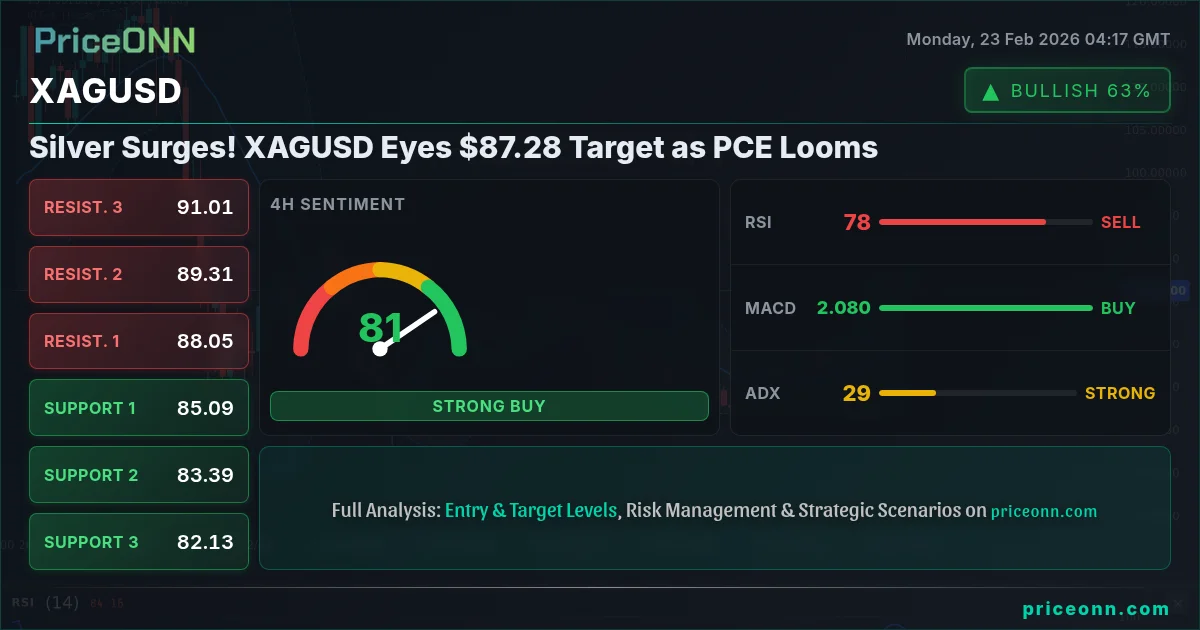
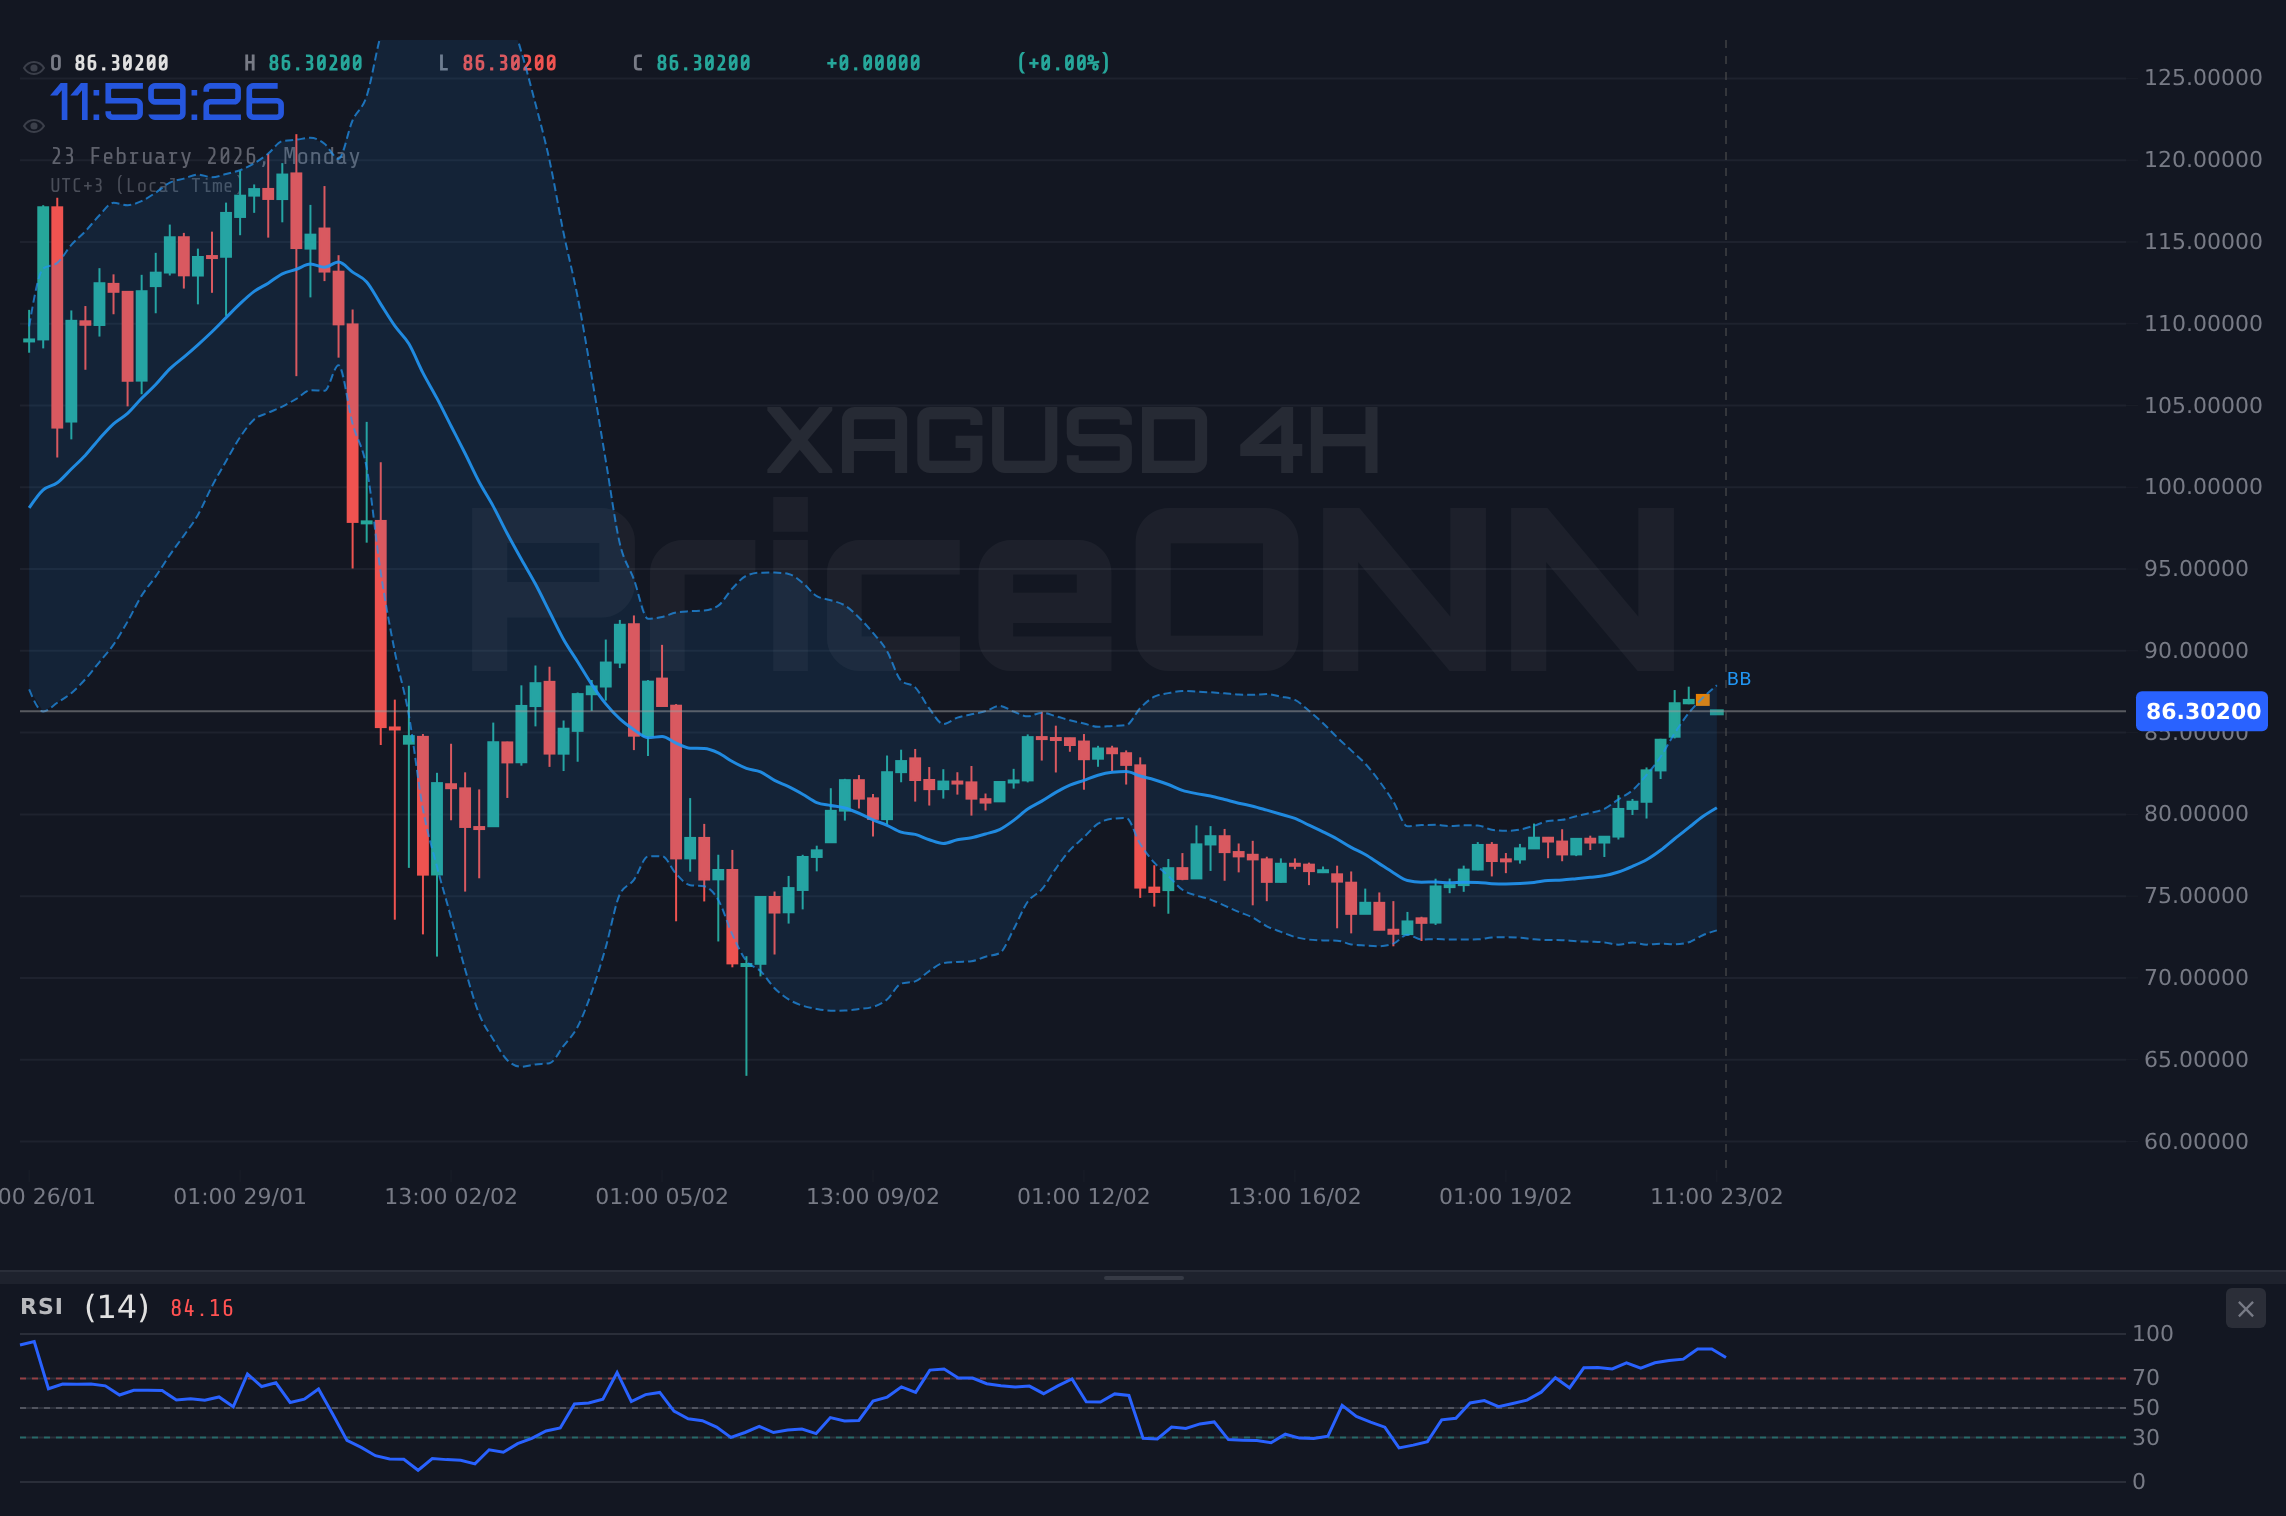
Stepping back to the 4-hour chart, the trend is neutral, with a strength of 50%. The RSI(14) is also in overbought territory at 78.4. The MACD mirrors the 1-hour chart, showing positive momentum. The Stochastic oscillator is even more extreme, with %K at 97.66 and %D at 85.28. The ADX registers at 26.97, still indicating a strong uptrend. The overall signal is AL, with 5 indicators signaling 'Buy,' 3 signaling 'Sell,' and none remaining neutral.
On the daily chart, the trend is bullish, with a strength of 90%. The RSI(14) is at 53.58, indicating room for further upside. The MACD, however, shows negative momentum below its signal line, which presents a conflicting signal. The Stochastic oscillator signals a bullish crossover, with %K at 76.85 above %D at 53.56. The ADX measures 29.06, confirming a strong uptrend. The overall signal is AL, with 7 indicators signaling 'Buy,' 1 signaling 'Sell,' and none remaining neutral.
Key Price Levels: Where to Watch for Support and Resistance
From a price action analysis perspective, XAGUSD is currently testing a critical resistance zone around $88. A decisive break above this level could pave the way for a further rally towards $88.44 and $89.07. On the downside, immediate support lies at $86.93, followed by $86.3 and $85.86. These levels represent potential areas where buyers may step in to defend the uptrend. A break below $85.86 would raise concerns about a more significant correction.
Historically, when the RSI reaches levels seen today on XAGUSD, the outcome has been mixed. Sometimes, price continues to grind higher, fueled by strong momentum. Other times, the overbought conditions lead to a sharp reversal. Having tracked XAGUSD through the 2024 rate cycle, I've observed that silver is prone to sudden volatility spikes, especially around key economic data releases. The PCE data release is therefore a major event to watch.
Economic Calendar: PCE Data in Focus
The market's attention is now squarely focused on the upcoming PCE data release. As a high importance event for the USD, any deviation from expectations will likely trigger significant volatility in XAGUSD. If the PCE figures come in higher than expected, it could signal persistent inflation, potentially prompting the Federal Reserve to maintain its hawkish stance. This could strengthen the dollar and exert downward pressure on XAGUSD. Conversely, a weaker-than-expected PCE reading could weaken the dollar and provide further tailwinds for silver.
According to Reuters, Fed officials are closely monitoring inflation data to gauge the appropriate path for monetary policy. The market is currently pricing in a certain degree of rate cuts later in the year, but a strong PCE reading could force investors to recalibrate their expectations. This is exactly where you need to pay attention; the market's reaction to the data will provide valuable clues about the future direction of XAGUSD.
Trade Plan: Riding the Silver Wave, or Bracing for a Crash?
Given the current technical and fundamental backdrop, a strategic approach is warranted. While the overall trend is bullish, the overbought conditions suggest that patience may be rewarded. Here's a potential trade plan for both bullish and bearish scenarios:
XAGUSD breaks above $88, confirming the breakout. Target $88.44 initially, with potential extension to $89.07. Momentum indicators remain supportive, with MACD continuing its positive trajectory.
XAGUSD fails to break above $88 and retraces back below $86.93. Initial target is $86.3, followed by $85.86. Overbought indicators lead to profit-taking and a correction.
Risk Warning
Traders should be aware that the upcoming PCE data release could trigger significant volatility in XAGUSD. It's crucial to manage risk appropriately and avoid overleveraging positions. Furthermore, keep an eye on the DXY; any unexpected strength in the dollar could quickly derail the bullish narrative for silver.
Frequently Asked Questions: XAGUSD Analysis
Is XAGUSD a good buy right now?
XAGUSD is showing bullish momentum at $87.28, but RSI indicates overbought conditions. A cautious approach is advised, waiting for a confirmed breakout above $88 or a retracement to support at $86.93 before entering a long position.
What is the XAGUSD price forecast for this week?
The XAGUSD price forecast for this week depends on the PCE data. A strong PCE could push it down to $86.3. A weak PCE could rally it to $89.07.
What are the key support and resistance levels for XAGUSD?
Key support levels for XAGUSD are $86.93, $86.3 and $85.86. Key resistance levels are $88, $88.44 and $89.07. These levels will likely dictate short-term price action.
Why is XAGUSD moving today?
XAGUSD is moving today due to a combination of technical factors and anticipation of the PCE data release. The SP500 is down, suggesting a risk-off sentiment that often benefits safe-haven assets like silver.
Track markets in real-time
AI-powered analysis, technical indicators and real-time price data.
Join Our Telegram Channel
Breaking market news, AI analysis and trading signals instantly.
Join Channel