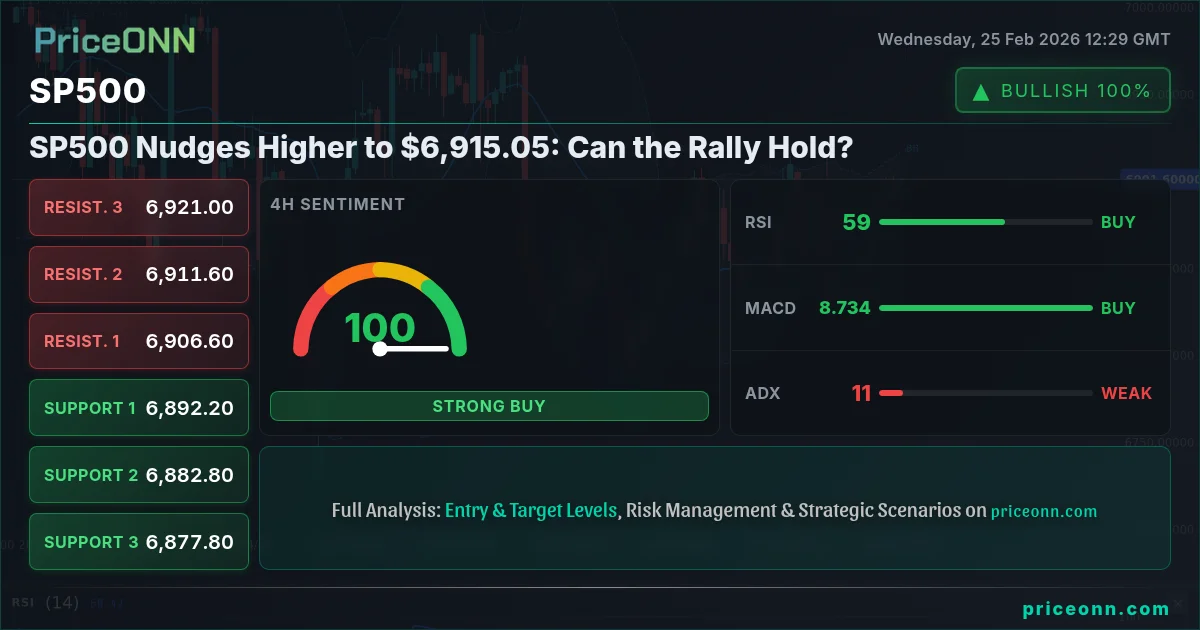
SP500 today analysis reveals a market struggling to find clear direction, currently trading at $6,915.05. While the index has eked out a minor gain, the underlying technical picture suggests caution. The question now is whether this upward tick represents a sustainable recovery or merely a brief respite before bears resume control. Several conflicting signals are at play, making it crucial for traders to approach the market with a well-defined strategy and keen awareness of potential risks.
- RSI at 69.15 on the 1H chart suggests short-term overbought conditions.
- Critical near-term support sits at $6,896.3, a level tested multiple times today.
- MACD histogram on the daily chart shows positive momentum, but the ADX at 28.55 indicates a strong downtrend overall.
- The SP500's correlation with DXY remains a key factor, especially amid upcoming USD data releases.
Mixed Signals: Bulls Struggle for Control
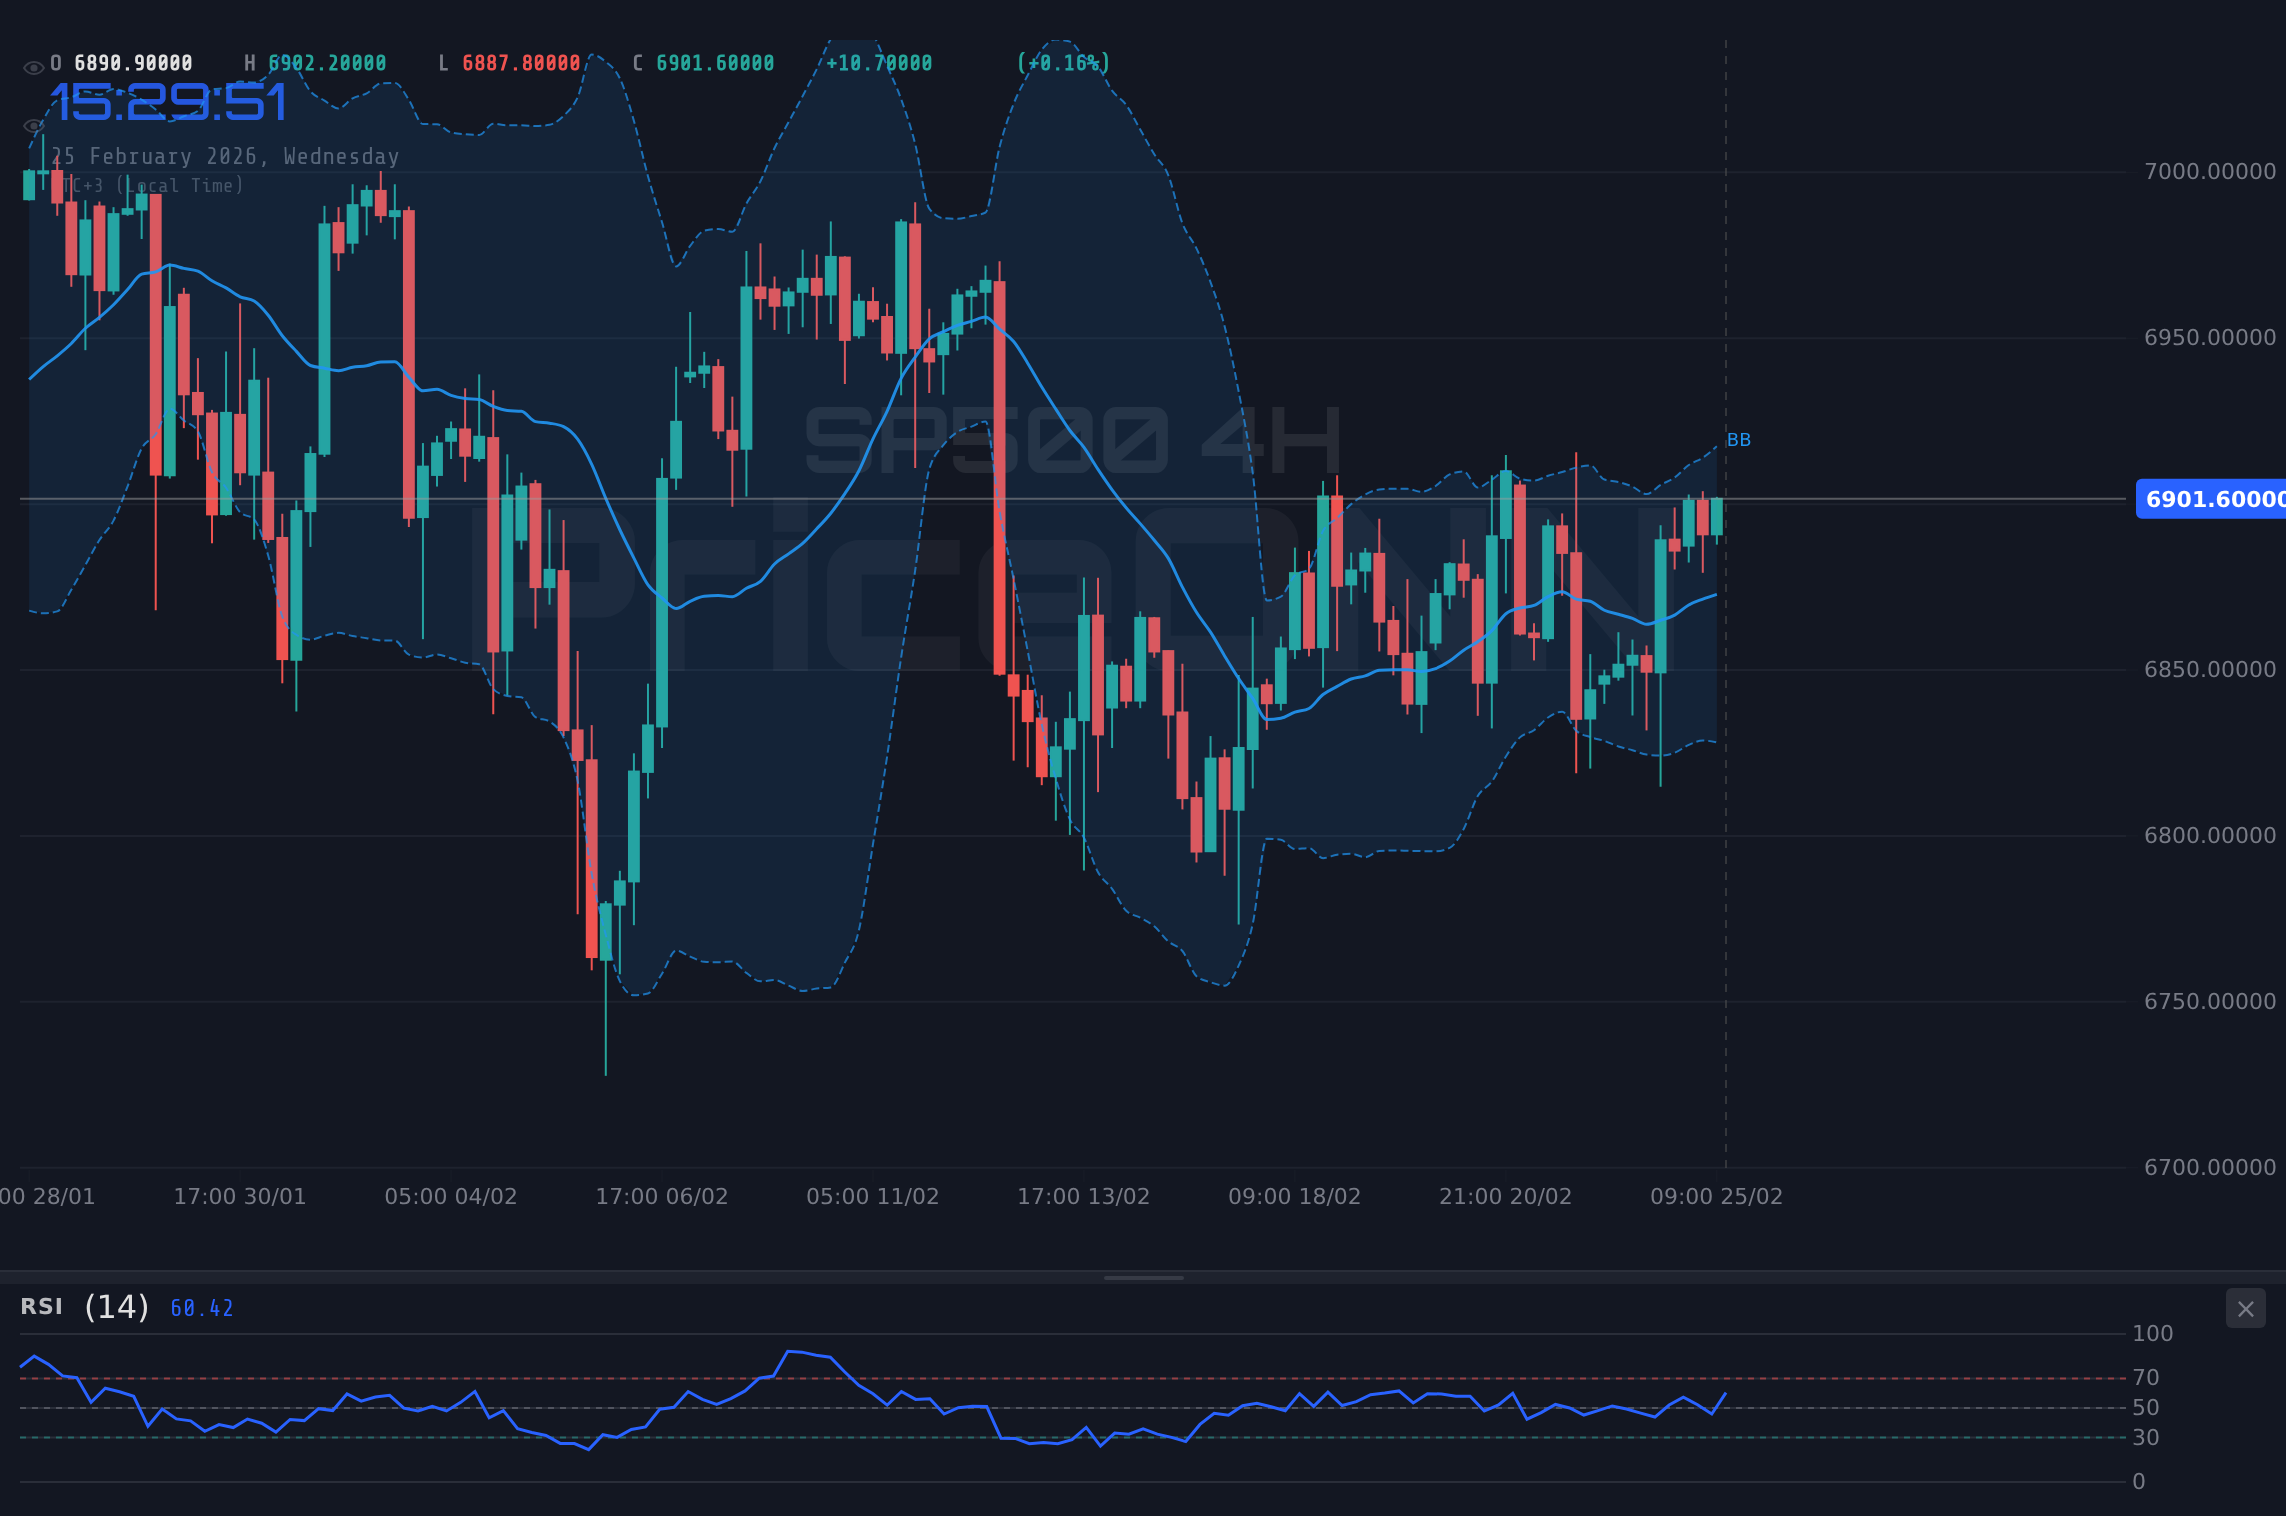
The current SP500 price action can best be described as tentative. While the index has managed to climb to $6,915.05, the strength of this move is questionable. Looking at the hourly chart, the RSI hovering around 69.15 suggests that the market may be entering overbought territory, potentially signaling an imminent pullback. This is not a definitive sell signal, but it should certainly make bulls cautious about chasing the rally higher. Seasoned traders know that an overbought RSI reading in isolation is not enough to warrant a short position; confirmation from other indicators or price action is required.
One of the biggest challenges facing traders right now is the conflicting signals across different timeframes. While the daily chart shows positive MACD momentum, which could be interpreted as a sign of underlying strength, the ADX reading of 28.55 tells a different story. An ADX above 25 typically indicates a strong trend, but in this case, it points to a strong downtrend. This divergence between momentum and trend strength suggests that the recent gains may be counter-trend moves within a broader bearish context. This is exactly where multi-timeframe analysis becomes crucial. Scalpers may be tempted to play the short-term upside, but swing traders and long-term investors need to be wary of the overall bearish bias.
$6,896.3: The Line in the Sand for SP500
From a technical standpoint, the $6,896.3 level is now a critical area to watch. This price point has acted as support on multiple occasions in the last few hours, and a decisive break below this level could pave the way for further declines. A break below $6,896.3 would likely trigger a fresh wave of selling pressure, potentially pushing the SP500 down towards the next support level at $6,878.83. It's crucial to remember that support and resistance levels are not impenetrable barriers; they are simply areas where price is likely to encounter increased buying or selling pressure. The strength of a support or resistance level depends on several factors, including the number of times it has been tested, the volume of trading activity around that level, and the overall market context.
Historically, the SP500 has often exhibited a pattern of "stair-stepping" down during bearish phases. This involves a series of lower highs and lower lows, with brief periods of consolidation or even upward correction in between. If the current rally fails to gain traction and the $6,896.3 support is breached, we could see a continuation of this stair-stepping pattern, potentially leading to a more significant correction. This historical context is important for long-term investors, who need to be prepared for the possibility of further downside risk.
DXY Strength Adds Pressure
The strength of the US dollar, as measured by the DXY, is another factor weighing on the SP500. With the DXY currently trading at 97.58, the strengthening dollar is putting downward pressure on risk assets, including equities. The inverse correlation between the DXY and the SP500 is a well-established phenomenon, and traders need to be aware of this relationship when making investment decisions. When the dollar strengthens, it typically makes US exports more expensive and less competitive, which can negatively impact the earnings of US companies. Furthermore, a stronger dollar can also lead to tighter financial conditions, which can further dampen economic growth.
The SP500's correlation with DXY is particularly important to watch in the context of upcoming USD data releases. Traders are keenly awaiting fresh data, including the recent numbers, to gauge the strength of the US economy and the likely path of Federal Reserve policy. Stronger-than-expected data could further bolster the dollar, potentially exacerbating the downward pressure on the SP500. Conversely, weaker-than-expected data could lead to a reversal of the dollar's recent gains, providing some relief for the equity market. The market's reaction to these data releases will likely depend on whether the numbers beat or miss expectations, as well as the overall market sentiment at the time.
Economic Calendar in Focus: Data Holds the Key
The economic calendar is loaded with potentially market-moving events. Key USD data releases are on the horizon, and traders will be closely watching these figures for clues about the health of the US economy and the future direction of monetary policy. It is important to note that these figures came in at 91.2 vs 87.4 and Previous at 89. This data is expected to have a significant impact on market sentiment and could trigger sharp moves in both the dollar and the SP500. The market's reaction to these data releases will likely depend on whether the numbers beat or miss expectations, as well as the overall market sentiment at the time.
The upcoming EUR data releases are also worth monitoring, as developments in the Eurozone can indirectly impact the SP500. Any signs of weakness in the Eurozone economy could further strengthen the dollar, potentially adding to the downward pressure on US equities. Traders should also keep an eye on geopolitical developments, as unexpected events in other parts of the world can often trigger risk-off sentiment and lead to a flight to safety, benefiting the dollar and weighing on risk assets like the SP500. The market is a complex and interconnected ecosystem, and it is important to consider all of these factors when making investment decisions.
Scalpers, Swing Traders, and Long-Term Investors: Different Strategies
The appropriate trading strategy for the SP500 depends on the trader's time horizon and risk tolerance. Scalpers, who typically hold positions for only a few minutes or hours, may be able to capitalize on short-term fluctuations in price, regardless of the overall trend. However, scalping is a high-risk strategy that requires quick reflexes and a deep understanding of market microstructure. Swing traders, who hold positions for several days or weeks, need to be more aware of the overall trend and the key support and resistance levels. They may look to buy dips in an uptrend or sell rallies in a downtrend, but they need to be careful to manage their risk and avoid getting caught on the wrong side of the market.
Long-term investors, who hold positions for months or years, should focus on the fundamental outlook for the SP500 and the underlying companies. They should be less concerned with short-term price fluctuations and more focused on the long-term growth potential of the market. However, even long-term investors need to be aware of the risks and manage their portfolios accordingly. Diversification, regular rebalancing, and a disciplined investment approach are essential for long-term success.
Correlation Analysis: DXY, Bonds, and Oil
A comprehensive understanding of the SP500 requires an analysis of its correlations with other asset classes. As mentioned earlier, the inverse correlation with the DXY is a key factor to watch. In addition, the SP500 is also correlated with bond yields. Rising bond yields typically put downward pressure on equities, as they increase the cost of capital for companies and make bonds more attractive relative to stocks. The relationship between the SP500 and oil prices is more complex, as it can be influenced by a variety of factors, including inflation expectations, geopolitical risks, and the overall state of the global economy. Generally, rising oil prices tend to be positive for energy stocks but negative for other sectors of the market.
Understanding these correlations can help traders and investors make more informed decisions and manage their risk more effectively. For example, if you are bullish on the SP500, you may want to consider hedging your position by going short the DXY or buying put options on Treasury bonds. Conversely, if you are bearish on the SP500, you may want to consider going long the DXY or buying call options on Treasury bonds. Correlation analysis is a powerful tool that can help you navigate the complexities of the financial markets and improve your overall investment performance.
Frequently Asked Questions: SP500 Analysis
Is SP500 a good buy right now?
With the SP500 at $6,915.05, the short-term picture is mixed. A decisive break above $6,928.03 on the 4H chart could signal a buying opportunity, but caution is warranted given the overall downtrend.
What is the SP500 price forecast for this week?
The SP500 price forecast for this week is highly dependent on upcoming economic data. If data is strong, we could see a test of $6,950.8. Weak data could send the index back towards $6,834.2.
What are the key support and resistance levels for SP500?
Key support levels for SP500 are at $6,834.2, $6,782.4 and $6,750. Resistance levels to watch are $6,918.4, $6,950.8 and $7,002.6, all derived from the daily chart.
Why is SP500 moving today?
SP500 is moving today due to a combination of factors, including DXY strength and anticipation of upcoming economic data releases. The positive momentum, however, is being capped by the strong downtrend signalled in the daily chart.
Track markets in real-time
AI-powered analysis, technical indicators and real-time price data.
Join Our Telegram Channel
Breaking market news, AI analysis and trading signals instantly.
Join Channel