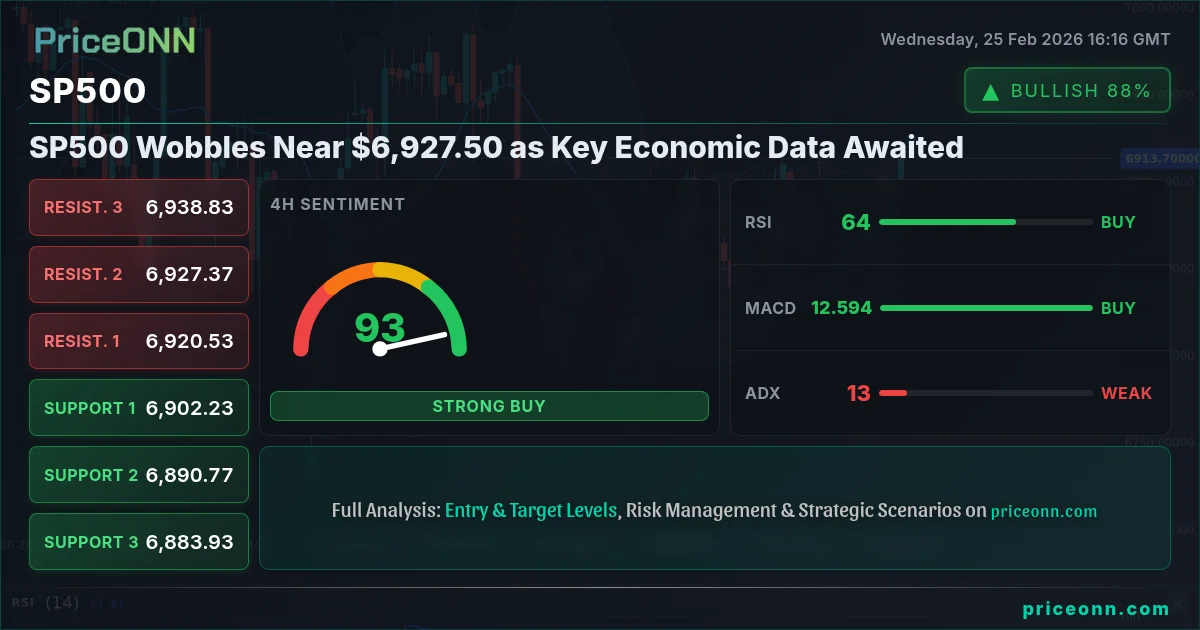
SP500's current price near $6,927.50 reflects a market in anticipation, with traders closely monitoring upcoming economic data releases. The index has shown resilience, but the question remains whether this upward momentum can be sustained.
- RSI at 73.65 on the 1H chart indicates overbought conditions, suggesting potential for a pullback.
- Key resistance lies at $6,938, a breakout above which could signal further gains.
- ADX at 11.84 on the 4H chart shows a weak trend, implying that the current price action may lack strong conviction.
- Upcoming USD economic data could significantly impact SP500's direction.
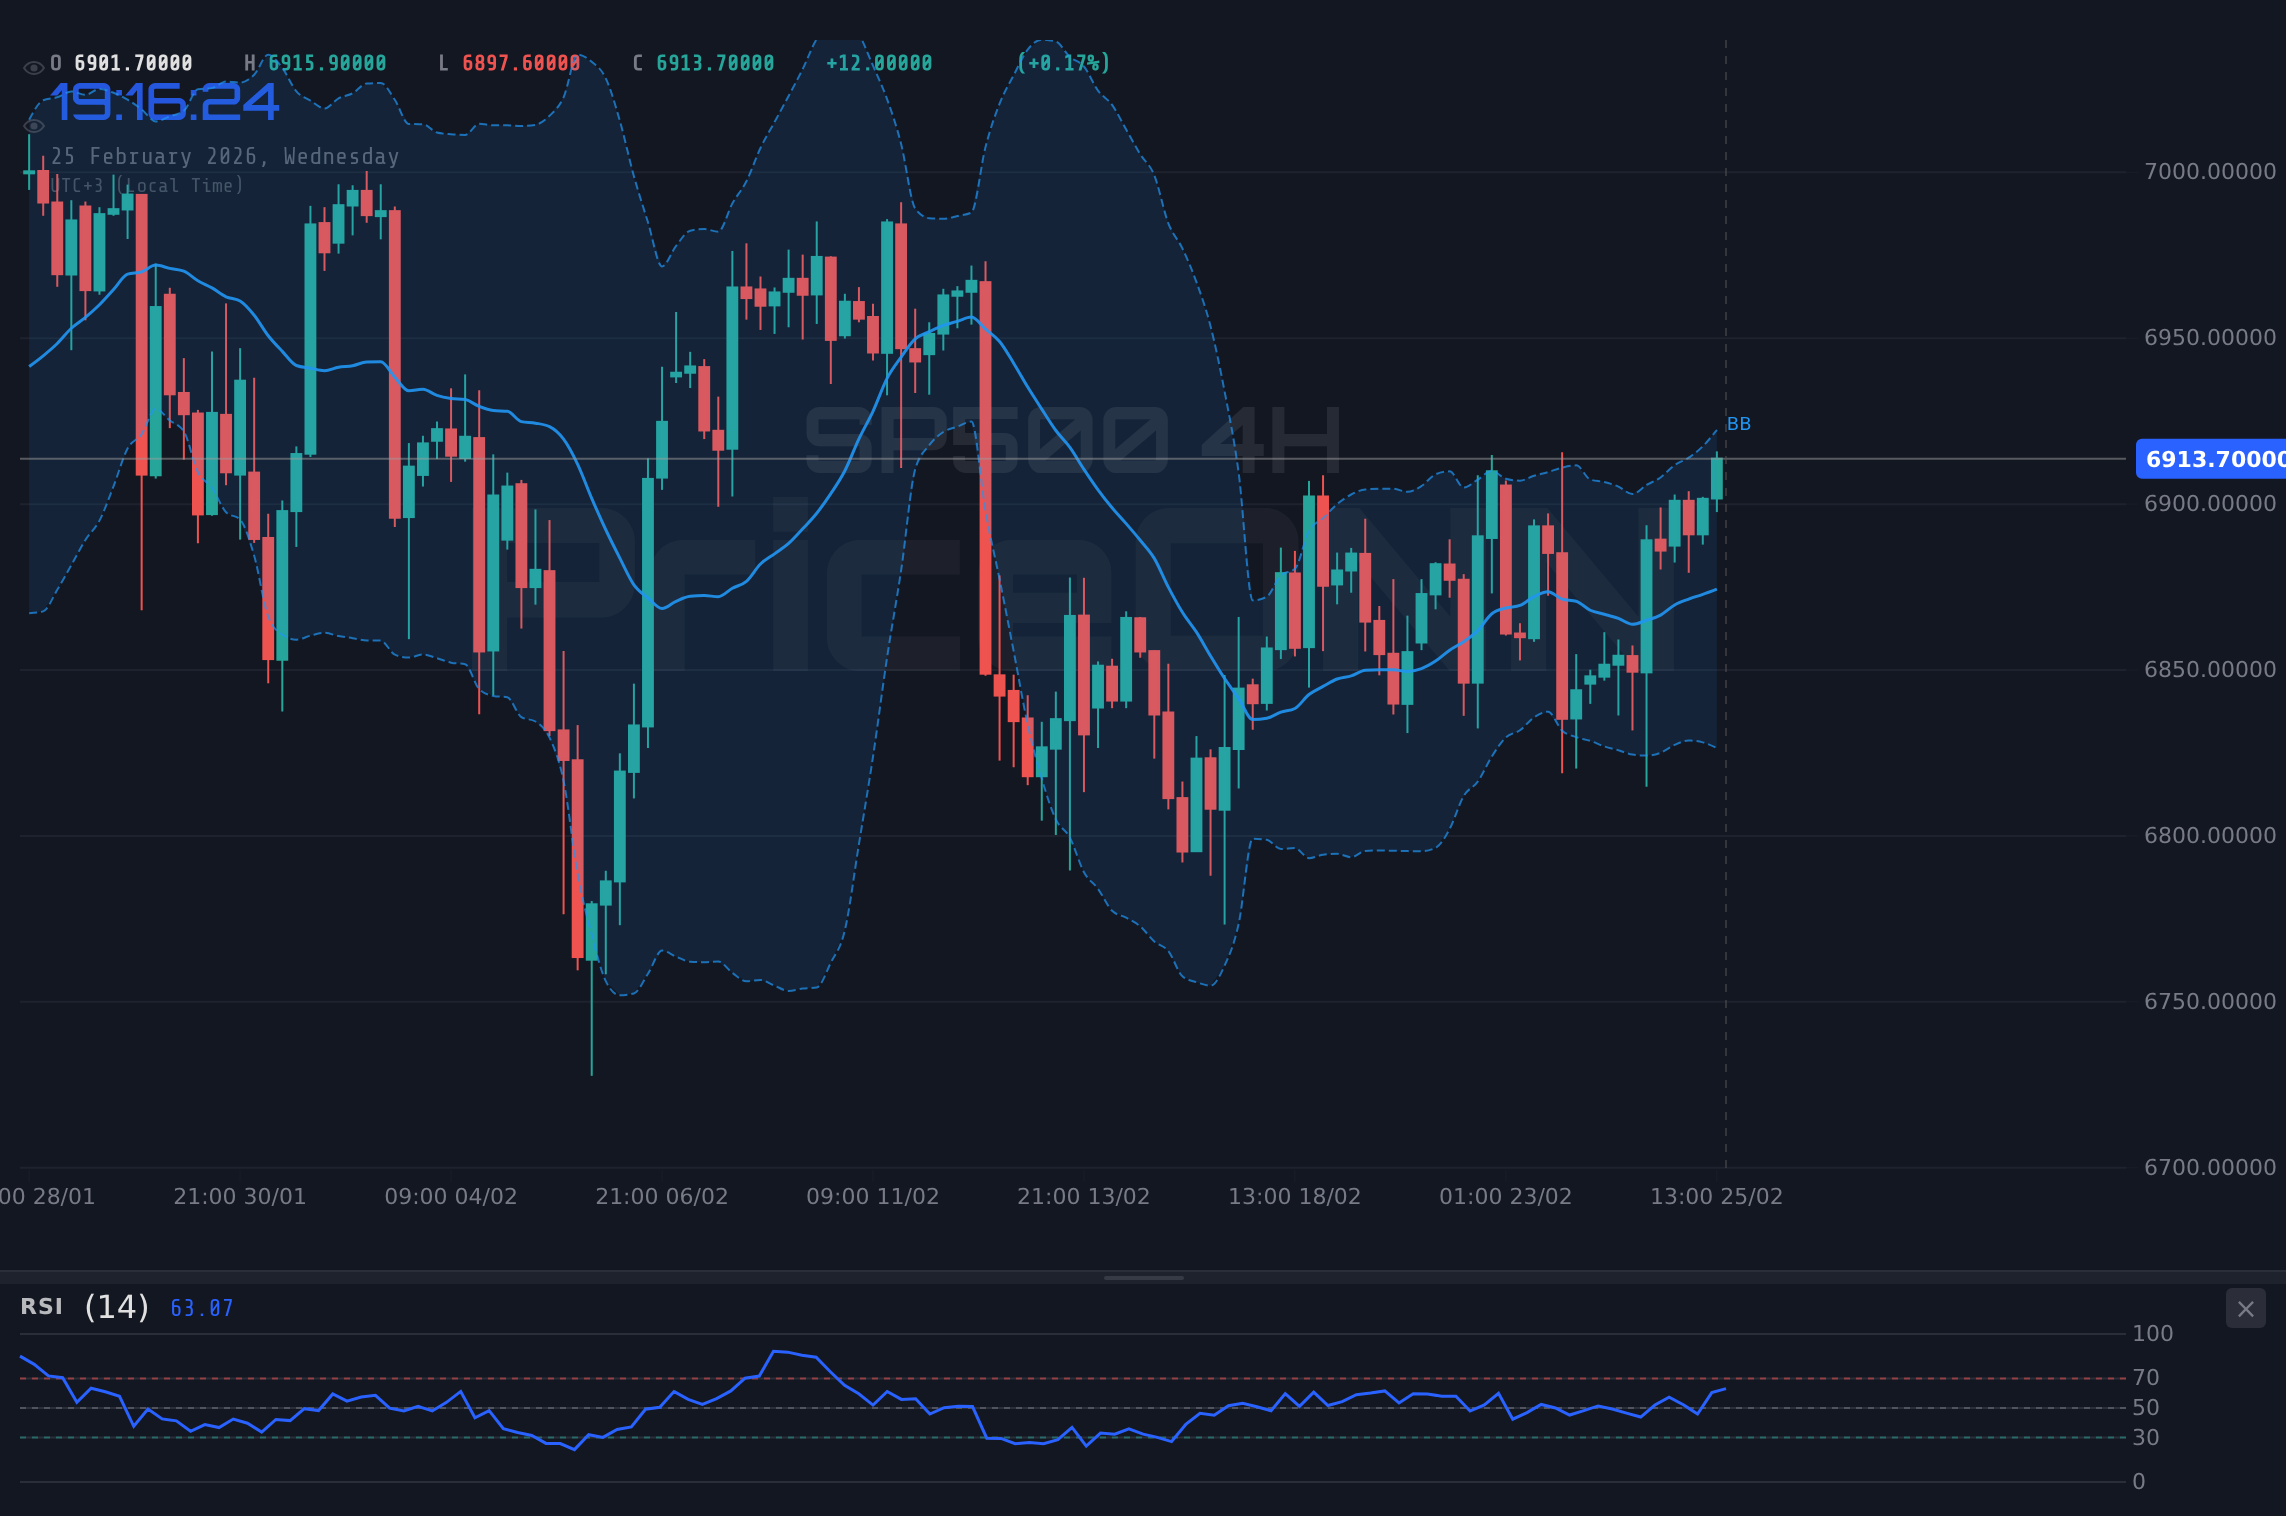
The SP500's daily gain of 0.6% is modest, especially considering its recent range of 6879.3 to 6935.3. This tight range suggests a market in consolidation, awaiting a catalyst to trigger a more decisive move. SP500 today analysis reveals that the index is struggling to break free from this consolidation pattern.
Examining the technical indicators provides a mixed picture. The 1-hour RSI at 73.65 suggests that the market is nearing overbought territory. Historically, when RSI reaches this zone on SP500, the outcome has been a temporary pullback as profit-taking emerges. However, the MACD on the same timeframe remains positive, indicating that bullish momentum is still present, albeit potentially weakening. The Stochastic indicator, with K=87.07 and D=89, further supports the overbought narrative, highlighting the need for caution among bullish traders.
The ADX, however, presents a contrasting view. On the 4-hour chart, the ADX reads 11.84, a very weak trend reading. A weak-trend reading like this means the breakout hasn't committed yet, and it could go either way. This suggests that the current upward move lacks the strength to develop into a sustained rally. This is exactly where you need to pay attention. If the ADX remains below 20, the SP500 could easily reverse its course.
Key levels to watch are the support at 6916.1 on the 1-hour chart. SP500 support and resistance levels are critical for understanding potential price movements. Should this level fail to hold, further downside could target 6903.8 and then 6894.2. On the upside, the resistance at 6938 is the immediate barrier. A decisive break above this level could open the door to 6947.6 and potentially 6959.9. Given the overbought conditions and weak trend strength, a breakout to the upside would need significant volume and momentum to be sustained.
From a multi-timeframe analysis perspective, the SP500 presents conflicting signals. While the 1-hour and 4-hour charts show bullish momentum, the daily chart paints a different picture. The 1D chart shows a downtrend with 89% strength, with resistance at 6918.4 and 6950.8. The daily RSI at 53.47 is neutral, but the MACD, while positive, is not as strong as on the shorter timeframes. This divergence in signals highlights the complexity of the current market environment and the need for traders to exercise caution.
The current SP500 trend analysis indicates that the index is at a critical juncture. The conflicting signals across different timeframes suggest that the market is indecisive, awaiting a catalyst to determine its next direction. With the SP500 weekly outlook still uncertain, traders should closely monitor the key levels mentioned above and be prepared for potential volatility.
The SP500 news impact is closely tied to upcoming economic data releases. The market is particularly focused on the USD data expected. Stronger-than-expected data could fuel further gains in the dollar, potentially putting downward pressure on the SP500. Conversely, weaker-than-expected data could weaken the dollar and provide a boost to the index. With the current DXY level at 97.42, the SP500 is particularly sensitive to any significant moves in the dollar index.
SP500 market sentiment remains cautiously optimistic, but the overbought conditions and weak trend strength suggest that this sentiment could quickly shift. The lack of a clear directional signal from the ADX indicates that the market is vulnerable to sudden reversals. Traders should be prepared for potential stop hunts and liquidity grabs as the market seeks to establish a clear direction. The volatility analysis suggests that the market is ripe for a breakout, but the direction of that breakout remains uncertain.
The SP500 key levels are crucial for identifying potential trading opportunities. The support levels at 6916.1, 6903.8, and 6894.2 provide potential entry points for bullish traders, while the resistance levels at 6938, 6947.6, and 6959.9 offer potential targets for profit-taking. However, given the conflicting signals and weak trend strength, traders should exercise caution and manage their risk accordingly. The market always gives a second chance.
From a fundamental perspective, the SP500 is influenced by a variety of factors, including central bank policies, macroeconomic data, and geopolitical risks. The Fed's stance on interest rates is a key driver of market sentiment. Any hints of a more hawkish stance could trigger a selloff in equities, while a more dovish stance could provide further support. The upcoming USD economic data will provide further clues as to the Fed's likely course of action. According to Reuters, Fed officials have emphasized the need for further data before making any decisions on interest rates.
The SP500's correlation with other asset classes is also important to consider. The index typically has an inverse relationship with the dollar index (DXY). A rising DXY puts downward pressure on the SP500, while a falling DXY provides support. However, this relationship is not always consistent, and other factors can also influence the SP500's performance. Risk appetite, as measured by the VIX, also plays a significant role. A rising VIX indicates increased risk aversion and typically leads to a selloff in equities. Conversely, a falling VIX indicates increased risk appetite and typically supports gains in equities.
Considering the current technical and fundamental factors, the SP500 presents a challenging trading environment. The conflicting signals, weak trend strength, and upcoming economic data releases create uncertainty. Traders should exercise caution and manage their risk accordingly. While the potential for a breakout exists, the direction of that breakout remains uncertain. Patience looks like it will be rewarded here.
Frequently Asked Questions: SP500 Analysis
Is SP500 a good buy right now?
Given the current overbought conditions and weak trend strength, SP500 may not be a good buy right now unless it breaks above the resistance level of 6938 with strong volume. Traders should wait for a clear signal before entering a long position.
What is the SP500 price forecast for this week?
The SP500 price forecast for this week is highly dependent on the upcoming economic data releases. If the data is stronger than expected, the index could face downward pressure, potentially targeting the support levels around 6916.1. Conversely, weaker data could provide a boost, potentially pushing the index towards the resistance level of 6938 and beyond.
What are the key support and resistance levels for SP500?
The key support levels for SP500 are 6916.1, 6903.8, and 6894.2. The key resistance levels are 6938, 6947.6, and 6959.9. These levels should be closely monitored for potential trading opportunities.
Why is SP500 moving today?
SP500 is moving today due to a combination of technical factors and anticipation of upcoming economic data releases. The overbought conditions are creating downward pressure, while the expectation of weaker data may be providing some support. The index is essentially range-bound until a clear catalyst emerges.
Technical Outlook Summary
| Indicator | Value | Signal |
|---|---|---|
| RSI (14) | 73.65 | Overbought |
| MACD Histogram | Positive | Bullish |
| Stochastic | K=87.07, D=89 | Overbought |
| ADX | 11.84 | Weak |
| Bollinger | Upper Band | Watch |
Key Levels
Support Levels
Resistance Levels
Track markets in real-time
AI-powered analysis, technical indicators and real-time price data.
Join Our Telegram Channel
Breaking market news, AI analysis and trading signals instantly.
Join Channel