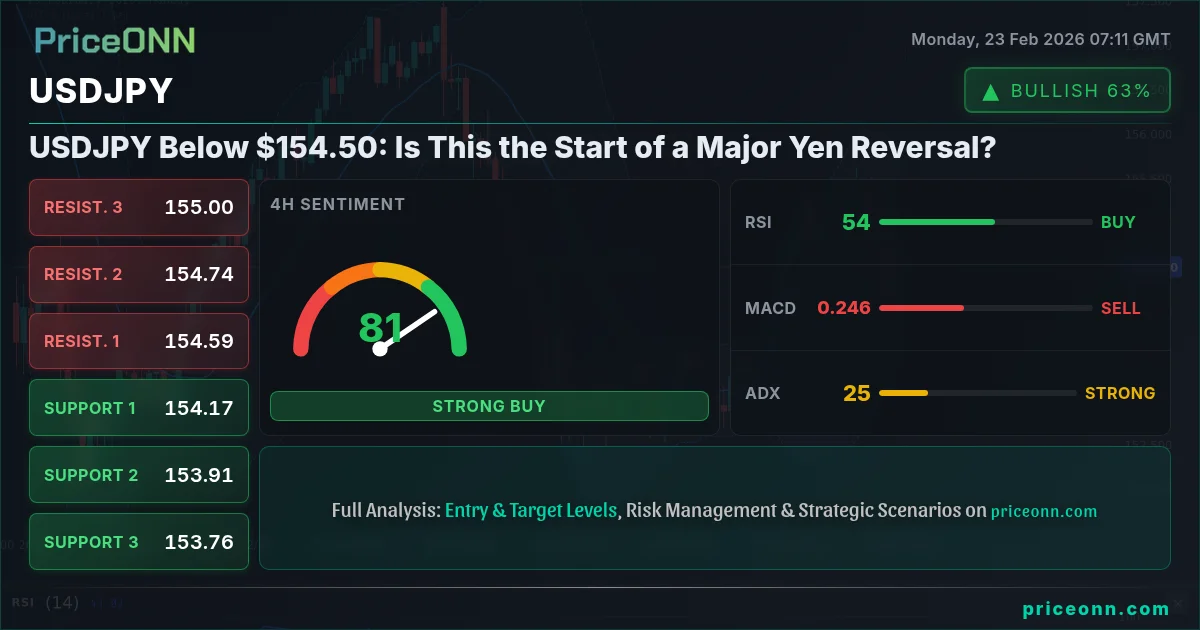
USDJPY is currently trading at $154.50, a critical threshold that has traders on edge. With the yen's strength being tested, the question arises: is this the beginning of a significant reversal or just a temporary fluctuation?
- Current price sits at $154.50, a pivotal level for potential reversal.
- Key support stands at $154.37, with resistance expected around $154.83.
- MACD shows strong bearish momentum, while RSI is hovering at 42.76, indicating potential downward pressure.
- Watch for the DXY index movements, as a stronger dollar may exert further pressure on the yen.
The USDJPY has shown a downward trend, reflecting broader market sentiments and macroeconomic factors. The recent price action indicates a struggle for the currency pair as it hovers near the $154.50 mark, a level that has significant implications for both short-term and long-term traders. As we analyze this currency pair, it's crucial to consider various indicators that point towards a potential reversal in favor of the yen, or whether the dollar can maintain its strength over the near term.
In the 1-hour timeframe, the trend remains neutral, with an ADX of 35.32 indicating a strong downward trend. The support level is currently at $154.37, while resistance is seen at $154.83. The RSI, sitting at 42.76, is indicative of a potential bearish momentum as the market may be gearing up for a further decline. Meanwhile, the MACD has been showing negative momentum, further confirming the downward pressure on the USDJPY.
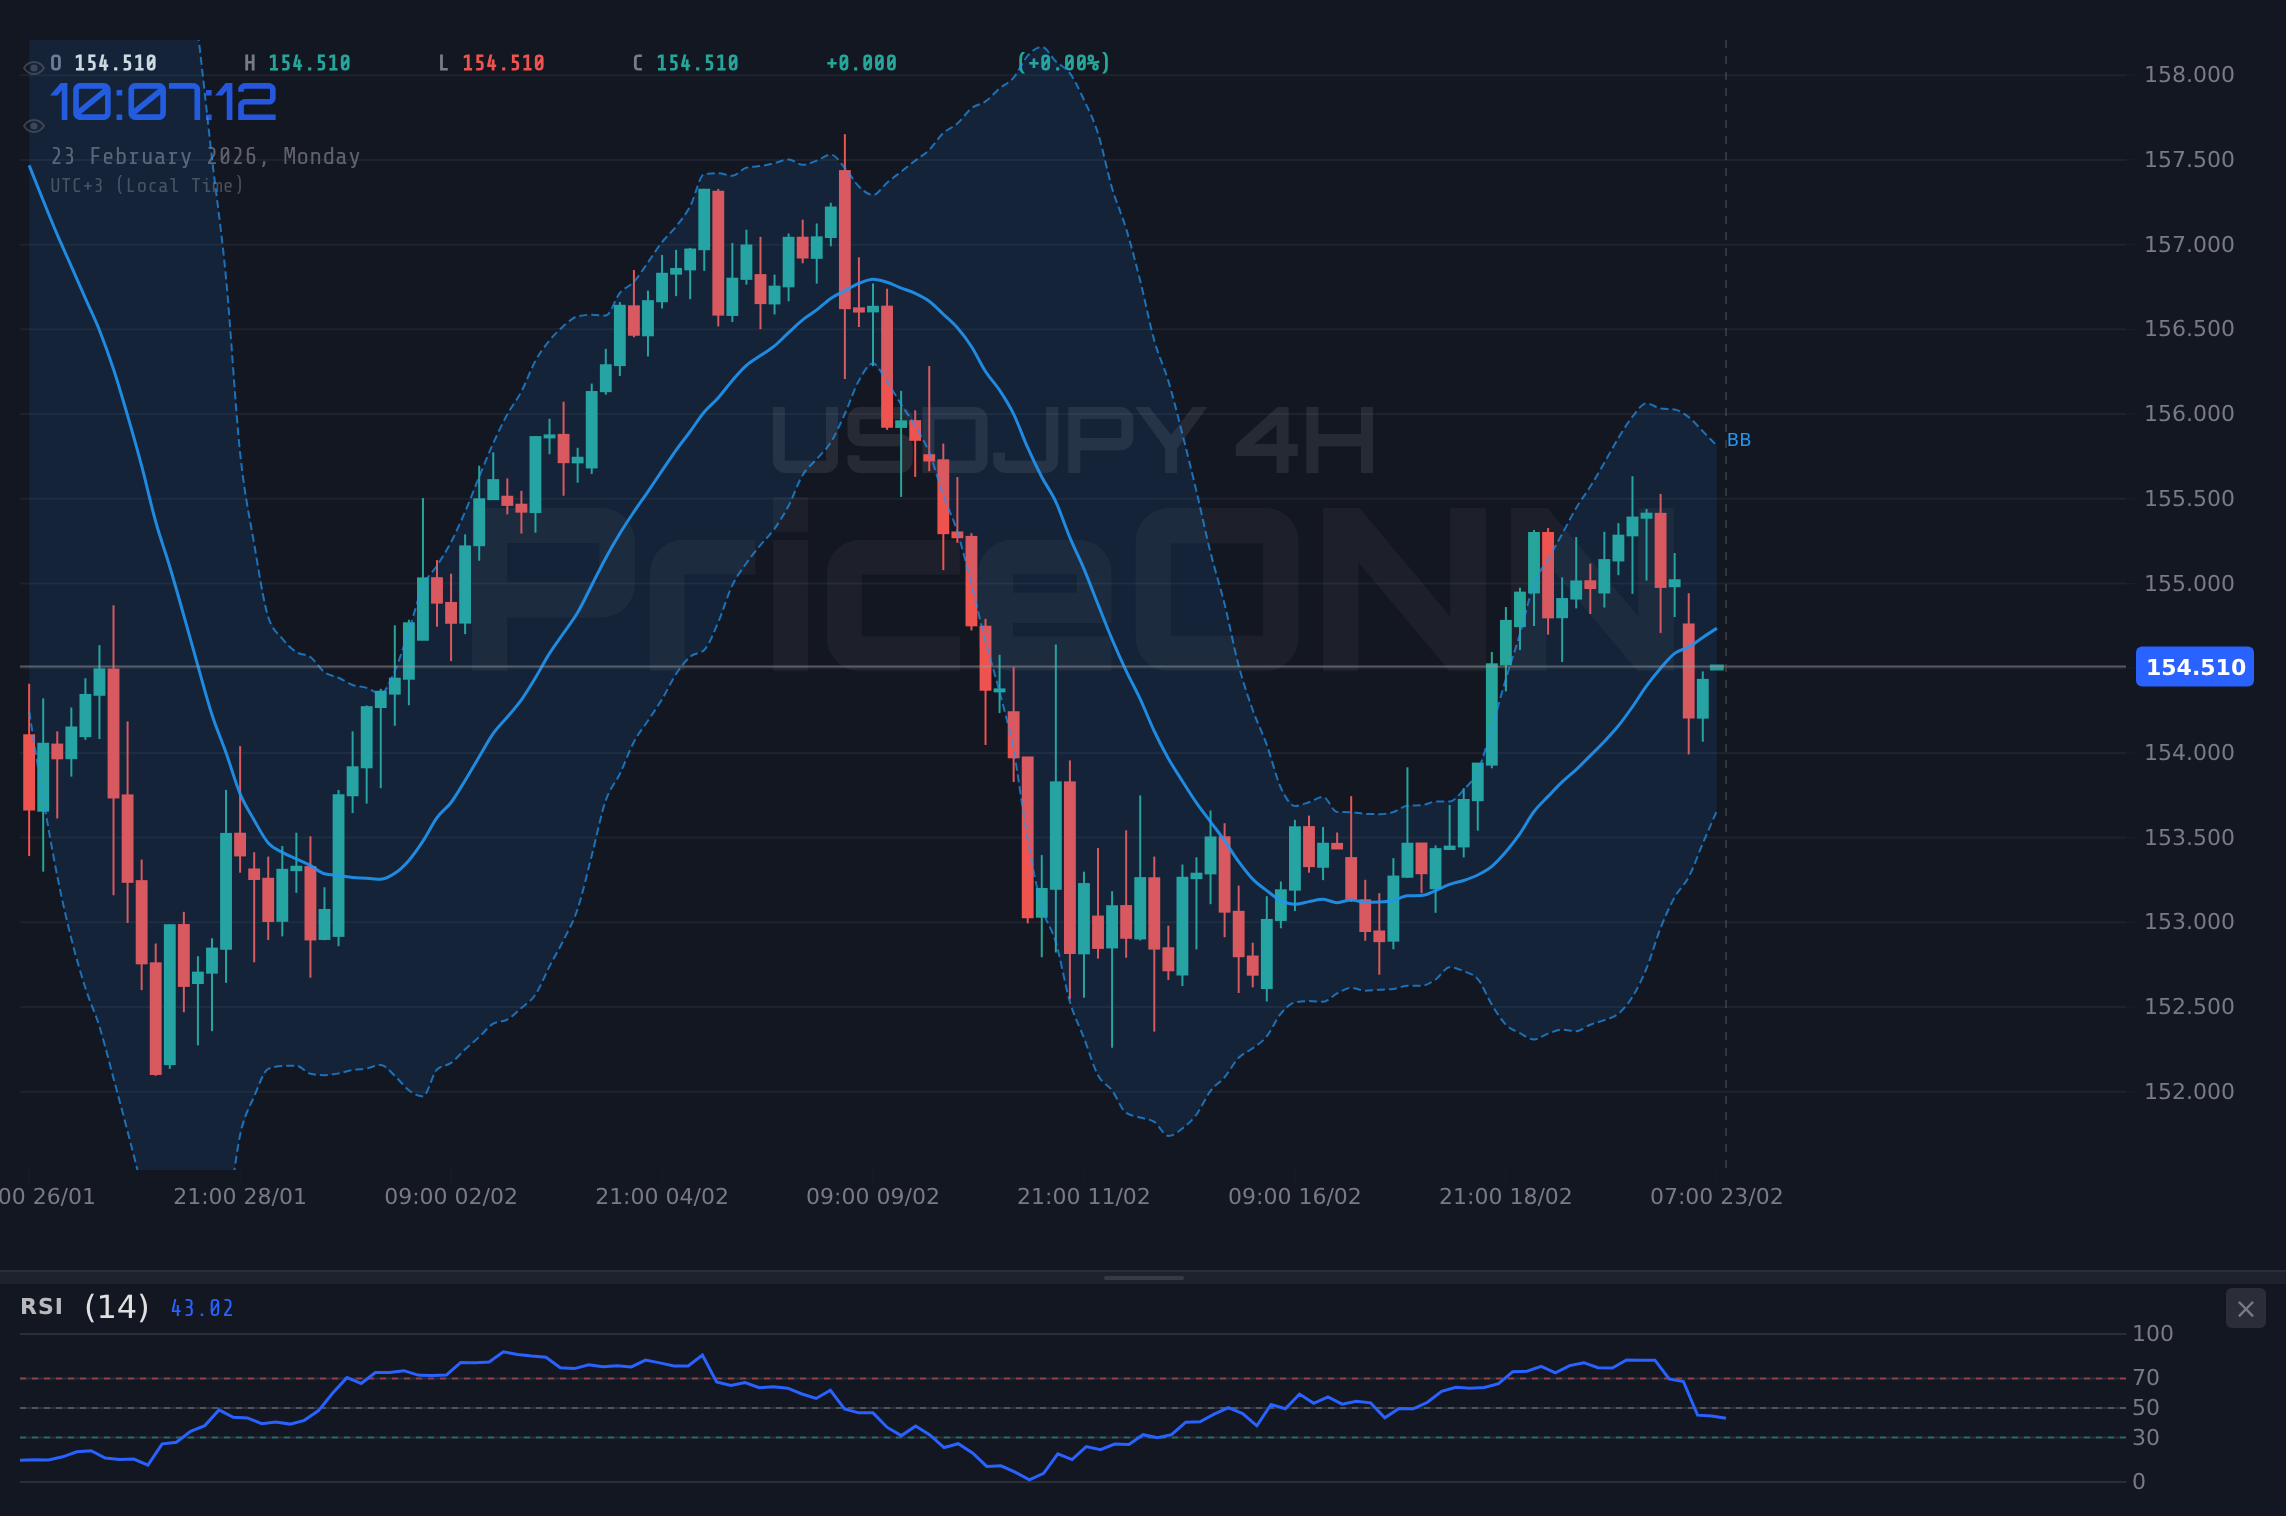
Looking at the 4-hour timeframe, the situation appears more favorable for bears. The trend here is also neutral, but the momentum indicators suggest a stronger potential for a decline. With the market testing the support level of $154.37, a break below this level would likely trigger further selling pressure. The resistance level at $154.83 remains a critical point to watch; if the price fails to break above this, it could reinforce bearish sentiment.
Historically, USDJPY has shown vulnerability when the RSI dips below 50, suggesting that momentum is shifting in favor of the yen. In prior instances, such as during the 2022 downturn, we observed similar patterns where sustained pressure resulted in significant reversals. Traders should remain cautious and consider the potential for similar outcomes in this current market context.
For scalpers, the current price levels present an opportunity to capture quick gains. Entries around the $154.50 mark with a tight stop just above $154.83 could allow for a short position, especially if the price action confirms weakness. Swing traders might look for a more prolonged setup, waiting for a decisive break below the $154.37 support level to establish a bearish position.
Long-term investors should consider the macroeconomic landscape, particularly the implications of DXY movements and interest rate expectations. The DXY is currently trading at 97.15, indicating a modest strength in the dollar. A rise in the DXY could place additional pressure on USDJPY, making it crucial for investors to monitor these developments closely.
As we look forward, the economic calendar shows several high-impact events that could influence USDJPY trading dynamics. Traders should keep an eye on inflation reports and interest rate announcements, as these will shape market sentiment and could lead to volatility in the currency pair.
In terms of correlations, the relationship between USDJPY and the DXY is paramount. As the DXY strengthens, USDJPY tends to weaken, and vice versa. Currently, with the DXY at 97.15, it’s essential to gauge how this influences USDJPY trading patterns. If the DXY continues to rise, we may see USDJPY struggle to maintain its current levels, further solidifying the bearish outlook.
USDJPY's current positioning at $154.50 is critical. Traders must remain vigilant, as the balance between support and resistance levels will dictate the next moves. If the price breaks below $154.37, we could see a significant shift in sentiment favoring the yen. On the other hand, a breakout above $154.83 could lead to renewed buying pressure for the dollar. Thus, managing risk and positioning strategically will be essential for maximizing potential returns.
Scenario A: Bearish Yen Reversal
75% ProbabilityScenario B: Bullish Reversal
30% ProbabilityFrequently Asked Questions: USDJPY Analysis
Is USDJPY a good buy right now?
Currently, USDJPY is at $154.50, showing bearish momentum. It's advisable to wait for a confirmation of support at $154.37 before considering a buy.
What is the USDJPY price forecast for this week?
For this week, USDJPY could target $153.80 if it breaks below the support at $154.37. The probability of reaching this target is about 75% based on current indicators.
What are the key support and resistance levels for USDJPY?
Key support for USDJPY is at $154.37, while resistance is found at $154.83. These levels are critical for determining the next price movement.
Why is USDJPY moving today?
Today's movement in USDJPY is influenced by the strengthening DXY and bearish market sentiment, as indicated by recent economic data trends.
📊 Technical Overview
| Indicator | Value | Signal |
|---|---|---|
| RSI (14) | 42.76 | Bearish |
| MACD | Negative | Bearish |
| ADX | 35.32 | Strong Trend |
Track markets in real-time
AI-powered analysis, technical indicators and real-time price data.
Join Our Telegram Channel
Breaking market news, AI analysis and trading signals instantly.
Join Channel