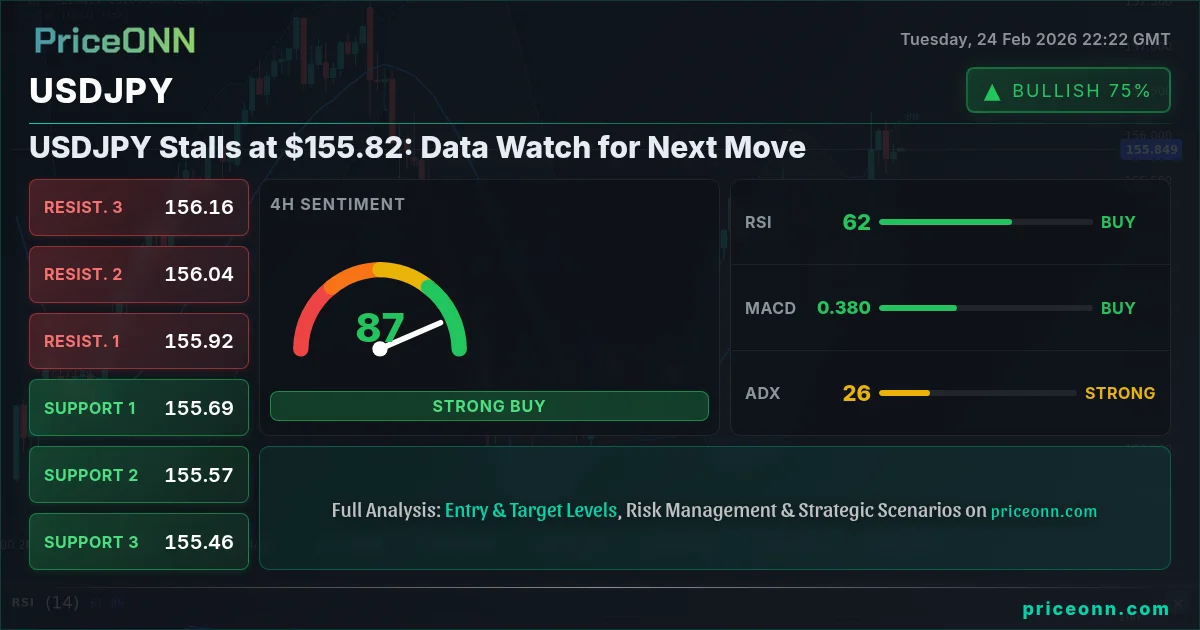
Is USDJPY poised for a breakout or a pullback? The pair is currently trading near $155.82, and the market's next move hinges on upcoming data releases. After a strong bullish run, the bulls may be catching their breath, but any significant correction could offer a buying opportunity for those waiting on the sidelines. The key now is to watch for confirmation signals aligning with the broader market context.
- RSI at 59.83 suggests room for further upside, but not an immediate signal.
- Key support lies at 155.779, a level that needs to hold to maintain bullish momentum.
- MACD is showing signs of weakening momentum, indicating a potential pullback.
- DXY strength is correlated with the USDJPY breakout attempt.
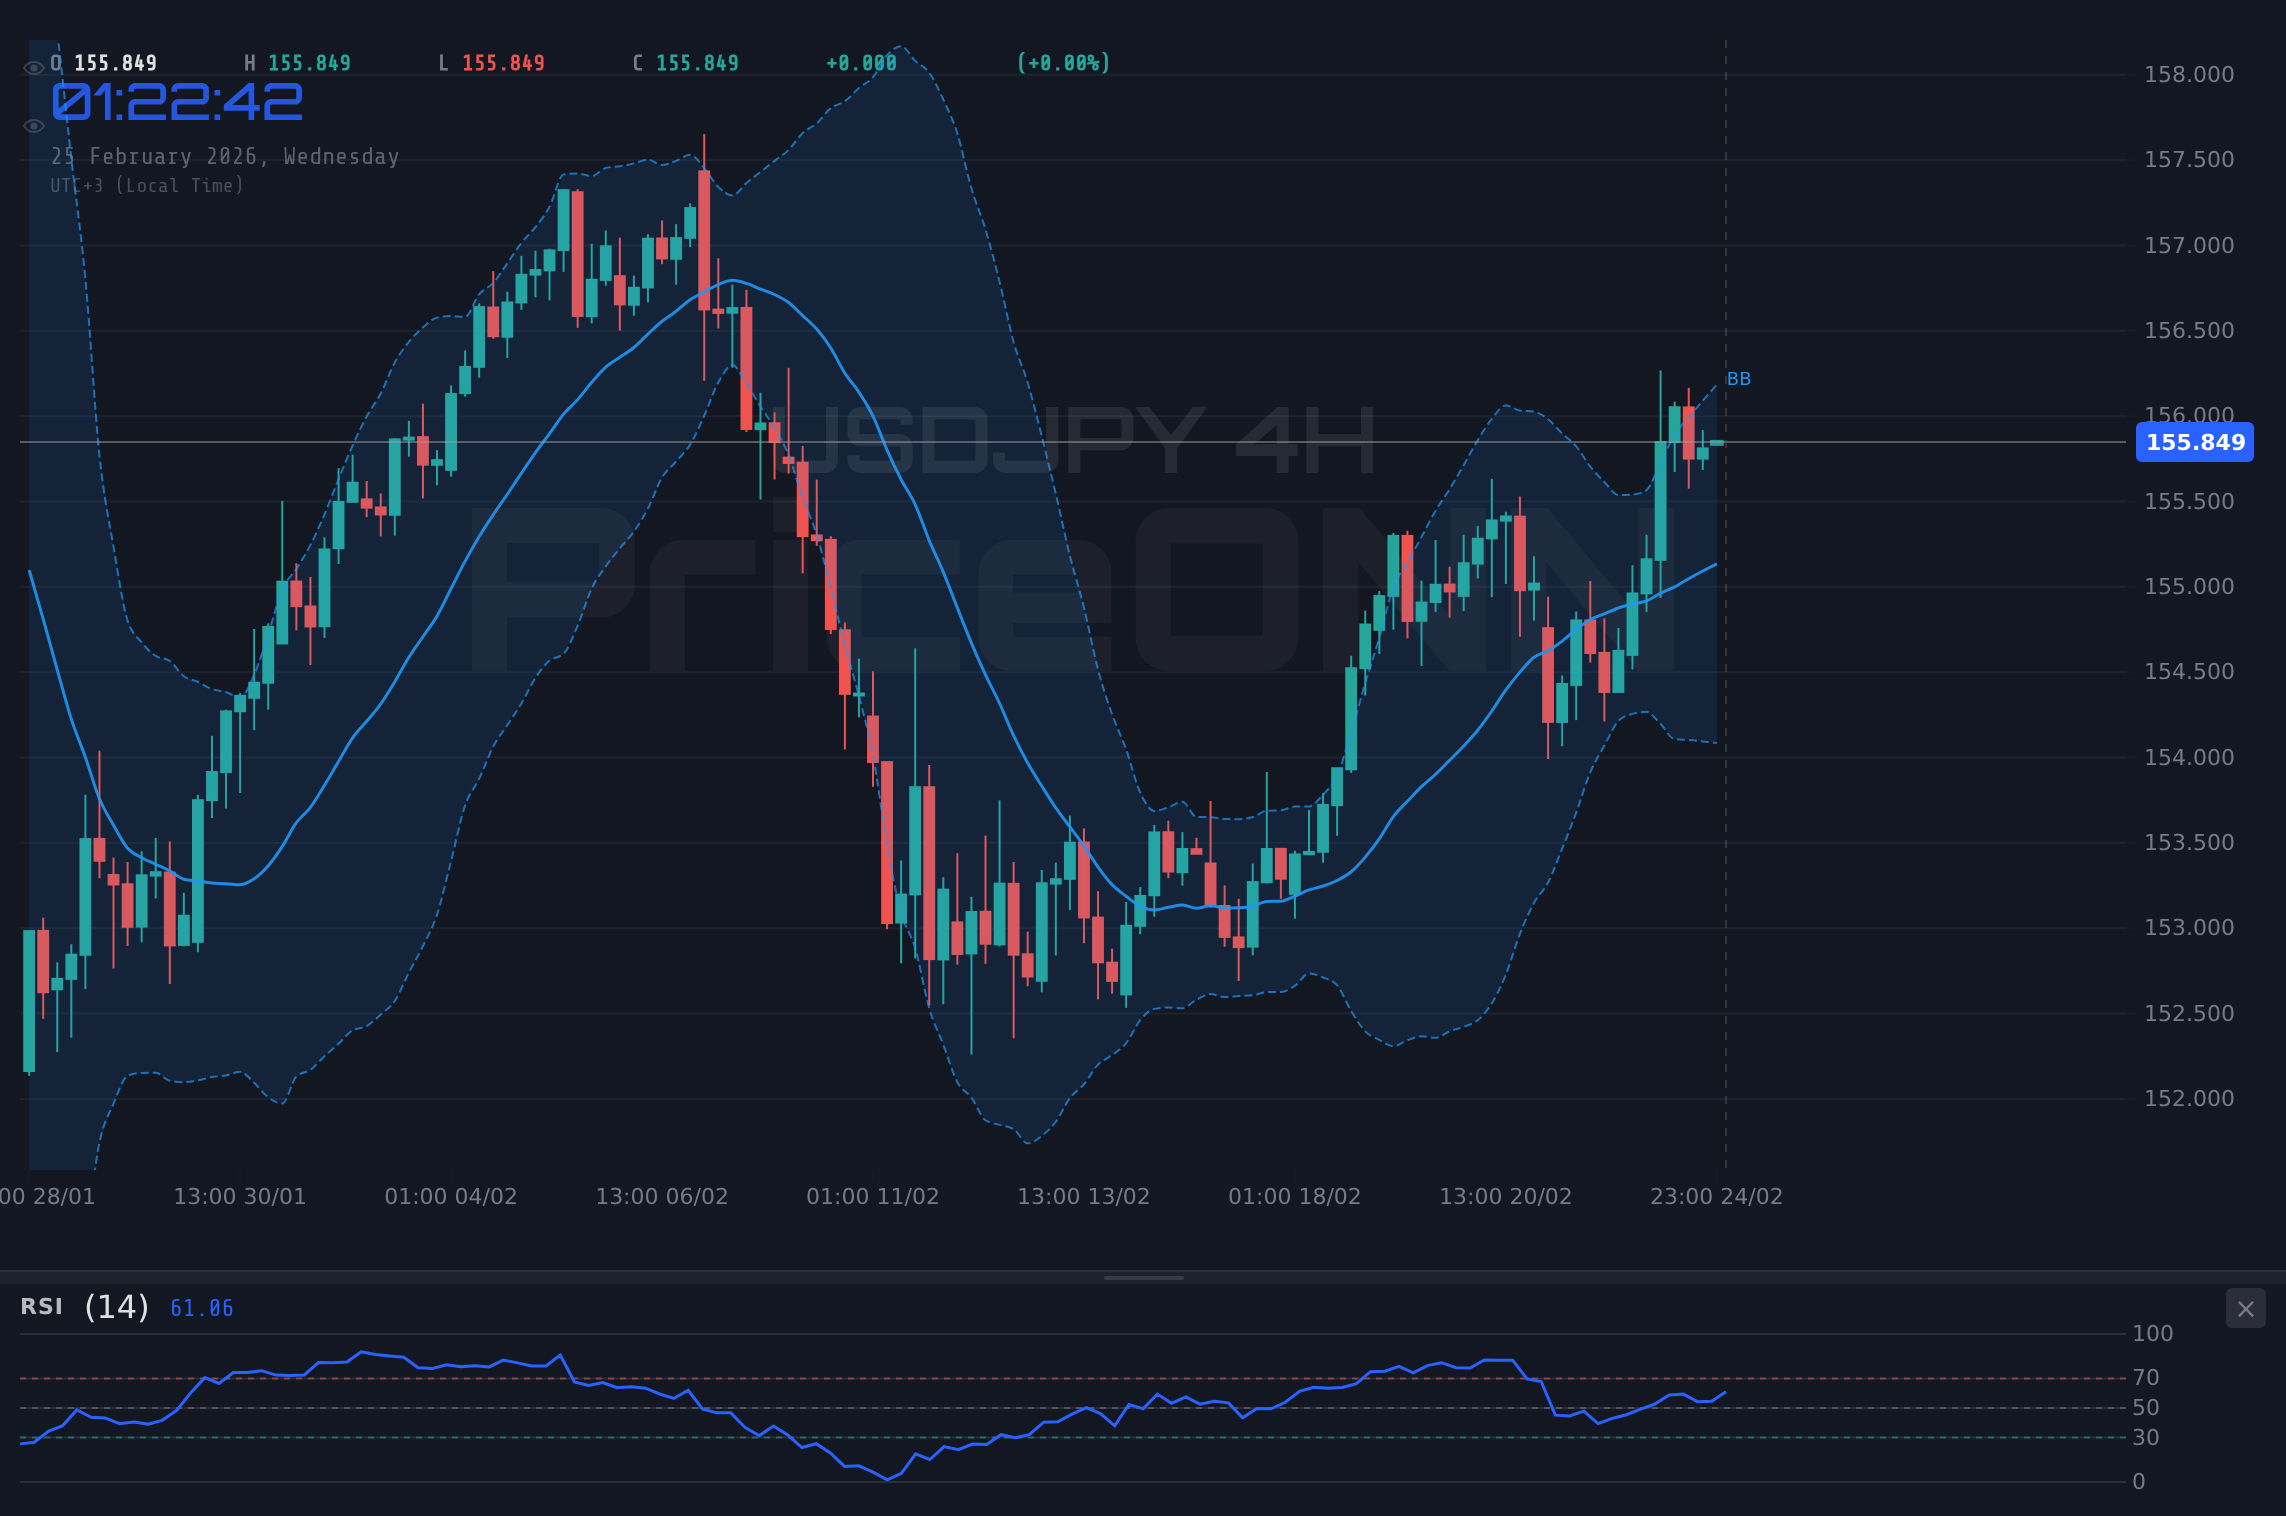
The $155.82 Crossroads: Breakout or Fakeout?
USDJPY's current position around $155.82 is a critical juncture. After a sustained rally, the pair is now facing a test of its upward momentum. Whether this level becomes a springboard for further gains or a ceiling that triggers a correction depends on a confluence of technical and fundamental factors. The coming days will be decisive in determining the next major move.
Bulls Eye $156: What Needs to Happen
For the bullish scenario to unfold, USDJPY needs to convincingly clear the immediate resistance around 155.923. A sustained break above this level would open the door towards the next target at 156.086. The 1H chart's RSI at 59.83 indicates that there is still room for further upside before the pair reaches overbought territory, but the MACD histogram suggests a potential weakening of momentum. A surge in volume would be crucial to confirm the breakout's validity.
The broader market context also plays a significant role. The DXY (Dollar Index) is currently trading at 97.59, showing a strong upward trend. As the dollar strengthens, it provides a tailwind for USDJPY. However, traders should also monitor the SP500 and Nasdaq. A significant drop in these indices could trigger risk-off sentiment, potentially leading to a flight to safety and a temporary pullback in USDJPY.
Historically, USDJPY has shown a strong correlation with Treasury yields. If yields continue to rise, it would further support the bullish case for the pair. However, any dovish signals from the Federal Reserve could quickly reverse this trend.
Bears Defend $156: Why a Pullback is Possible
The bearish scenario hinges on USDJPY failing to break above the 155.923 resistance. If the pair encounters strong selling pressure at this level, it could lead to a pullback towards the initial support around 155.779. A break below this support would then target the next level at 155.683. The 1H chart's Stochastic at K=41.12 and D=38.12, showing a potential downward crossover, would further support this bearish outlook.
Furthermore, the 4H chart's RSI at 63.04 indicates that the pair is approaching overbought territory. This could lead to profit-taking by early bulls, adding to the downward pressure. The ADX on the 1H timeframe is at 27.57, indicating a strong upward trend, but a weakening ADX would signal a potential trend reversal.
The upcoming high-impact USD data will be critical in determining the direction of USDJPY. Any weaker-than-expected data could trigger a sharp sell-off, while stronger-than-expected data would reinforce the bullish momentum. Traders should pay close attention to these releases and adjust their positions accordingly.
Data Watch: Key Economic Releases Ahead
The economic calendar is packed with high-impact events that could significantly influence USDJPY. Traders should closely monitor the upcoming data releases, as these events could trigger sharp price swings. The most important events to watch include the USD data, which is expected to show an increase from the previous 89. A higher-than-expected number could strengthen the dollar and further support USDJPY.
Also, the USD data is another important release. Any deviation from the forecast could trigger a significant reaction in the market. All this data will be released soon, and is expected to show an increase from 206. This would also be a bullish signal for the dollar.
USDJPY Trade Plan: Riding the Momentum
Given the current technical and fundamental outlook, a strategic trade plan for USDJPY can be formulated. While the overall trend leans bullish, caution is warranted due to potential data-driven volatility.
USDJPY breaks above 155.923 and sustains above 156.086, propelled by strong USD data and continued risk appetite. Targets: 156.422 and 156.677. This scenario has a 60% probability.
USDJPY fails to break above 155.923 and pulls back below 155.779, driven by weak USD data and risk-off sentiment. Targets: 155.683 and 155.635. This scenario has a 40% probability.
Key Levels
Support Levels
Resistance Levels
Technical Outlook Summary
| Indicator | Value | Signal |
|---|---|---|
| RSI (14) | 59.83 | Neutral |
| MACD Histogram | Negative | Bearish |
| Stochastic | 41.12/38.12 | Bullish |
| ADX | 27.57 | Strong Trend |
| Bollinger | Middle Band | Watch |
Frequently Asked Questions: USDJPY Analysis
Is USDJPY a good buy right now?
USDJPY is at $155.82. If it breaks above 155.923, it could be a good buy with targets at 156.086 and 156.422. Watch for confirmation from USD data.
What is the USDJPY price forecast for this week?
The USDJPY price forecast this week depends on the high-impact USD data, which is expected to show an increase from previous data. If data is strong, expect a move towards 156.422. We give this a 60% probability.
What are the key support and resistance levels for USDJPY?
Key support levels for USDJPY are at 155.779, 155.683 and 155.635. Resistance levels are at 155.923, 155.971 and 156.067. These levels are crucial for identifying potential breakout or reversal points.
Why is USDJPY moving today?
USDJPY is moving today due to a combination of factors: DXY strength, anticipation of high-impact USD data, and a technical test of the 155.923 resistance level. The market is awaiting confirmation from data releases.
Track markets in real-time
AI-powered analysis, technical indicators and real-time price data.
Join Our Telegram Channel
Breaking market news, AI analysis and trading signals instantly.
Join Channel