
USDJPY Tests $159.86 Resistance: Geopolitics Fueling Gains?
USDJPY hovers near $159.86 as geopolitical tensions and rising oil prices drive momentum. With the 1H chart showing a strong sell signal despite daily bullish divergence, the market is at a critical juncture.

USDJPY is currently trading at $159.86, a level that's drawing significant attention as geopolitical tensions escalate and oil prices surge. This critical juncture presents a complex picture for traders, with conflicting signals across different timeframes and indicators. The question on everyone's mind is whether the current upward momentum is sustainable or if this resistance level will hold, potentially leading to a sharp reversal. A strong dollar, fueled by safe-haven demand and the Bank of Japan's accommodative stance, continues to underpin the pair, but the escalating global risks add a layer of volatility that cannot be ignored.
- USDJPY is trading at $159.86, testing key resistance levels amid heightened geopolitical risks and rising oil prices.
- The 1-hour RSI at 60.38 signals overbought pressure, while the 4-hour ADX at 13.2 suggests a weak trend, indicating potential choppiness.
- The daily MACD shows positive momentum, but the ADX at 21.1 points to a strong downtrend, creating a conflicting technical picture.
- Geopolitical tensions, particularly concerning Iran and oil supply, are driving safe-haven flows into the dollar, supporting USDJPY's climb.
The Geopolitical Undercurrents Driving USDJPY
The global landscape is currently dominated by escalating geopolitical tensions, particularly in the Middle East. Reports of unusual trading activity in oil futures just before significant geopolitical announcements, as highlighted by recent news, suggest a market on edge. This heightened uncertainty is a classic catalyst for safe-haven assets, and in the forex world, the US Dollar often benefits. As the dollar strengthens against a basket of currencies, as indicated by the DXY index currently at 99.81, pairs like USDJPY tend to climb. The Bank of Japan's continued dovish monetary policy, characterized by ultra-low interest rates, further exacerbates this trend, widening the interest rate differential with the US and providing a fundamental tailwind for USDJPY's ascent.
The correlation between oil prices and USDJPY cannot be overstated. With WTI crude oil rallying past $115 and Brent crude nearing $114.43, inflation concerns are resurfacing globally. Higher energy prices can translate into broader inflationary pressures, which might prompt central banks elsewhere to adopt more hawkish stances. However, the Bank of Japan has shown little inclination to deviate from its ultra-accommodative path, even with a weakening Yen. This divergence in monetary policy is a key driver for USDJPY's upward trajectory. The news that USD/JPY is poised for further gains as geopolitical tensions keep oil above $100 is a direct reflection of this dynamic. Traders are watching closely to see if the yen's weakness accelerates past the critical 160.00 mark, a level that has historically seen intervention warnings from Japanese authorities.
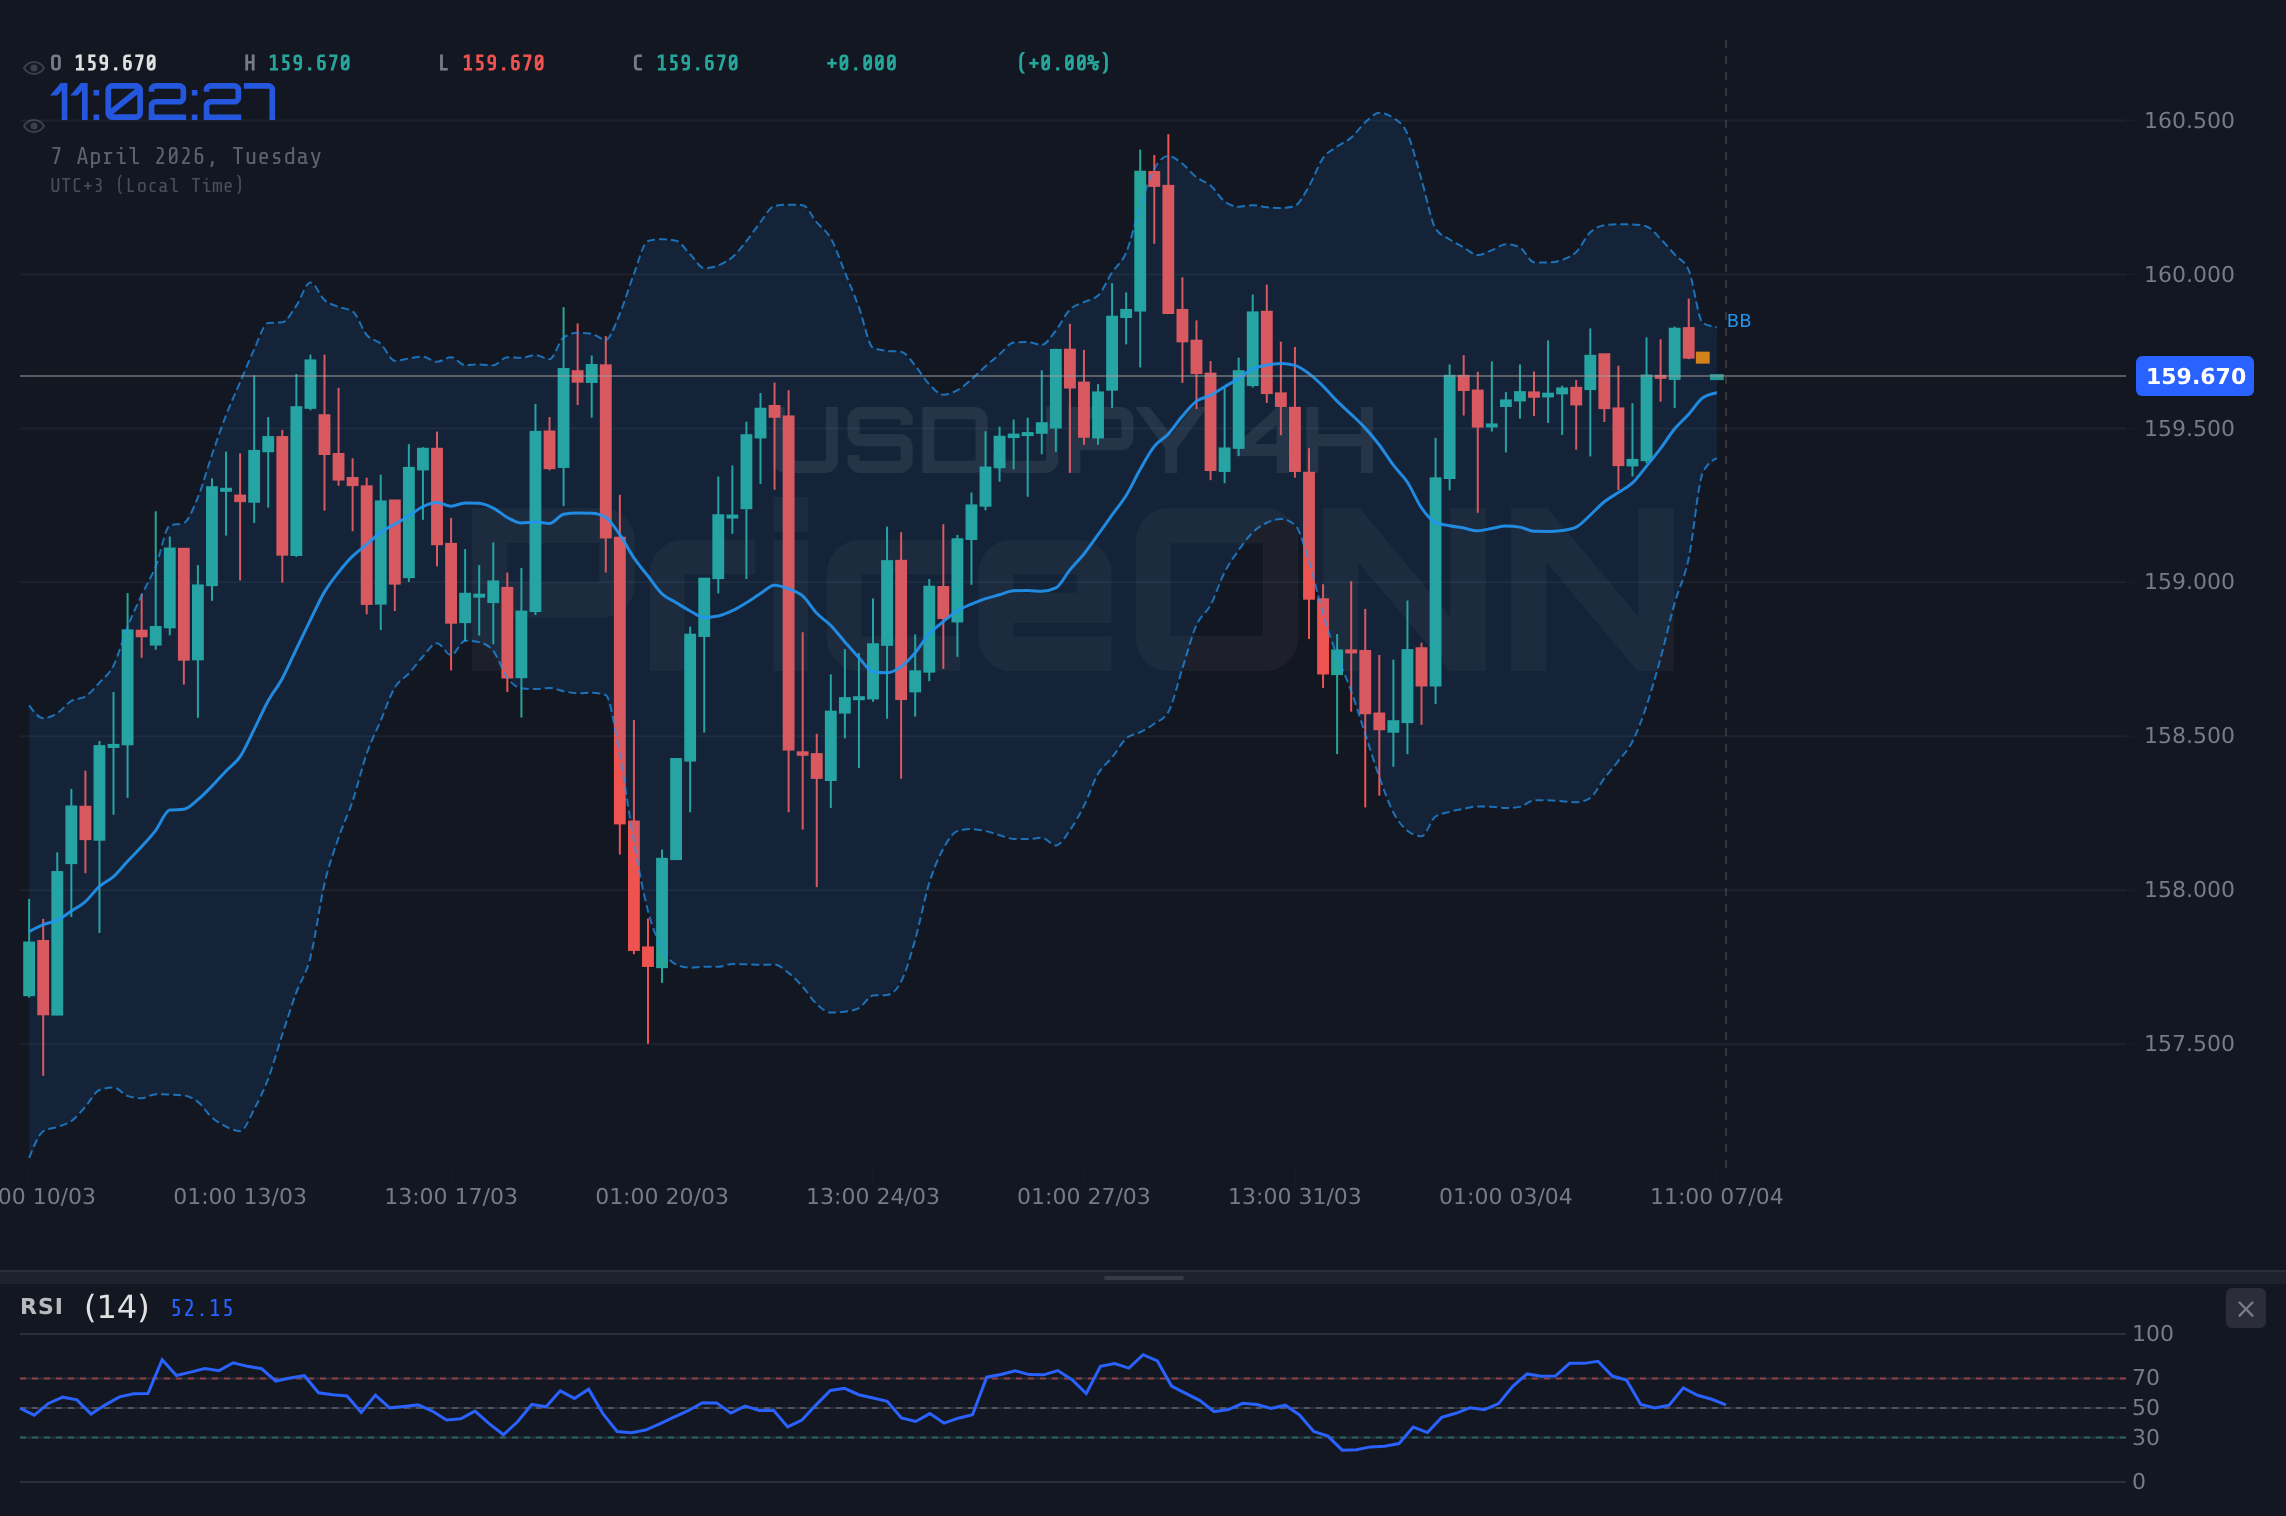
Navigating the Technical Maze: Conflicting Signals Abound
On the technical front, USDJPY presents a challenging, multi-faceted picture. The 1-hour chart shows a strong 'BUY' signal with 7 'Buy', 1 'Sell', and 0 'Neutral' indicators. The RSI(14) at 60.38 indicates a neutral-to-bullish leaning, and the Stochastic (%K=64.12, %D=69.45) suggests a potential dip, but the MACD is in positive territory, above its signal line. However, the ADX at 13.24 signals a very weak trend, suggesting that the current moves might lack conviction and could be prone to reversals. This is a classic sign of a market consolidating or experiencing a 'stop hunt' before a more decisive move.
Diving deeper, the 4-hour timeframe paints a slightly different, yet equally complex, scenario. Here, the overall signal shifts to 'BUY' with 8 'Buy', 0 'Sell', and 0 'Neutral' indicators. The RSI(14) is at 61.32, still in the neutral zone but trending upwards. The MACD remains positive, and Stochastic (%K=86.4, %D=54.09) is firmly in overbought territory, flashing a strong 'Buy' signal, though this can persist in strong uptrends. The ADX here is also low at 13.2, reinforcing the idea of a weak trend. This suggests that while the short-term momentum might lean bullish, the underlying trend strength is questionable, making any significant breakout potentially fragile.
The daily chart, however, offers a more cautionary perspective, despite a 'BUY' signal (6 'Buy', 1 'Sell', 0 'Neutral'). The RSI(14) is at 58.96, still in neutral territory but showing signs of slowing momentum. The MACD is positive, but the ADX at 21.1 indicates a moderately strong trend, which, when viewed against the backdrop of weaker short-term trend indicators, suggests a potential divergence. The Stochastic (%K=65.55, %D=58.24) is showing a rising signal, but the overall confluence of indicators across timeframes reveals a market that is not yet clearly trending in one direction, despite the bullish sentiment on the shorter timeframes.
The Bull's Roadmap: Paving the Way Above $160
For USDJPY to continue its ascent, several technical and fundamental conditions need to align. The immediate hurdle is the resistance around the current price of $159.86. A decisive break and sustained hold above this level, ideally supported by increasing trading volume and positive momentum across all timeframes, would be the first step. The 4-hour chart's overbought Stochastic reading needs to resolve without a sharp pullback, and the weak ADX across all timeframes must begin to climb, indicating genuine trend strength.
A bullish scenario would likely see USDJPY push towards the psychological 160.00 level, a point of significant market interest and potential intervention warnings. If this level is breached convincingly, the next targets would be the higher resistance levels indicated on the daily chart, potentially reaching $160.123 and even $160.42. This would require continued geopolitical instability, persistently high oil prices, and a firm 'risk-off' sentiment that keeps the dollar bid. Furthermore, any indication from the Bank of Japan that they are becoming increasingly concerned about yen weakness, short of direct intervention, could paradoxically fuel further speculative buying if traders believe it signals a shift in policy down the line. The news that USD/JPY is poised for further gains as geopolitical tensions keep oil above $100 directly supports this outlook, suggesting that the market is already pricing in a continued rise.
Where Bears Could Take Control: The $159.86 Sticking Point
Conversely, the bearish case hinges on the inability of USDJPY to decisively break above the current $159.86 resistance. If price action stalls around this level, especially with increasing selling pressure indicated by rising RSI on shorter timeframes or a MACD crossover on the 1-hour chart, bears could regain control. The weak ADX readings across the board suggest that a failure to break higher could lead to a sharp reversal, as momentum traders might unwind their positions quickly in a choppy market.
A bearish scenario would likely involve a close below the 1-hour support at $159.734, followed by a break of the $159.65 support. If USDJPY falls below the $159.37 support on the daily chart, it would signal a more significant pullback. The key invalidation for the bullish thesis would be a sustained move below the $159.07 support level. This could be triggered by de-escalation in geopolitical tensions, a sudden drop in oil prices, or even unexpected hawkish signals from the Federal Reserve that strengthen the dollar across the board, but paradoxically lead to profit-taking in USDJPY. The Japanese Yen's historical tendency to act as a safe-haven currency during times of extreme global stress could also come into play if the geopolitical situation deteriorates rapidly, leading to a flight to safety into JPY itself, despite the carry trade dynamics.
The Waiting Game: Consolidation Around $159.86
Given the conflicting signals and the current high level of uncertainty, a period of consolidation around the $159.86 mark is also a distinct possibility. The weak ADX readings (13.24 on 1H, 13.2 on 4H) strongly support the idea of a range-bound market in the short term. In this scenario, USDJPY might trade within a defined range, potentially between the immediate support at $159.734 and resistance at $159.814 on the 1-hour chart, or a wider range defined by the daily support at $159.37 and resistance at $159.895. This 'waiting game' is common when major catalysts are anticipated but haven't yet materialized, such as upcoming economic data or significant geopolitical developments.
During consolidation, technical indicators might provide mixed signals. For instance, the Stochastic oscillator could oscillate between overbought and oversold conditions without leading to sustained moves. The RSI might hover around the 50 level, reflecting indecision. This phase often precedes a more significant move, as underlying pressures build up. Traders during such periods typically look for confirmation from volume spikes or clear breaks of established consolidation patterns, such as triangles or flags, before committing to a directional trade. The keyword intelligence suggesting interest in 'is aud projected to get stronger than yen over the next week' hints at potential cross-currency plays that could influence USDJPY's range if AUDJPY dynamics shift.
What's Most Likely? A Probabilistic Outlook
Weighing the fundamental drivers against the mixed technical signals, the immediate outlook for USDJPY appears cautiously optimistic in the short term, but with significant risk of a pullback. The geopolitical backdrop and rising oil prices provide a strong tailwind for the dollar, pushing USDJPY higher. The Bank of Japan's policy divergence is a persistent factor that favors further yen weakness. However, the technical picture, particularly the weak trend strength indicated by the ADX on shorter timeframes and the overbought conditions on the 4-hour Stochastic, suggests that the current upward momentum may struggle to maintain its force without further catalysts.
Therefore, I assign a 60% probability to a scenario where USDJPY consolidates or experiences a mild pullback towards the $159.37 support level in the very short term (intraday to 24 hours), before potentially resuming its upward trend later in the week if geopolitical risks persist and the dollar remains strong. A sustained break above $159.86 is unlikely to happen without a clear catalyst, and the risk of a 'fakeout' above this level, followed by a sharp reversal, is significant. The 30% probability is assigned to a continued bullish trend scenario, where USDJPY breaks decisively above $159.86 and targets the $160.123 resistance. The remaining 10% probability lies with a sharp bearish reversal, triggered by de-escalation of tensions or unexpected Fed hawkishness, pushing USDJPY back towards $159.07.
The Bear's Grip: Pullback Scenario
30% ProbabilityThe Bull's Charge: Breakout Scenario
10% ProbabilityThe Choppy Waters: Consolidation Scenario
60% ProbabilityWhat I'm Watching This Week
My primary focus this week will be on the $159.86 to $160.123 price zone. A failure to decisively break above this resistance, coupled with persistent weak trend signals on the 1-hour and 4-hour charts, would increase the probability of the consolidation scenario playing out. I'll be looking for confirmation from volume and the ADX indicator: a sustained increase in ADX above 20 would suggest a genuine trend is forming, while continued readings below 15 would reinforce the range-bound outlook. Secondly, I'm watching the DXY index and oil prices. Any significant geopolitical de-escalation or a sharp drop in oil prices could trigger a USDJPY pullback, while continued escalation would likely support further gains, albeit potentially choppy ones.
Finally, the market's reaction to any whispers from the Bank of Japan or hints from the Federal Reserve regarding future policy will be crucial. While the BOJ remains dovish, any subtle shift in language regarding yen weakness could be a major catalyst. For traders considering positions, patience is key. A valid setup will likely emerge once these conflicting signals resolve, or a clear breakout above or breakdown below key levels occurs. The keyword intelligence suggesting interest in 'is aud projected to get stronger than yen over the next week' also warrants attention; if AUDJPY starts showing strength, it could provide a broader risk-on sentiment that might indirectly influence USDJPY.
Frequently Asked Questions: USDJPY Analysis
What happens if USDJPY breaks above the $159.86 resistance level?
If USDJPY decisively breaks and holds above $159.86, the bullish scenario becomes more probable. This could trigger a move towards the daily resistance levels at $160.123 and potentially $160.42, especially if geopolitical tensions escalate further and the dollar remains strong.
Should I buy USDJPY at current levels near $159.86 given the mixed signals?
Entering at current levels carries significant risk due to conflicting technical signals and weak trend strength (ADX below 15). A probability of 60% suggests consolidation or a mild pullback is more likely in the short term. Waiting for a clear breakout above $159.86 or a confirmed pullback to support near $159.37 would offer a more defined risk/reward setup.
Is the RSI at 60.38 a sell signal for USDJPY right now?
An RSI of 60.38 on the 1-hour chart is in the upper-neutral territory, not strictly overbought. While it signals upward momentum, it doesn't necessarily indicate an immediate sell. In a strong uptrend, RSI can remain elevated; however, coupled with weak ADX, it suggests caution is warranted before chasing further upside at current resistance.
How will geopolitical tensions and rising oil prices affect USDJPY this week?
Escalating geopolitical tensions and sustained high oil prices typically boost the US Dollar due to its safe-haven status, which directly supports USDJPY. This fundamental backdrop increases the likelihood of USDJPY testing higher levels, provided the Bank of Japan maintains its accommodative policy.
Technical Outlook Summary
| Indicator | Value | Signal | Interpretation |
|---|---|---|---|
| RSI (14) | 60.38 | Neutral | Moving towards overbought, watch for divergence. |
| MACD Histogram | +0.195 | Bullish | Positive momentum, but watch for crossover. |
| Stochastic | K:64.12 D:69.45 | Bearish Dip | %K |
| ADX | 13.24 | Weak Trend | Lack of trend strength indicates choppy conditions. |
| Bollinger Bands | Middle Band | Above | Suggests upward bias, but needs trend confirmation. |
Track markets in real-time
AI-powered analysis, technical indicators and real-time price data.
Join Our Telegram Channel
Breaking market news, AI analysis and trading signals instantly.
Join Channel