
USDJPY Tests Resistance Near $159.70: What's Next for the Yen?
USDJPY hovers around $159.70 as traders eye key resistance. With strong bullish signals on shorter timeframes but a cautious daily outlook, the pair faces a critical juncture. Geopolitical tensions and upcoming economic data will be key.
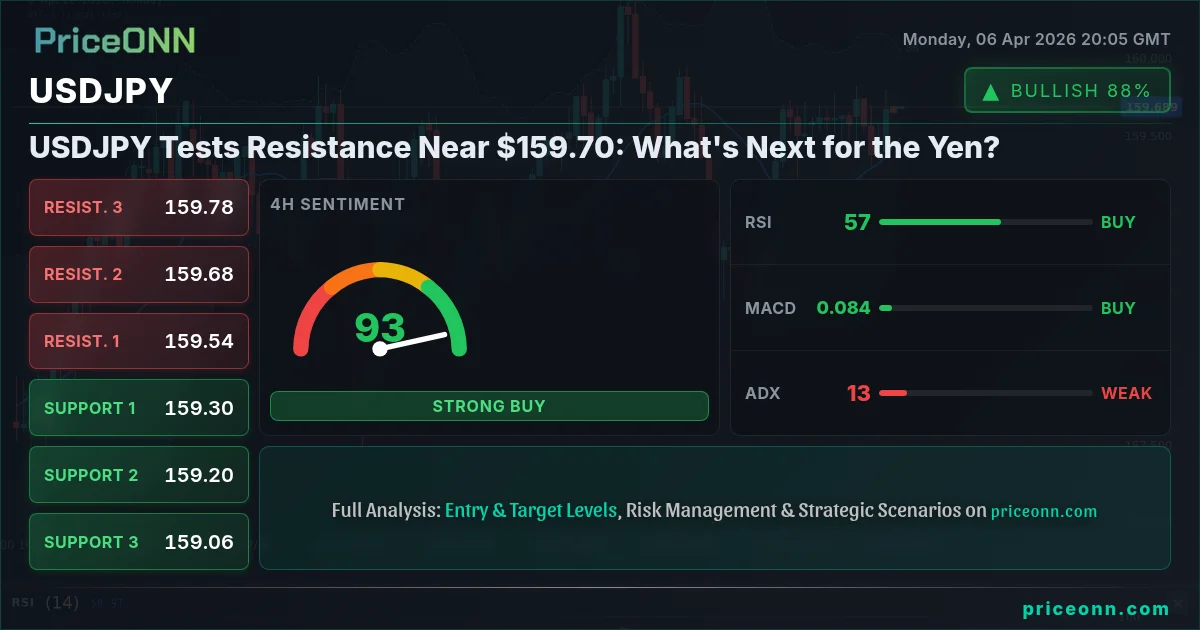
USDJPY is currently dancing around the $159.70 mark, a level that's proving to be a significant hurdle. For weeks, this pair has been on a relentless upward march, fueled by a potent mix of Japanese Yen weakness and a strengthening US Dollar. But as we approach this critical resistance zone, the question on every trader's mind is: can USDJPY push higher, or are we due for a correction? The technical indicators are flashing mixed signals, and the broader market sentiment, influenced by geopolitical events and upcoming economic data, adds another layer of complexity to this already charged environment.
- USDJPY hovers around $159.70, testing key resistance levels.
- On the 1H chart, ADX at 26.75 signals a strong uptrend, but Stochastic K=24.4 indicates potential short-term pullback.
- The 1D chart shows RSI at 44.05, suggesting a neutral to bearish bias, while ADX at 29.87 points to a strong downtrend.
- Geopolitical tensions and upcoming US economic data releases are key catalysts to watch for USDJPY direction.
Navigating the Resistance: USDJPY's Tightrope Walk
The Yen's Struggle Against a Resilient Dollar
The Japanese Yen has been under immense pressure for a considerable period. This weakness isn't a sudden development but rather a culmination of divergent monetary policies between the Bank of Japan (BoJ) and other major central banks. While the Federal Reserve and the European Central Bank have been navigating paths toward monetary tightening, or at least maintaining higher interest rates, the BoJ has largely maintained its ultra-loose stance. This interest rate differential is a primary driver of USDJPY's ascent, making the carry trade attractive and weakening the Yen as capital flows towards higher-yielding assets.
The current price action around $159.70 highlights the market's struggle to decisively break higher. On the 1-hour chart, the ADX reading of 26.75 suggests a strong uptrend is in play, which aligns with the persistent weakness in the Yen. However, the Stochastic indicator flashing K=24.4 and D=39.2 points to a potential short-term pullback, with %K below %D indicating a bearish signal on this very short timeframe. This divergence between trend strength and momentum oscillators is a classic sign of a market at a crossroads, where the next move could be significant.
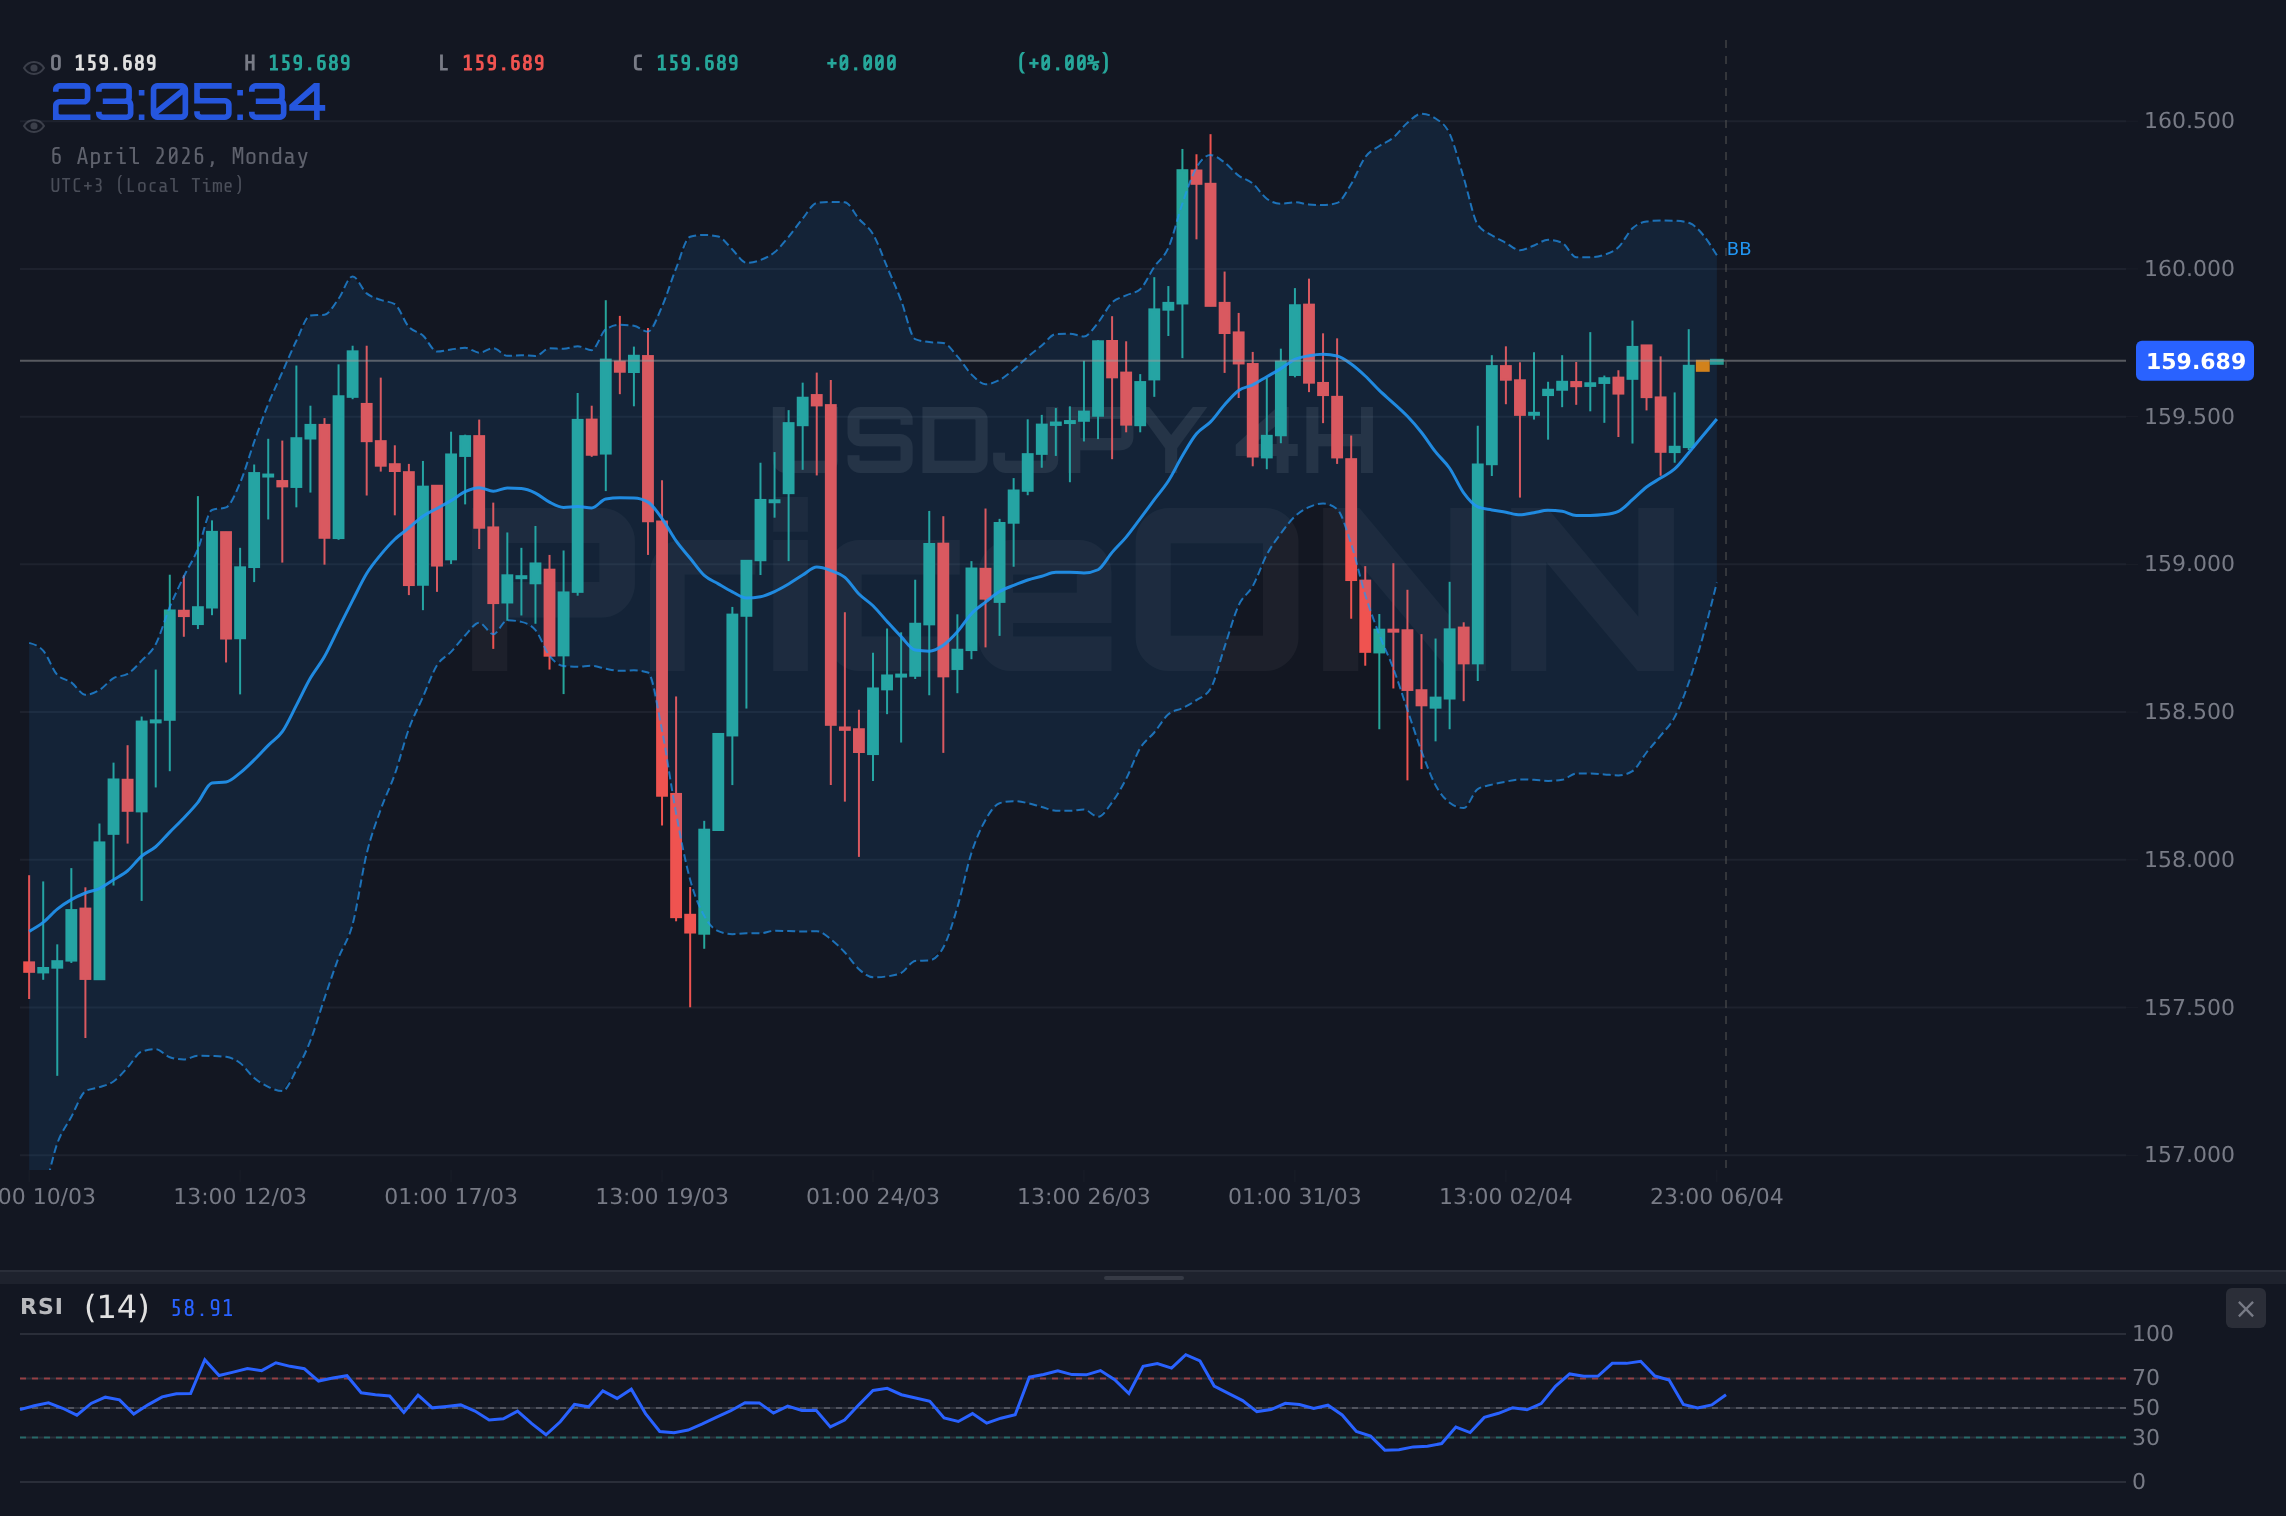
The 1D Chart's Cautionary Tale
Zooming out to the daily chart, the picture becomes even more nuanced, and arguably, more cautious. The RSI(14) stands at 44.05, firmly in neutral territory but leaning towards the bearish side, suggesting that the upward momentum seen on shorter timeframes might not have sustainable backing. Furthermore, the ADX at 29.87 on the daily chart indicates a strong downtrend, which, paradoxically, seems to contradict the recent price action. This can often be seen in strongly trending pairs that experience sharp, short-term reversals or consolidations before resuming their primary trend, or reversing it.
The Bollinger Bands on the daily timeframe are also worth noting. They are positioned below the middle band, reinforcing the idea of a prevailing downward pressure, or at least a lack of strong bullish conviction. The Stochastic K=42.62 and D=44.52, while showing %K below %D, also suggests that the pair is not yet in oversold territory, leaving room for further downside if selling pressure intensifies. This daily perspective paints a different story than the hourly charts, highlighting the importance of multi-timeframe analysis. It suggests that while short-term traders might find opportunities on the buy side, the longer-term trend could still be susceptible to reversal.
For USDJPY, the immediate resistance is clearly defined around the $159.70-$159.80 zone. A decisive break and sustained hold above this area would be a significant bullish development, potentially targeting the $160.13 resistance level. Conversely, failure to break higher and a subsequent drop below the $159.40 support could signal a retracement towards $159.23 or even $159.04.
Geopolitical Currents and Economic Undercurrents
The Shadow of Global Tensions
In today's interconnected financial markets, geopolitical events can act as powerful catalysts, often overriding purely technical considerations. Recent news highlights escalating tensions in the Middle East, particularly concerning the Strait of Hormuz. While this has directly impacted oil prices, it also contributes to a broader sense of global uncertainty. Such an environment often leads to a flight to safety, which typically benefits currencies like the US Dollar and, to some extent, the Japanese Yen, despite its underlying weakness. However, the current narrative for USDJPY is heavily dominated by interest rate differentials, meaning that geopolitical risk might only serve to temporarily stall the Yen's decline rather than fundamentally reverse it, unless the situation escalates dramatically.
The recent news about Bitcoin's resilience amid geopolitical shocks, while not directly related to USDJPY, speaks to a broader market theme: the search for stability and yield. Investors are navigating a complex landscape where traditional safe havens are being tested, and alternative assets are showing surprising strength. For USDJPY, this means that while the carry trade remains attractive due to the BoJ's policy, any significant escalation in global risk could lead to unexpected flows, potentially creating volatility.
The Economic Calendar: Awaiting the Next Big Move
Looking ahead, the economic calendar is packed with high-impact events that could significantly influence the USDJPY's trajectory. The US economy, in particular, is under intense scrutiny. Upcoming data releases, such as inflation figures (CPI, PCE) and employment numbers (NFP, unemployment rate), will be crucial in shaping the Federal Reserve's monetary policy outlook. Any signs of sticky inflation or a cooling labor market could lead markets to price in earlier or more aggressive Fed rate cuts, which would typically weaken the US Dollar and could offer some respite to the Yen.
Conversely, stronger-than-expected US economic data would likely reinforce the Fed's hawkish stance, or at least delay rate cut expectations, further supporting the Dollar against the Yen. The market is highly sensitive to these releases, and even small deviations from forecasts can trigger significant price movements. Traders will be closely watching the actual vs. forecast numbers, as well as any subtle shifts in commentary from Fed officials, to gauge the future path of interest rates. The BoJ's policy, while currently accommodative, also remains a key factor. Any hint of a policy shift, however slight, could dramatically alter the USDJPY dynamic.
The divergence between the short-term bullish signals on the 1H chart and the more cautious daily outlook highlights a key trading principle: confirmation is key. While a breakout above $159.70 on shorter timeframes might tempt some traders, waiting for confirmation on the daily close, or at least seeing a clear break of daily resistance with increasing volume, would offer a higher probability trade setup. The current ADX readings are particularly interesting; a strong ADX on the 1H suggests momentum, but a strong ADX on the 1D might indicate the trend is already established and potentially nearing exhaustion.
Correlation Analysis: DXY, Equities, and the Yen's Fate
The Dollar Index (DXY) as a Barometer
The DXY, representing the US Dollar's strength against a basket of major currencies, remains a critical correlation to monitor for USDJPY. Currently, the DXY is trading around 99.77, showing a modest daily increase. Historically, a rising DXY tends to put pressure on USDJPY, as the dollar's strength is a direct component of the index. The fact that USDJPY is testing resistance near $159.70 while the DXY shows a bullish bias around 99.77 suggests that the Yen's weakness might be more pronounced than the Dollar's broad strength. This can happen when specific bilateral factors, like the BoJ's ultra-loose policy, are the dominant drivers.
However, if the DXY were to break decisively above its own resistance levels, particularly breaching the 100.04 mark on the daily chart, it would lend significant weight to the bullish case for USDJPY. A strong dollar, driven by factors like higher-than-expected US inflation or hawkish Fed commentary, would likely propel USDJPY higher. Conversely, a sharp fall in the DXY, perhaps triggered by dovish Fed surprises or geopolitical de-escalation, could lead to a pullback in USDJPY, even if the Yen's fundamental weakness persists.
Risk Appetite and USDJPY
The performance of major equity indices like the S&P 500 and Nasdaq is another vital piece of the puzzle. Currently, both indices are showing strong upward momentum, with the S&P 500 up 0.74% and the Nasdaq 100 up 1.01%. This indicates a healthy risk appetite in the market. Generally, a 'risk-on' environment can be supportive of USDJPY, as investors are more willing to invest in higher-yielding assets and currencies associated with carry trades. The Yen, often considered a safe-haven currency, tends to weaken during periods of strong risk appetite.
However, the narrative can become complicated. If equity markets were to experience a sharp downturn, driven by geopolitical fears or economic slowdown concerns, we would typically expect a flight to safety. This would likely see the Yen strengthen and USDJPY fall. The current divergence, where equities are rising while USDJPY is struggling at resistance, suggests that the Yen's weakness is currently driven more by monetary policy differentials than by broad market sentiment. But this correlation is not static and can shift rapidly, especially in volatile geopolitical climates.
For those looking to trade USDJPY, the current consolidation near $159.70 presents a classic 'wait and watch' scenario. The high probability setup would involve waiting for a clear breakout above the $159.80 resistance on the daily chart, confirmed by increased volume and positive RSI divergence, before considering a long position. Alternatively, a decisive break below the $159.40 support level on the daily chart could open up opportunities for short positions, targeting the $159.23 and $159.04 levels.
Navigating Volatility: What Traders Should Watch
The Importance of Confirmation
The conflicting signals from different timeframes and indicators underscore the need for patience and confirmation. A breakout above $159.70 on the 1-hour chart might attract short-term scalpers, but for swing and position traders, waiting for a daily close above this level is crucial. The daily chart's ADX at 29.87, while indicating a strong trend, could also signal that the trend is maturing and susceptible to a reversal. If USDJPY fails to break $159.70 and instead pulls back, the subsequent retest of support levels will be critical.
The technical picture suggests that while bullish momentum is present on shorter timeframes, the daily outlook presents headwinds. The RSI at 44.05 on the daily chart is a key point of concern for bulls. A move back above 50 would be the first sign of a potential trend shift, but until then, the risk of a pullback remains elevated. The Stochastic indicator on the daily chart, while currently showing %K > %D, is close to overbought territory, meaning any further upside could be limited and potentially lead to a sharp reversal.
The Role of Economic Data and Central Banks
Ultimately, the direction of USDJPY will likely be dictated by the interplay between US economic data and the BoJ's policy. Traders should be particularly focused on upcoming US inflation and employment reports. If these figures suggest a stronger economy and persistent inflation, the Fed might delay rate cuts, strengthening the dollar and pushing USDJPY higher. If the data disappoints, hinting at a potential Fed pivot towards easing, the dollar could weaken, offering some relief to the Yen.
The Bank of Japan's stance also remains a critical variable. While they have signaled a willingness to normalize policy, the pace and timing are uncertain. Any shift in their forward guidance, or actual policy adjustments, could have a dramatic impact on USDJPY. The market is currently pricing in a significant interest rate differential, and any change to that expectation could lead to rapid price adjustments. For now, the path of least resistance appears to be dictated by the Fed's stance, but the BoJ is always a potential wildcard.
Frequently Asked Questions: USDJPY Analysis
What happens if USDJPY breaks above the $159.80 resistance level on the daily chart?
A sustained daily close above $159.80 would be a significant bullish signal, suggesting further upside potential. This could trigger a move towards the next resistance at $160.13, and potentially higher if momentum continues to build, supported by a strong DXY or hawkish Fed commentary.
Should I consider selling USDJPY if it fails to break $159.70 and falls below $159.40 support?
Yes, a break below $159.40 on the daily chart would invalidate the short-term bullish bias and could signal a retracement. This would create a high-probability short setup targeting support levels at $159.23 and $159.04, especially if accompanied by increasing volume and negative divergence on oscillators.
Is the RSI at 44.05 on the daily chart a bearish signal for USDJPY?
An RSI of 44.05 is in neutral territory but leans bearish, indicating a lack of strong upward momentum on the daily timeframe. While not a direct sell signal, it suggests that the upside might be limited and that a pullback is more likely than a sustained rally without further bullish confirmation.
How will upcoming US inflation data affect USDJPY this week?
Higher-than-expected inflation could lead the Fed to delay rate cuts, strengthening the US Dollar and pushing USDJPY higher towards resistance. Conversely, softer inflation might increase expectations for Fed easing, weakening the dollar and potentially causing USDJPY to pull back from current levels.
Track markets in real-time
AI-powered analysis, technical indicators and real-time price data.
Join Our Telegram Channel
Breaking market news, AI analysis and trading signals instantly.
Join Channel