Weekly Market Review: March 23, 2026 – March 27, 2026 (Week 13)
Executive Summary
The trading week of March 23-27, 2026, was dominated by escalating geopolitical tensions, which propelled gold prices past the $4,500 mark and crude oil above $100 per barrel. Major stock indices, including the S&P 500, Nasdaq 100, and Dow Jones 30, experienced significant declines, closing the week with substantial losses. The US Dollar Index (DXY) showed resilience, closing higher, while the Japanese Yen weakened against the dollar. Risk-off sentiment permeated financial markets, impacting currency majors and cryptocurrencies negatively.
US Dollar & DXY Analysis
The US Dollar Index (DXY) demonstrated strength throughout the week, closing at 99.914, marking a 0.34% gain for the week. Technical indicators across multiple timeframes supported this upward momentum. On the daily timeframe, the RSI(14) stood at 61.7, indicating bullish sentiment. The MACD histogram showed a positive value of +0.01, suggesting upward momentum, and the ADX at 1.0 indicated a developing trend. Shorter timeframes echoed this strength, with the 1-hour RSI at 69.8 and the 4-hour RSI at 67.6, both in overbought territory. Stochastic %K was high across all frames, reaching 90.8 on the 1-hour chart. The DXY found resistance near its R2 level of 99.950 and closed just below R3 at 100.21, with key support noted at the Pivot of 99.500.
The Euro faced headwinds against the US Dollar, with EUR/USD closing the week at 1.15089, down 0.19% on Friday. The pair struggled to gain traction, with technical indicators leaning bearish across timeframes. The daily RSI(14) was 40.0, below the neutral 50 level, and the Stochastics %K was at 49.7, while %D was at 66.2, suggesting potential for further downside. The 1-hour RSI was 42.9 and the 4-hour RSI was 39.0, both indicating bearish momentum. The MACD histogram remained flat at +0.00 on the daily chart, and the ADX at 1.0 suggested a lack of strong trend. Key support was tested near S1 at 1.15093. The pair closed below the 20-day SMA of 1.15680.
Sterling depreciated against the US Dollar, with GBP/USD closing the week at 1.32699, down 0.44% on Friday. The pair showed consistent weakness, with bearish signals across multiple timeframes. The daily RSI(14) was 41.2, and Stochastics %K was at 35.4, with %D at 57.4. The 1-hour RSI was 33.6 and the 4-hour RSI also at 33.6, both firmly in oversold territory but indicating strong downward momentum. The MACD histogram was flat at +0.00 on the daily chart, and the ADX at 1.0 did not suggest a strong trend. The pair tested support near S1 at 1.32993. The closing price was below the 20-day SMA of 1.33587.
The Japanese Yen experienced significant depreciation against the US Dollar, with USD/JPY closing the week at 160.30, up 0.42% on Friday. The pair exhibited strong bullish momentum across all analyzed timeframes. The daily RSI(14) was 63.1, entering bullish territory, and Stochastics %K was at 87.8, indicating overbought conditions. The 1-hour RSI was 70.4 and the 4-hour RSI was 70.0, both firmly in overbought territory. The MACD histogram showed a positive value of +0.05 on the daily chart, reinforcing the upward trend. The ADX at 1.0 suggested a developing trend. The pair traded above the R1 resistance level of 159.89, closing near R2 at 160.15, and testing towards R3 at 160.45.
The Australian Dollar weakened against the US Dollar, closing the week at 0.68761, down 0.16% on Friday. The pair displayed bearish sentiment across shorter timeframes. The daily RSI(14) was 37.4, indicating bearish conditions. Stochastics %K was at 8.0, with %D at 25.9, suggesting oversold conditions but weak upward momentum. The 1-hour RSI was 37.3 and the 4-hour RSI was 29.3, both in oversold territory, pointing to strong selling pressure. The MACD histogram was flat at 0.00 on the daily chart. The pair traded below the Pivot of 0.69056 and tested the S1 support level at 0.68557.
The New Zealand Dollar also saw depreciation against the US Dollar, closing the week at 0.57468, down 0.25% on Friday. The pair exhibited consistent bearish signals across multiple timeframes. The daily RSI(14) was 36.1, in oversold territory, and Stochastics %K was at 14.6, with %D at 34.0. The 1-hour RSI was 34.8 and the 4-hour RSI was 31.2, both indicating strong selling pressure. The MACD histogram was flat at 0.00 on the daily chart. The pair traded below the Pivot of 0.57728 and tested the S1 support level at 0.57378.
Gold experienced a significant surge this week, closing at 4,495.44, up 2.68% on Friday, driven by escalating geopolitical tensions. The weekly sentiment was mixed, with 1-hour and 4-hour charts showing BUY signals (RSI 56.7 and 50.6 respectively), while the daily chart indicated SELL (RSI 36.3). Despite the daily bearish RSI, the upward price action was strong, pushing gold towards its R1 resistance level of 4,497.62. The MACD histogram on the daily chart was -66.91, indicating bearish momentum on that timeframe, but the price action suggested otherwise. The ADX at 1.0 indicated a weak trend. The price closed above the 20-day SMA of 4,882.31 was not achieved, but it was above the 1-hour SMA 20 of 4,453.85. Gold tested the R1 resistance at 4,497.62.
Silver followed gold's lead, experiencing a notable increase and closing the week at 69.738, up 2.65% on Friday. Geopolitical jitters provided support for the precious metal. Technical indicators presented a mixed picture. The daily RSI(14) was 38.5, indicating bearish conditions, and the 4-hour RSI was 49.0, near neutral. The 1-hour RSI was 53.2, suggesting a slight bullish bias on the short term. The MACD histogram on the daily chart was -1.18, indicating bearish momentum. The ADX at 1.0 showed a weak trend. Silver traded below the Pivot of 68.920 and tested the R1 resistance at 71.180. The closing price was below the 20-day SMA of 78.573.
Brent crude oil prices surged significantly, closing the week at $110.64, a 6.77% increase on Friday. Escalating geopolitical tensions in the Middle East were the primary driver of this rally. The daily RSI(14) was 69.4, indicating strong bullish momentum approaching overbought territory. The MACD histogram was -0.17 on the daily chart, suggesting a potential shift, but the price action indicated strength. The ADX at 1.0 indicated a developing trend. Brent crude traded above its 20-day SMA of 97.49 and tested resistance near R3 at 111.91.
Resistance
Price
R3
111.91
R2
109.05
R1
106.34
Pivot
103.48
Support
Price
S1
100.77
S2
97.91
S3
95.20
Fib 61.8%
85.00
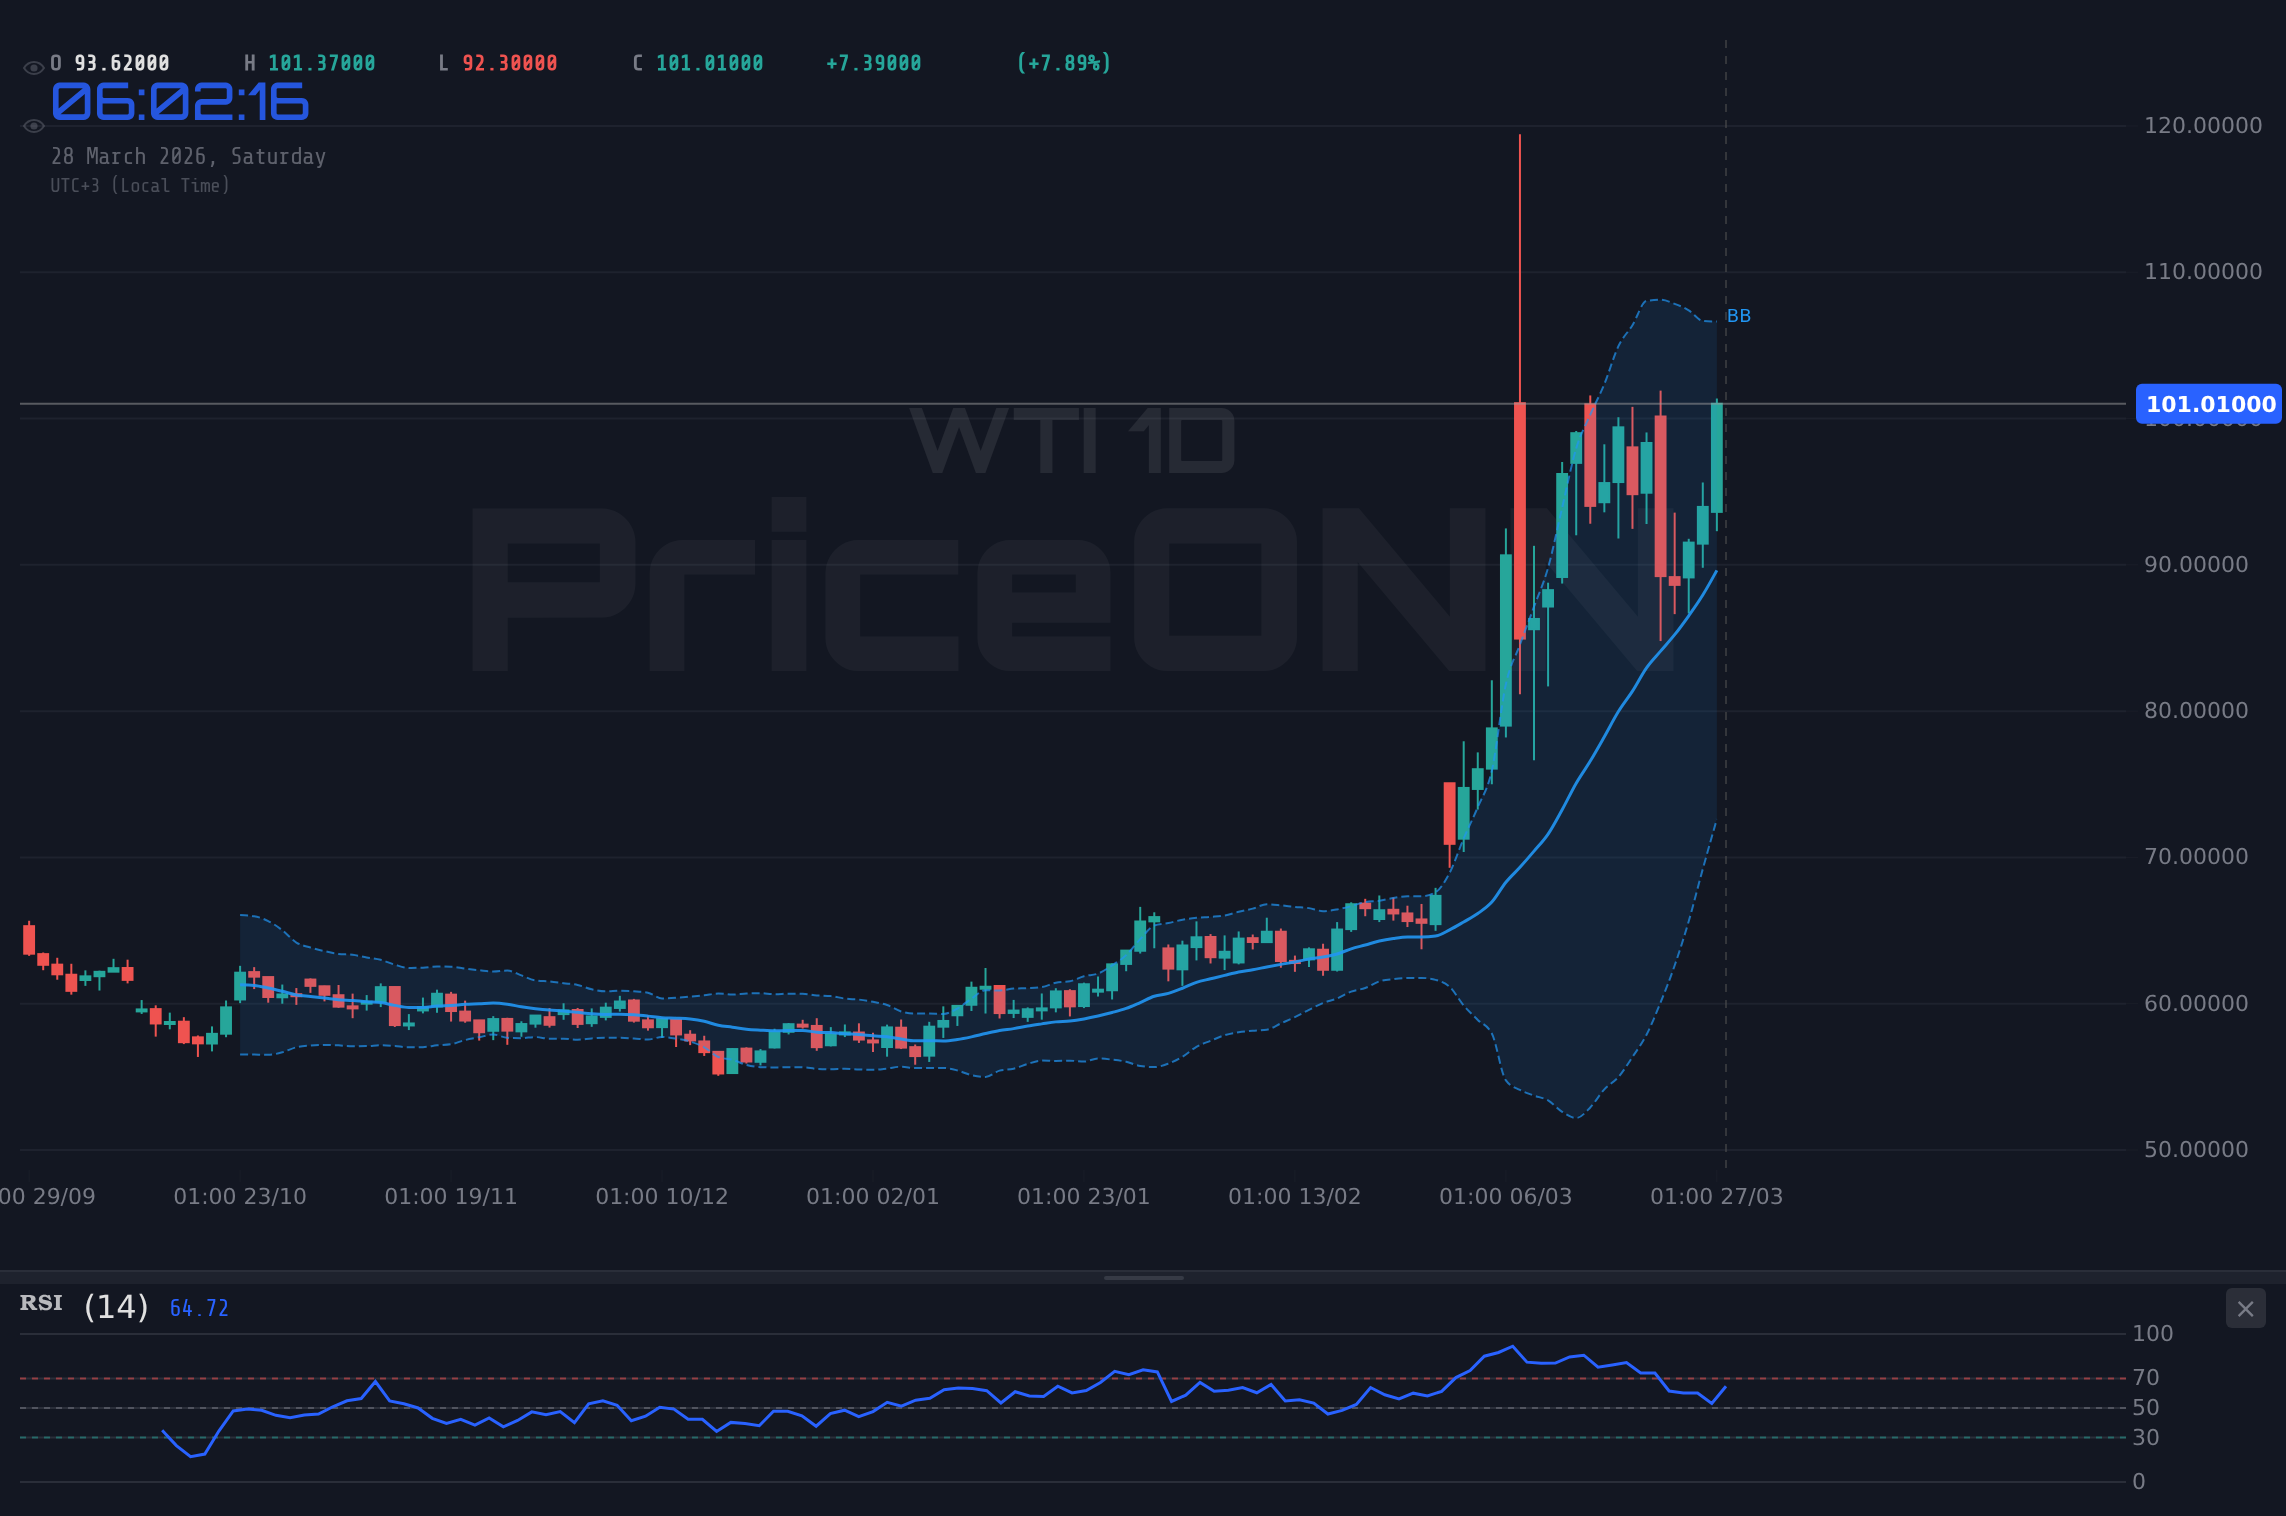
WTI Crude Oil
West Texas Intermediate (WTI) crude oil prices also experienced a substantial rally, closing the week at $101.19, up 7.69% on Friday. This surge mirrored Brent's upward movement, largely attributed to increased geopolitical tensions. The daily RSI(14) was 67.3, showing strong bullish momentum. The MACD histogram was -0.33 on the daily chart, suggesting a potential shift, but the price action was strongly bullish. The ADX at 1.0 indicated a developing trend. WTI crude traded above its 20-day SMA of 89.63 and pushed towards the R3 resistance level of 102.29.
Bitcoin saw a slight downturn, closing the week at $66,069, down 0.05% on Friday. Despite the minor weekly loss, the cryptocurrency showed resilience amid broader market weakness. The daily RSI(14) was 40.1, indicating a neutral to slightly bearish sentiment, and the Stochastics %K was at 12.5, suggesting oversold conditions. The 1-hour RSI was 32.2 and the 4-hour RSI was 31.4, both in oversold territory, hinting at potential buying opportunities. The MACD histogram on the daily chart was -501.90, signalling bearish momentum. Bitcoin traded below its 20-day SMA of 70,331 and tested the S1 support level at 64,708.
Ethereum experienced a marginal gain, closing the week at $1,986.68, up 0.17% on Friday. The cryptocurrency's performance was relatively stable amidst market volatility. The daily RSI(14) was 42.6, indicating bearish sentiment, and Stochastics %K was at 10.3, suggesting oversold conditions. The 1-hour RSI was 34.6 and the 4-hour RSI was 31.4, both in oversold territory and pointing to potential buying interest. The MACD histogram on the daily chart was -17.79, signalling bearish momentum. Ethereum traded below its 20-day SMA of 2,119.41 and tested the S1 support level at 1,939.85.
The S&P 500 index faced significant selling pressure, closing the week at 6,358, down 2% on Friday. Risk-off sentiment dominated equity markets, driven by geopolitical concerns and inflation fears. The daily RSI(14) was 26.7, firmly in oversold territory, indicating strong bearish momentum. Stochastics %K was at 22.8, also suggesting oversold conditions. The 1-hour RSI was 19.9 and the 4-hour RSI was 26.9, both deeply oversold. The MACD histogram on the daily chart was -24.66, reinforcing the bearish trend. The index traded below its 20-day SMA of 6,677 and tested the S2 support level at 6,389.
The Nasdaq 100 index experienced a sharp decline, closing the week at 23,092, down 2.23% on Friday. Technology stocks were particularly hard-hit amidst the broader market sell-off. The daily RSI(14) was 28.6, deep in oversold territory, and Stochastics %K was at 16.1, also indicating oversold conditions. The 1-hour RSI was 20.4 and the 4-hour RSI was 24.8, both deeply oversold. The MACD histogram on the daily chart was -120.14, signalling strong bearish momentum. The index traded below its 20-day SMA of 24,475 and tested the S2 support level at 23,150.
The Dow Jones Industrial Average also registered significant losses, closing the week at 45,078, down 2.08% on Friday. The index reflected the widespread decline in equity markets. The daily RSI(14) was 26.8, deep in oversold territory, and Stochastics %K was at 32.3, suggesting potential for a bounce but indicating bearish momentum. The 1-hour RSI was 22.2 and the 4-hour RSI was 31.9, both indicating selling pressure. The MACD histogram on the daily chart was -89.60, reinforcing the bearish trend. The index traded below its 20-day SMA of 46,969 and tested the S2 support level at 45,508.
Resistance
Price
R3
47,081
R2
46,818
R1
46,426
Pivot
46,163
Support
Price
S1
45,771
S2
45,508
S3
45,116
Fib 61.8%
48,414
Economic Calendar Impact
The past week saw several key economic events that influenced market sentiment and price action. The U.S. Initial Jobless Claims report came in at 210, slightly below the forecast of 211, indicating a marginally stronger labor market than anticipated. The U.S. Crude Oil Inventories reported a significant build of 6.926 million barrels, substantially above the forecast of -1.3 million barrels, which typically would weigh on oil prices but was overshadowed by geopolitical supply concerns. The U.K. Consumer Price Index (CPI) YoY was in line with forecasts at 3%, providing no major catalyst for the GBP. The U.S. Services Purchasing Managers' Index (PMI) was reported at 51.1, below the forecast of 52, suggesting a slight slowdown in the services sector. Conversely, the U.S. Manufacturing Purchasing Managers' Index (PMI) exceeded expectations, coming in at 52.4 versus a forecast of 51.5, indicating expansion in the manufacturing sector. These data points, while providing context, were largely overshadowed by geopolitical events driving commodity and equity markets.
Week in Summary
The week of March 23-27, 2026, was characterized by a sharp escalation in geopolitical tensions, which significantly impacted global markets. Gold and oil prices experienced robust gains as investors sought safe-haven assets and reacted to potential supply disruptions. Conversely, equity markets, including the S&P 500, Nasdaq 100, and Dow Jones 30, suffered considerable losses, closing the week deep in negative territory and testing key support levels. The US Dollar Index strengthened, reflecting a risk-off sentiment. Major currency pairs like EUR/USD and GBP/USD weakened against the dollar, while USD/JPY saw significant appreciation. Cryptocurrencies like Bitcoin and Ethereum also experienced downward pressure, reflecting the broader risk-averse environment. The economic data released during the week, such as jobless claims and PMI figures, provided some insights but were largely secondary to the geopolitical narrative driving market sentiment.
Disclaimer: This content is for informational and educational purposes only and does not constitute investment advice, financial recommendation, or an offer to buy or sell any financial instrument. Past performance does not guarantee future results. Always do your own research and consult a licensed financial advisor before making investment decisions.
Track markets in real-time
AI-powered analysis, technical indicators and real-time price data.
We are looking for writers who produce market analysis, macro commentary, and data-driven content. Reach readers in 10 languages through our multilingual publishing platform.