Weekly Market Review: May 25, 2026 – May 29, 2026 (Week 22)
Executive Summary
The trading week of May 25-29, 2026, was characterized by significant shifts in commodity markets and currency pairs, largely influenced by geopolitical developments and economic data releases. Gold experienced a notable surge, breaking above the $4,500 level, fueled by de-escalation hopes in the Middle East. Conversely, crude oil prices, both Brent and WTI, faced downward pressure as optimism grew regarding the reopening of the Strait of Hormuz. The US Dollar saw a general weakening trend against major currencies, while stock indices like the S&P 500, Nasdaq, and Dow Jones closed the week with gains. Technical indicators across multiple timeframes showed mixed signals, with short-term momentum often diverging from longer-term trends, particularly in cryptocurrencies and some forex pairs.
The US Dollar Index (DXY) experienced a net decline over the week, closing at 98.612, down 0.28% for the daily close. On the 1-hour timeframe, the DXY showed selling pressure with an RSI of 40.1 and a weak sentiment score. The 4-hour chart echoed this bearish sentiment, with an RSI at 40.4 and Stochastic %K at 22.8, indicating oversold conditions. However, the daily chart presented a more neutral to bullish outlook, with an RSI at 50.5 and a strong BUY signal from the technical indicators, suggesting underlying support despite the week's intraday weakness. The ADX at 1.0 across all timeframes indicated a lack of strong directional trend. The weekly sentiment was predominantly sell, reflecting the broader market's move away from the dollar amid easing geopolitical tensions.
Resistance
Price
R3
99.330
R2
99.150
R1
99.020
Pivot
98.840
Support
Price
S1
98.710
S2
98.530
S3
98.400
Fib 61.8%
99.190
Forex Majors Review
EUR/USD closed the week at 1.16597, a gain of 0.32%. The 1-hour and 4-hour charts displayed strong BUY signals with RSI values of 58.9 and 62.1 respectively, and Stochastics in overbought territory. However, the daily chart leaned towards a SELL signal with an RSI of 47.9. The overall sentiment was Buy (90%) despite the conflicting daily signals, suggesting short-term strength. The key resistance level was R1 at 1.16483.
XAUUSD 4H Chart
Resistance
Price
R3
1.16872
R2
1.16738
R1
1.16483
Pivot
1.16349
Support
Price
S1
1.16094
S2
1.15960
S3
1.15705
Fib 38.2%
1.17000
GBP/USD finished the week at 1.34564, up 0.24%. Similar to EUR/USD, the 1-hour and 4-hour charts indicated BUY signals with RSI at 61.8 and 57.1, and Stochastics in the upper range. The daily chart, however, was neutral (4/4/0 Buy/Sell/Neutral), with an RSI of 48.0. Weekly sentiment was Buy (80%). Resistance was tested at R1: 1.34498.
Resistance
Price
R3
1.34925
R2
1.34752
R1
1.34498
Pivot
1.34325
Support
Price
S1
1.34071
S2
1.33898
S3
1.33644
Fib 38.2%
1.35000
USD/JPY saw a slight depreciation, closing at 159.26, down 0.15%. The 1-hour and 4-hour charts were neutral (4/4/0), with RSI values around 48.4 and 51.4 respectively. In contrast, the daily chart showed a strong BUY signal with an RSI of 56.2 and Stochastics nearing overbought levels (85.7%K). Weekly sentiment was strongly Buy (90%), indicating a potential bullish undertone despite intraday choppiness. The pair approached daily resistance R1 at 159.66.
Resistance
Price
R3
160.06
R2
159.82
R1
159.66
Pivot
159.41
Support
Price
S1
159.26
S2
159.01
S3
158.86
Fib 61.8%
158.54
AUD/USD posted a solid gain of 0.68%, closing at 0.71846. Across all timeframes (1H, 4H, 1D), strong BUY signals were prevalent, supported by RSI levels ranging from 50.8 to 65.2 and Stochastics %K above 55%. The weekly sentiment was a strong Buy (90%). The pair traded near the daily resistance R1 of 0.71689.
Resistance
Price
R3
0.72246
R2
0.72016
R1
0.71689
Pivot
0.71459
Support
Price
S1
0.71132
S2
0.70902
S3
0.70575
Fib 38.2%
0.71000
NZD/USD experienced a significant increase of 1.52%, closing at 0.59895. The 1-hour chart showed overbought conditions with an RSI of 75.2 and Stochastics %K at 70.2. The 4-hour and daily charts also presented BUY signals, with RSI at 77.1 and 56.2, respectively. Weekly sentiment was a strong Buy (100%). The pair approached daily resistance R1 at 0.59301.
Resistance
Price
R3
0.60097
R2
0.59602
R1
0.59301
Pivot
0.58806
Support
Price
S1
0.58505
S2
0.58010
S3
0.57709
Fib 38.2%
0.59000
Precious Metals
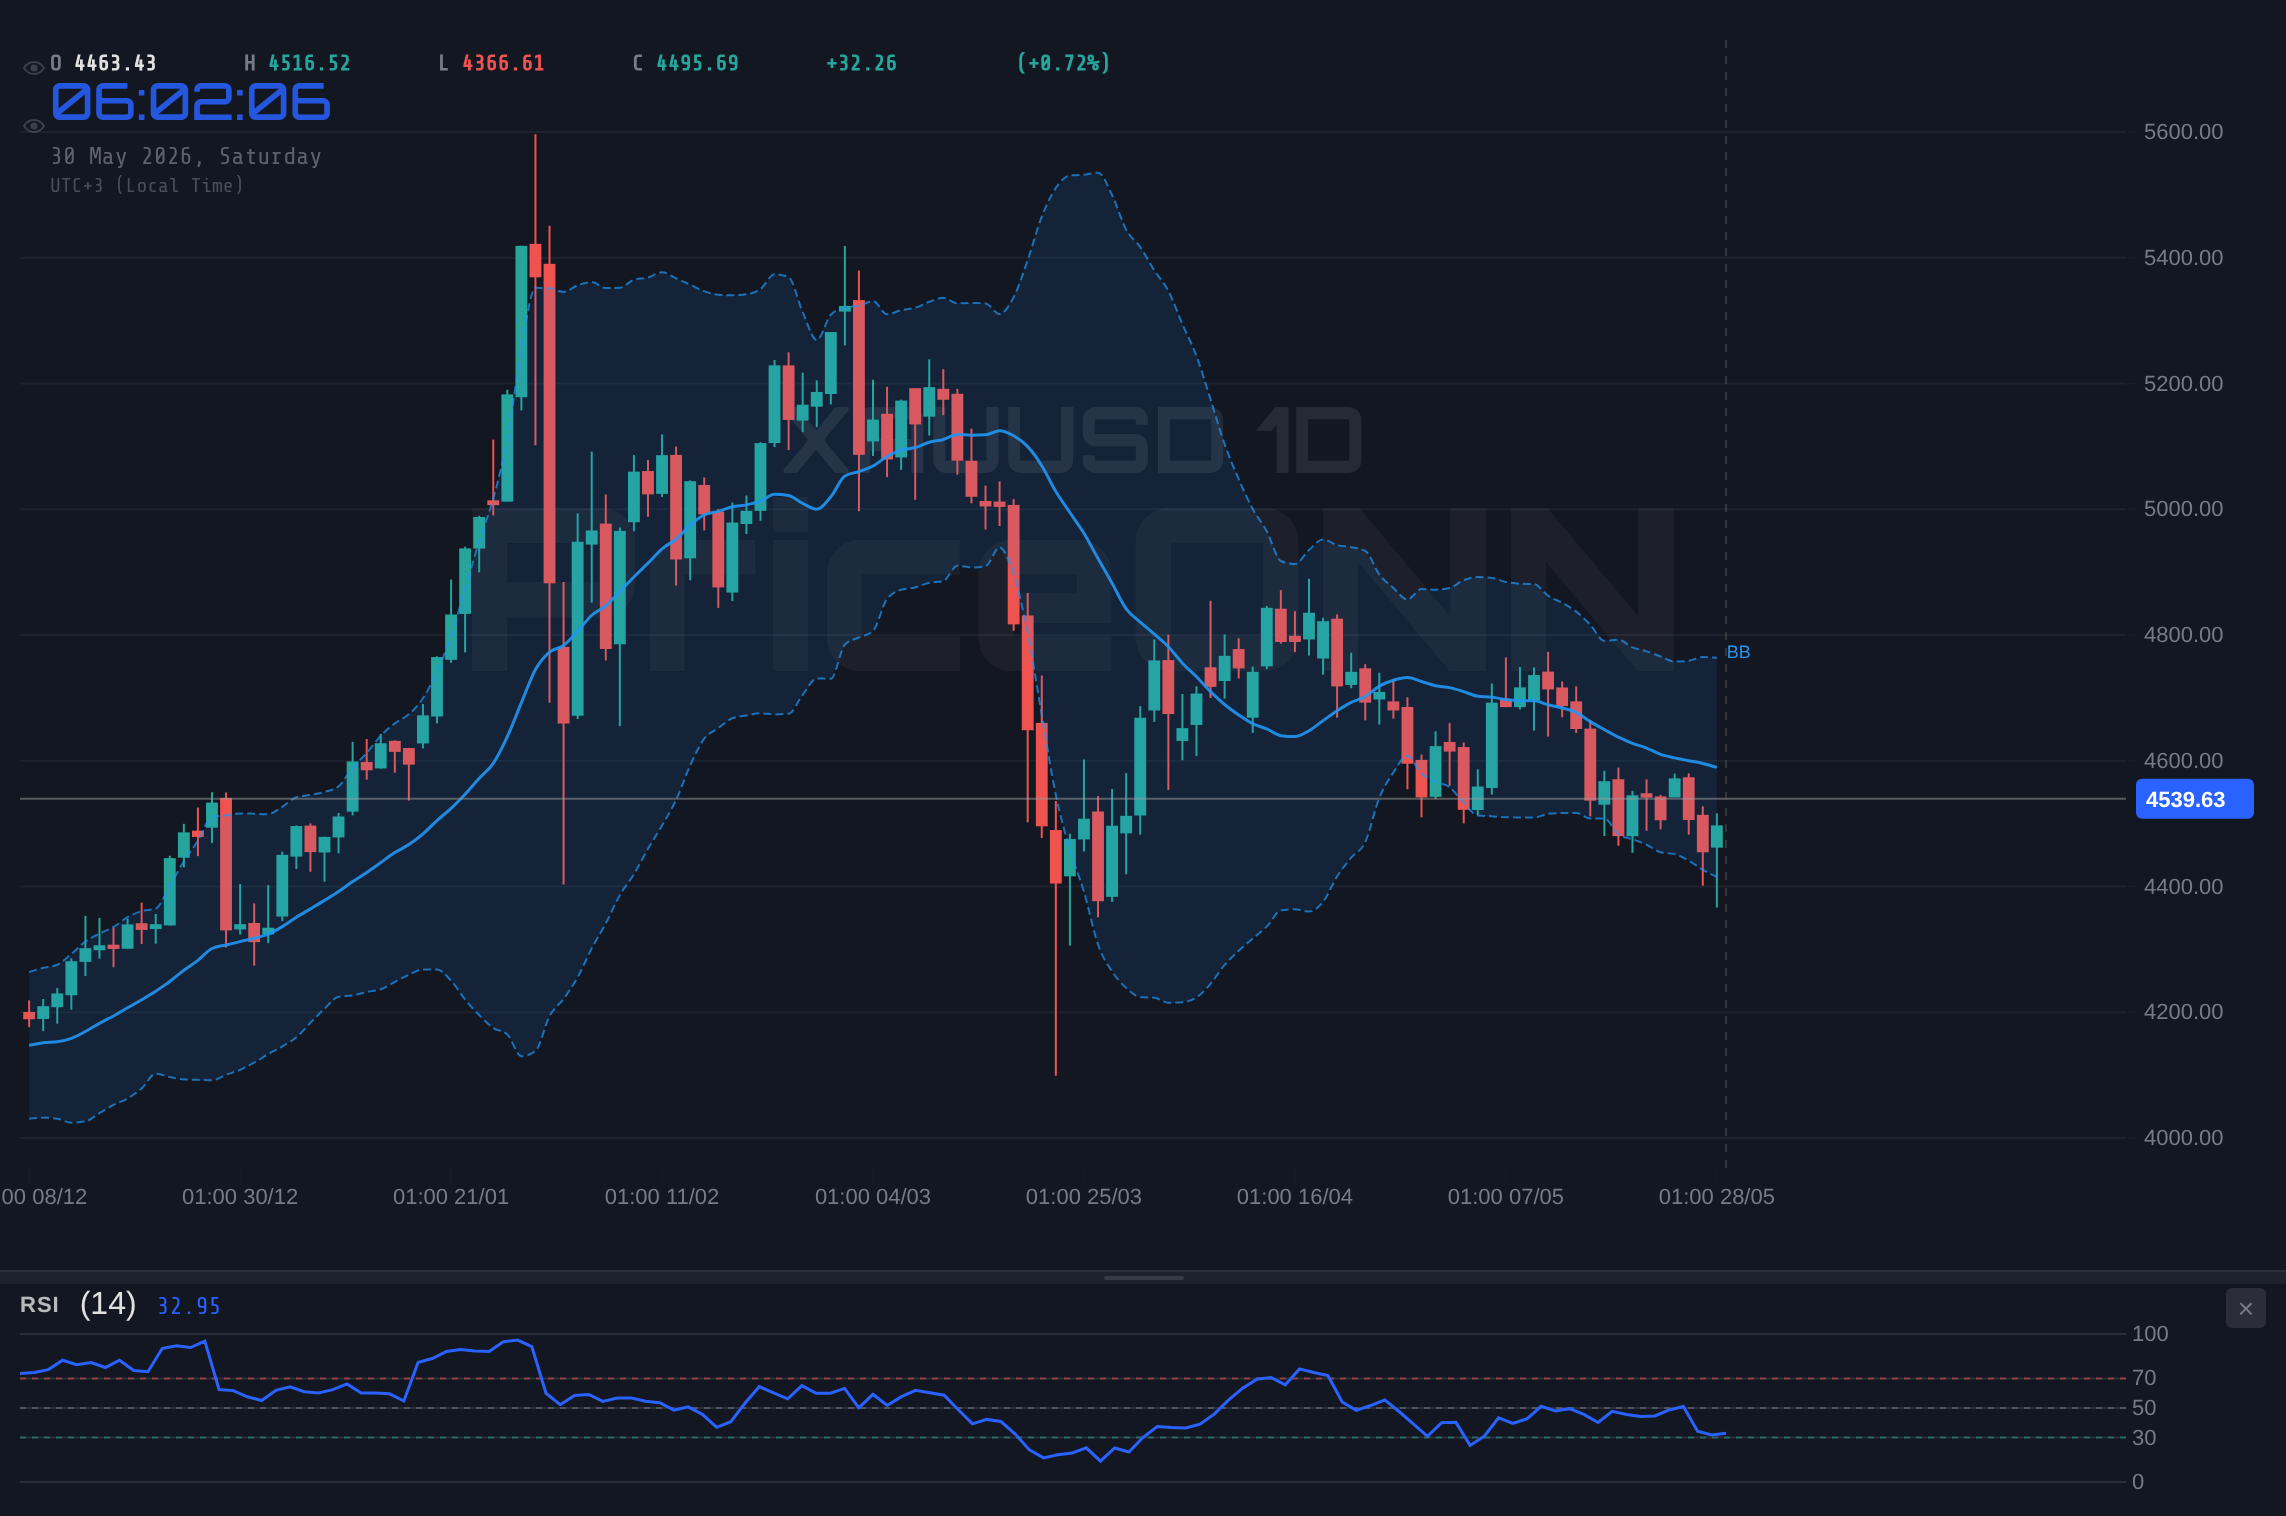
XAUUSD (Gold) saw a substantial rise of 1.88% for the week, closing at 4,539.98. The 1-hour and 4-hour charts displayed BUY signals with RSI at 58.3 and 58.5, and Stochastics in the upper range. However, the daily chart indicated a SELL signal with an RSI of 45.4. This divergence contributed to a mixed sentiment, though the overall strength indicated Buy (83%). Gold surpassed the daily Pivot level of 4,461.65 and approached R1 at 4,522.01, with the 50% Fibonacci retracement at 4,494.17 acting as a prior support.
Resistance
Price
R3
4,648.33
R2
4,587.97
R1
4,522.01
Pivot
4,461.65
Support
Price
S1
4,395.69
S2
4,335.33
S3
4,269.37
Fib 61.8%
4,587.44
XAGUSD (Silver) gained 0.94% over the week, closing at 75.312. The 1-hour and 4-hour charts showed conflicting signals, with RSI at 49.5 and 48.5 respectively, and Stochastics in the upper half. The daily chart presented a SELL signal with an RSI of 46.5. Despite the mixed signals, the overall sentiment leaned towards Buy (91%), possibly influenced by gold's performance. The price action stayed below the daily Pivot of 75.180.
Resistance
Price
R3
80.970
R2
79.230
R1
76.920
Pivot
75.180
Support
Price
S1
72.870
S2
71.130
S3
68.820
Fib 50.0%
75.150
Energy Markets
BRENT Crude Oil closed the week at 95.16, marking a decrease of 1.46%. The 1-hour chart showed a neutral sentiment with an RSI of 47.3 and Stochastics at 64.5. However, the 4-hour and daily charts exhibited strong SELL signals, with RSI at 36.8 and 37.9 respectively, and Stochastics deeply oversold. The ADX at 1.0 across all timeframes indicated a weak trend. Despite the bearish technicals on longer timeframes, the weekly sentiment was Buy (100%). Price action was below the 20-day SMA of 94.97 and approached the daily Pivot of 97.40.
Resistance
Price
R3
104.22
R2
102.23
R1
99.39
Pivot
97.40
Support
Price
S1
94.56
S2
92.57
S3
89.73
Fib 23.6%
95.11
WTI Crude Oil also declined, closing at 90.24, down 1.87%. Similar to Brent, the 1-hour chart showed a neutral sentiment (RSI 47.5), while the 4-hour and daily charts indicated strong SELL signals (RSI 37.0 and 39.8). Stochastics were in oversold territory on the 4-hour timeframe. The ADX at 1.0 suggested a lack of trend strength. Weekly sentiment was strongly Buy (100%). Price action hovered near the 20-hour SMA of 90.05, below the daily Pivot of 92.84.
Resistance
Price
R3
101.22
R2
98.72
R1
95.34
Pivot
92.84
Support
Price
S1
89.46
S2
86.96
S3
83.58
Fib 23.6%
90.30
Cryptocurrency Update
BTC/USD closed the week at 73,784, showing a modest gain of 0.27%. The 1-hour chart presented a neutral sentiment with an RSI of 53.6. However, the 4-hour chart indicated a SELL signal with an RSI of 38.4, and the daily chart showed a strong SELL signal with an RSI of 36.4, pointing towards oversold conditions. MACD histograms showed conflicting signals across timeframes. Weekly sentiment was strongly Sell (91%), suggesting caution despite the intraday strength. The price action was below the daily Pivot of 73,816.
Resistance
Price
R3
77,737
R2
76,508
R1
75,045
Pivot
73,816
Support
Price
S1
72,353
S2
71,124
S3
69,661
Fib 78.6%
73,150
ETH/USD closed at 2,020.27, up 0.41%. The 1-hour chart showed a neutral sentiment (RSI 54.5), while the 4-hour and daily charts indicated strong SELL signals with RSI values of 43.7 and 33.7, respectively, suggesting oversold conditions on longer timeframes. MACD histograms were mixed. The weekly sentiment was a strong Sell (100%), highlighting potential downside risk. The price traded near the daily Pivot of 2,012.78.
Resistance
Price
R3
2,156.23
R2
2,108.63
R1
2,060.38
Pivot
2,012.78
Support
Price
S1
1,964.53
S2
1,916.93
S3
1,868.68
Fib 23.6%
2,082.49
Stock Indices
S&P 500 concluded the week at 6,573, a gain of 0.74%. The 1-hour and 4-hour charts showed BUY signals with RSI at 71.0 and 62.8, indicating bullish momentum. However, the daily chart presented a SELL signal with an RSI of 45.4. The weekly sentiment was Buy (80%), suggesting resilience. The index traded near the daily R1 resistance level of 6,605.
Resistance
Price
R3
6,833
R2
6,686
R1
6,605
Pivot
6,458
Support
Price
S1
6,377
S2
6,231
S3
6,150
Fib 38.2%
6,579
Nasdaq 100 closed at 30,319, up 0.89%. The 1-hour and 4-hour charts indicated strong BUY signals with RSI at 57.8 and 64.6, and Stochastics in overbought territory. The daily chart showed a neutral signal (4/3/0), with an RSI of 77.5 indicating overbought conditions. Weekly sentiment was mixed, leaning towards Sell (80%) due to the stretched daily indicators. The index tested the daily R1 resistance of 30,303.
Resistance
Price
R3
30,806
R2
30,556
R1
30,303
Pivot
30,054
Support
Price
S1
29,801
S2
29,551
S3
29,298
Fib 0.0%
30,306
Dow Jones 30 finished at 51,004, an increase of 0.57%. All timeframes showed strong BUY signals, with RSI values ranging from 64.1 to 67.8, and Stochastics in overbought territory. Weekly sentiment was Buy (80%). The index traded near the daily R1 resistance level of 50,883.
Resistance
Price
R3
51,276
R2
51,051
R1
50,883
Pivot
50,658
Support
Price
S1
50,490
S2
50,265
S3
50,097
Fib 50.0%
47,966
Economic Calendar Impact
The week's market movements were significantly shaped by economic data and geopolitical events. Hopes for a US-Iran de-escalation spurred demand for risk assets, leading to a weaker US Dollar and a surge in gold prices past $4,500. Conversely, optimism surrounding the potential reopening of the Strait of Hormuz contributed to a sharp decline in crude oil prices (Brent and WTI). The release of the Swiss KOF Economic Barometer, which edged up to 98.0, provided mild support for the Swiss Franc, though its impact was overshadowed by broader market trends. Investors also reacted to signals from the Reserve Bank of New Zealand (RBNZ), which hinted at aggressive rate hikes, contributing to the New Zealand Dollar's strength. The focus on upcoming US employment data, particularly Non-Farm Payrolls, created anticipation, though the actual results for the week were from earlier events.
Week in Summary
The week of May 25-29, 2026, saw a notable rotation in market leadership. Gold emerged as a clear winner, driven by geopolitical easing and safe-haven demand, breaking through the $4,500 mark. Crude oil experienced a significant pullback as supply concerns eased. The US Dollar weakened against most majors, reflecting a global risk-on sentiment. Stock indices like the S&P 500, Nasdaq, and Dow Jones posted gains, indicating investor confidence in equities. Cryptocurrencies like Bitcoin and Ethereum showed mixed signals, with daily charts suggesting potential downside despite short-term strength. The overarching theme was the market's reaction to shifting geopolitical narratives and anticipation of key economic data, leading to divergent performance across asset classes.
Disclaimer: This content is for informational and educational purposes only and does not constitute investment advice, financial recommendation, or an offer to buy or sell any financial instrument. Past performance does not guarantee future results. Always do your own research and consult a licensed financial advisor before making investment decisions.
Track markets in real-time
AI-powered analysis, technical indicators and real-time price data.
We are looking for writers who produce market analysis, macro commentary, and data-driven content. Reach readers in 10 languages through our multilingual publishing platform.