Weekly Market Outlook - Week 20 (May 11, 2026 – May 15, 2026): US CPI Dominance, Gold Levels, and Tech Sentiment
Week 20 (May 11, 2026 – May 15, 2026) market outlook: US CPI data takes center stage, influencing DXY, Gold, and risk assets. Key levels and scenarios analyzed.
Weekly Market Outlook: May 11, 2026 – May 15, 2026 (Week 20)
Executive Summary
This coming trading week, commencing May 11, 2026, is poised to be heavily influenced by key US inflation data, particularly the Consumer Price Index (CPI) on Tuesday. Market participants will be scrutinizing these figures for potential shifts in monetary policy expectations. Gold will likely remain a focal point, with traders watching critical support and resistance levels closely. Meanwhile, the ongoing AI-driven rally in US equity indices faces potential headwinds from inflation concerns and geopolitical undercurrents, while the US Dollar Index (DXY) appears to be testing key support levels.
US Dollar & DXY Outlook
The US Dollar Index (DXY) is currently positioned with a bearish sentiment across multiple timeframes, indicated by a daily RSI of 41.4, falling within the oversold territory. The MACD histogram is negative on daily and weekly charts, suggesting downward momentum. While the 1-hour and 4-hour charts show some divergence with positive MACD histograms, the overarching trend appears weak. Traders will be closely monitoring the Pivot level at 97.830. A sustained break below this level could signal further downside towards S1 at 97.660 and potentially S2 at 97.350. Conversely, a recovery above the Pivot might see the index target resistance at R1 (98.150). The upcoming US CPI data on Tuesday will be a critical catalyst for the dollar's direction.
EUR/USD exhibits a strong bullish sentiment, supported by a daily RSI of 59.9 and consistently positive MACD histograms across all observed timeframes. The Stochastic Oscillator on the 4-hour chart is in overbought territory (80.6), suggesting a potential for short-term consolidation, but the overall trend remains upward. Key resistance will be tested at R1 (1.17602), followed by R2 (1.17967). A break above R2 could open the path towards R3 (1.18159). On the downside, support can be found at the Pivot (1.17410), then S1 (1.17045), and further down at S2 (1.16853). The upcoming German and Eurozone CPI and ZEW sentiment data will be important for this pair.
GBP/USD demonstrates a robust bullish bias, with daily RSI at 61.2 and a strong positive MACD signal on the daily timeframe. The Stochastics on the 1-hour and 4-hour charts are showing overbought conditions (74.9%K and 79.5%K respectively), which might precede a brief pullback. However, the overall sentiment remains bullish. Key resistance levels to watch will be R1 (1.36043), followed by R2 (1.36601). A decisive move above R2 could propel the pair towards R3 (1.36891). Support is expected at the Pivot (1.35753), with subsequent levels at S1 (1.35195) and S2 (1.34905). UK economic data, including Industrial Production and GDP, will be influential.
USD/JPY is exhibiting mixed signals, with a bearish daily sentiment (RSI 40.8, negative MACD histogram) but a bullish 1-hour sentiment (RSI 51.4, positive MACD histogram). The Stochastic Oscillator on the 1-hour chart is in bullish territory (68.4%K), while the 4-hour chart is also showing strength (68.9%K). The key level to watch is the Pivot at 156.61. A break below this could lead to tests of S1 (156.28) and S2 (155.68). Resistance will be faced at R1 (157.21) and potentially R2 (157.54). Given the conflicting signals, this pair may experience choppiness until clearer directional impetus emerges, possibly from US economic data impacting the DXY.
AUD/USD displays a strong bullish sentiment, with a daily RSI of 62.8 and a predominantly BUY signal across timeframes. The Stochastic Oscillator on the 1-hour (74.8%K) and 4-hour (58.7%K) charts suggest upward momentum, with the 1-hour approaching overbought conditions. Key resistance will be observed at R1 (0.72447). A break above this could target R2 (0.72838) and potentially R3 (0.73045). Support is anticipated at the Pivot (0.72240), followed by S1 (0.71849) and S2 (0.71642). Australian economic data is light this week, so global sentiment and USD weakness will likely drive direction.
NZD/USD also shows a strong bullish posture, with a daily RSI of 60.4 and a high BUY sentiment score. The 1-hour Stochastic (59.1%K) and 4-hour Stochastic (55.3%K) indicate continued upward potential. The key resistance level to monitor is R1 (0.59665). A decisive move above this could see the pair advance towards R2 (0.59979) and potentially R3 (0.60136). Support is expected at the Pivot (0.59508), followed by S1 (0.59194) and S2 (0.59037). Similar to AUD/USD, direction will likely be influenced by broader market sentiment and USD dynamics.
Gold is currently displaying a neutral to slightly bullish technical posture. The daily RSI is 51.7, sitting near the midpoint, while the 4-hour RSI is stronger at 60.2. The MACD histogram is positive on the daily chart, suggesting underlying bullish momentum, though the 1-hour MACD histogram is negative. The immediate focus will be on the Pivot level at 4,712.20. A break above this pivot could lead to tests of R1 (4,659.90) and potentially R2 (4,632.82). However, the data shows the R1 at 4,739.28 and R2 at 4,791.58. Let's re-align with the provided R1/R2 values. Resistance is expected at R1 (4,739.28), then R2 (4,791.58), and R3 (4,818.66). Support can be found at the Pivot (4,712.20), followed by S1 (4,659.90), and S2 (4,632.82). The 50-day SMA at 4,758.92 also acts as a significant psychological level. The US CPI data will be a major driver; higher-than-expected inflation could support gold, while a surprisingly low print might weigh on it.
Silver mirrors gold's sentiment with a bullish leaning, supported by a daily RSI of 58.8 and a positive MACD histogram on the daily chart. The 4-hour RSI at 64.0 indicates solid upward momentum. Key resistance is seen at R1 (81.410). A successful breach could lead to tests of R2 (84.320) and R3 (86.550). Support is expected around the Pivot (79.180), followed by S1 (76.270), and S2 (74.040). The 50% Fibonacci retracement level at 78.650 is also a notable price point. Like gold, silver's trajectory will be significantly impacted by the US CPI release.
Brent Crude is showing mixed signals. The daily RSI is 48.4, indicating a neutral stance, while the 4-hour RSI is weaker at 38.2, suggesting potential downside. The MACD histogram is negative on the daily chart, pointing to bearish momentum, though the 1-hour shows a slight positive uptick. Key support will be tested at the Pivot (104.68). A break below could lead to tests of S1 (102.03) and S2 (97.07). Resistance is expected at R1 (109.64), followed by R2 (112.29). The 38.2% Fibonacci retracement at 101.54 also presents a significant level. Geopolitical developments and OPEC+ decisions will remain key drivers, alongside global demand outlook, which could be influenced by inflation data.
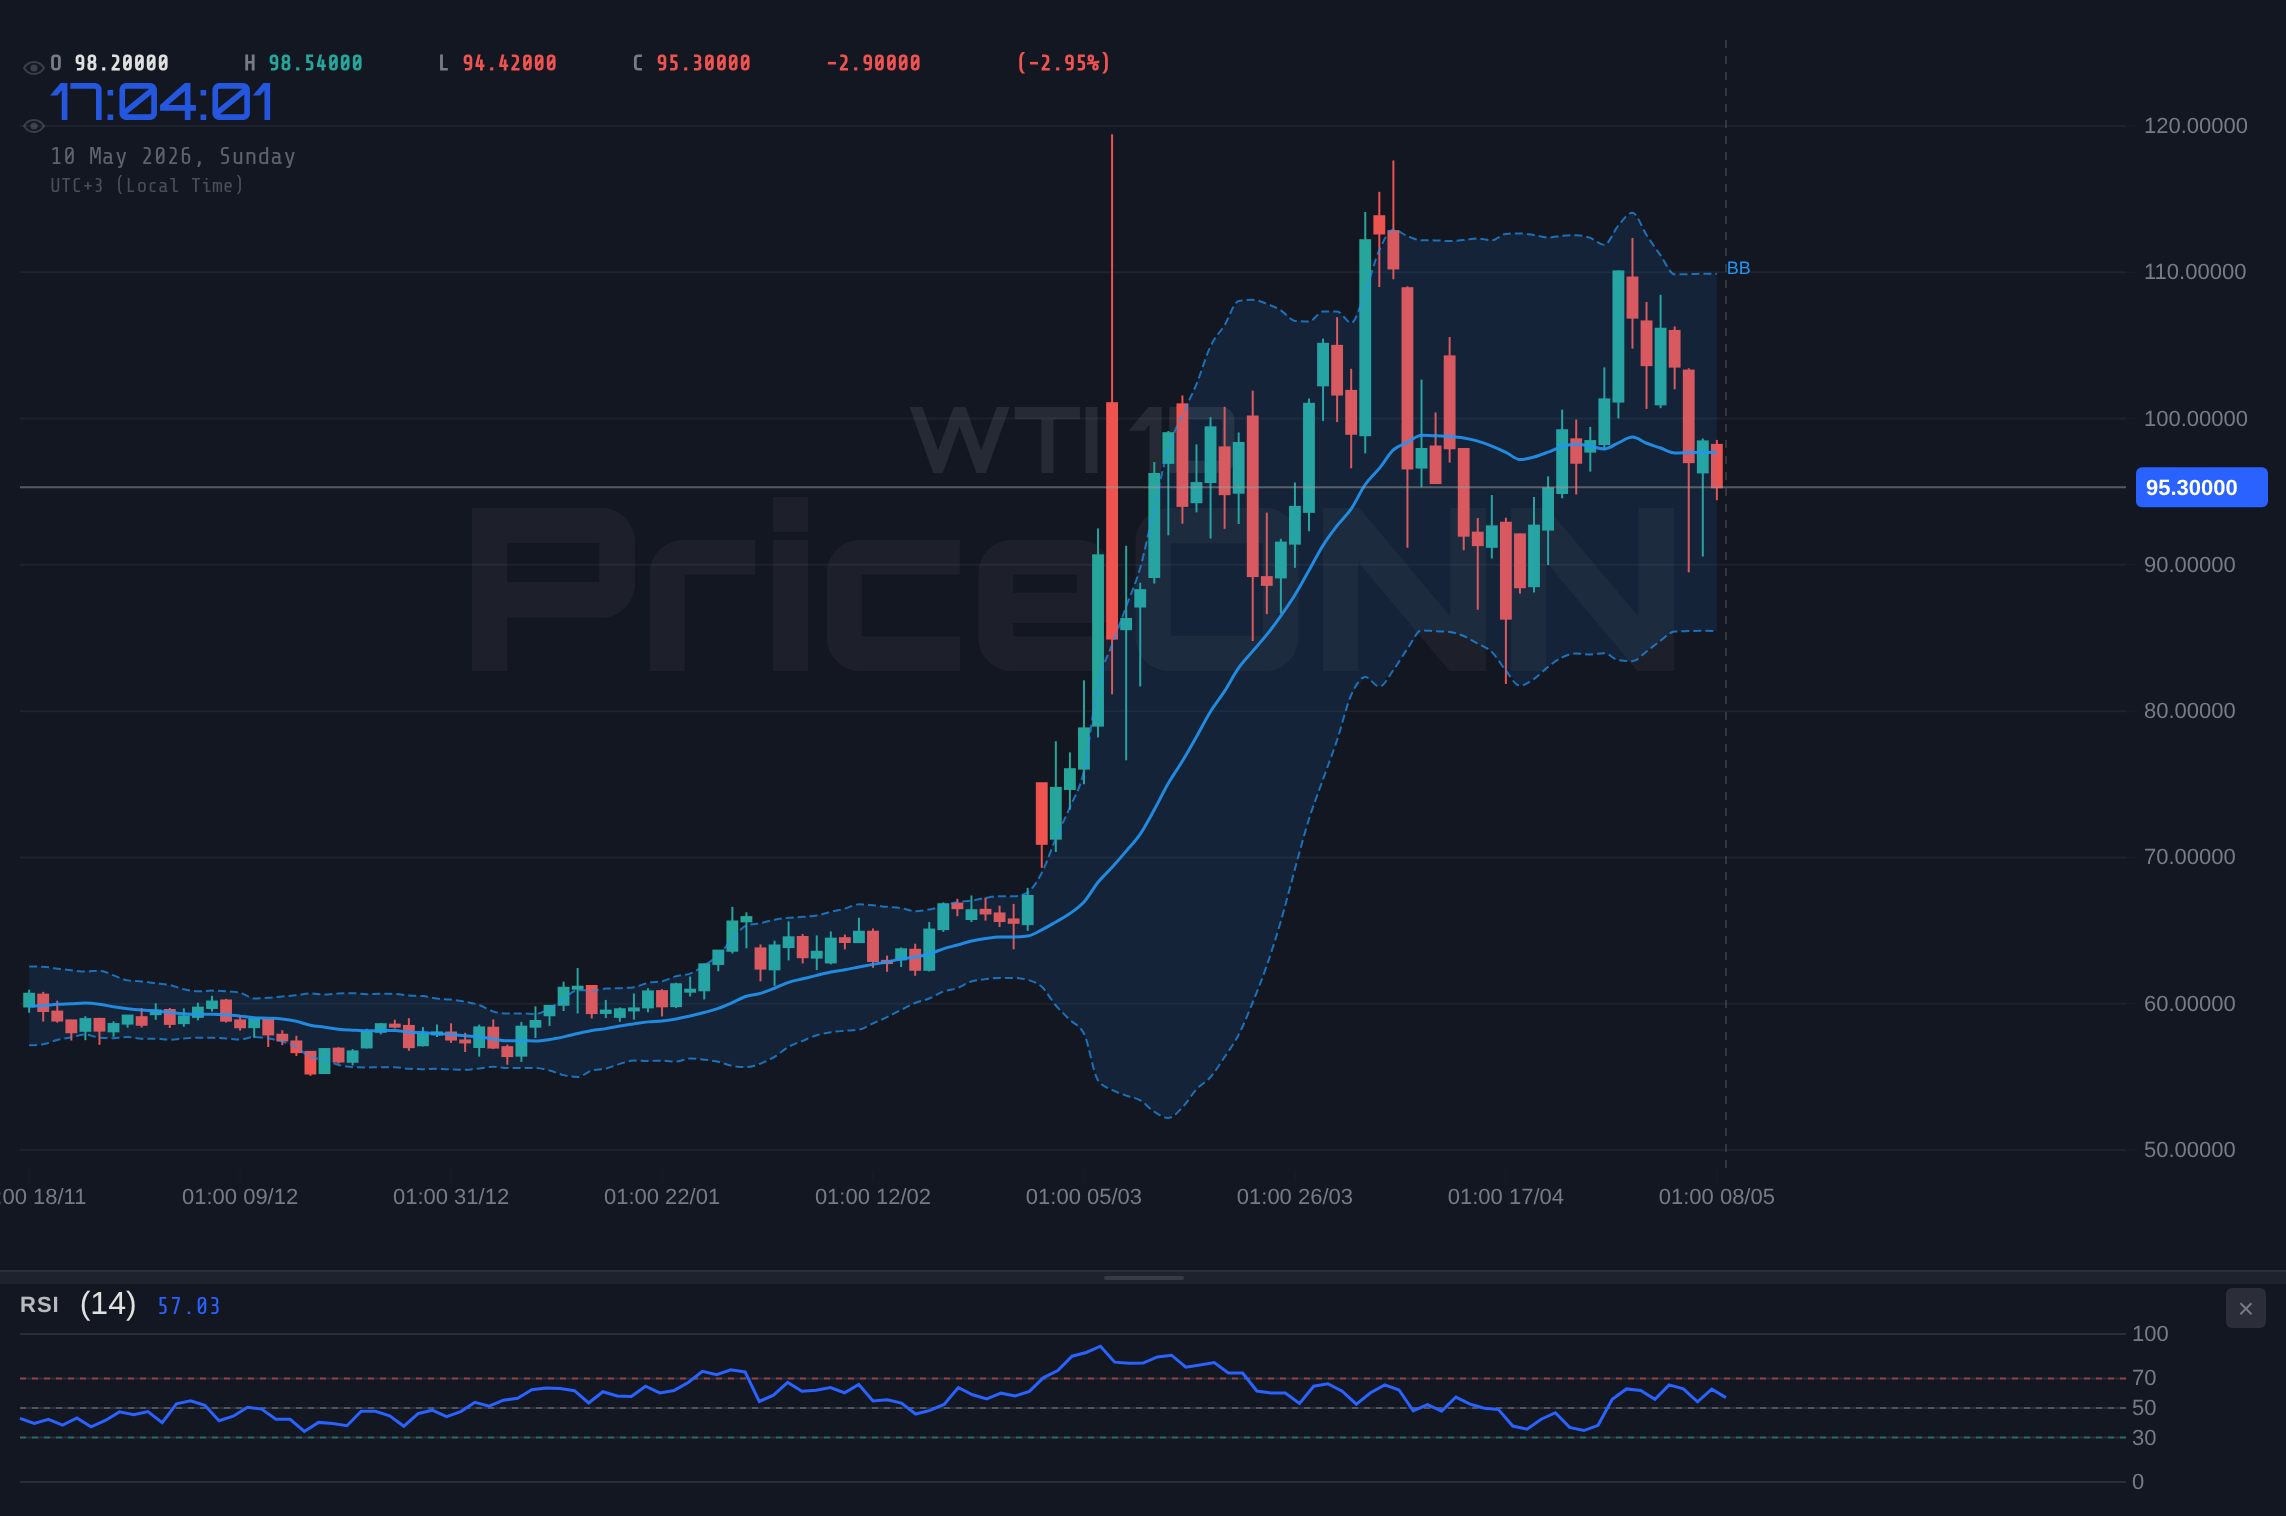
WTI Crude Oil mirrors Brent's bearish leaning. The daily RSI is 47.3, and the 4-hour RSI is 40.9, both suggesting weakness. The daily MACD histogram is negative, indicating bearish pressure. The primary support to watch is the Pivot at 95.88. A decisive break below this level could lead to tests of S1 (93.13) and S2 (87.81). Resistance is expected at R1 (101.20), followed by R2 (103.95). The 38.2% Fibonacci retracement at 98.64 is a critical intermediate level. Supply concerns and global demand forecasts, potentially influenced by inflation readings, will be key factors.
Bitcoin is showing a mixed sentiment. While the daily RSI is at 64.8 and the 4-hour RSI at 59.4 suggest bullish momentum, the weekly sentiment is neutral (RSI 49.7). The daily MACD histogram is positive, but the weekly is also neutral. There is an active buy signal from the daily timeframe. Key resistance lies at R1 (81,223), with the potential to test R2 (81,637) and R3 (82,192). Support is expected at the Pivot (80,668), followed by S1 (80,254) and S2 (79,699). The 50% Fibonacci retracement at 73,926 is a significant level to the downside. Regulatory news and broader market risk appetite will be crucial for Bitcoin's performance.
Ethereum presents a more complex picture. The daily RSI is 53.6, indicating a neutral stance, while the 4-hour RSI is slightly stronger at 54.4. However, the weekly sentiment is bearish (RSI 43.9), and the daily MACD histogram is negative. Despite a buy signal on the 1-hour and 4-hour charts, the longer-term outlook appears cautious. Key resistance will be at R1 (2,343.10), followed by R2 (2,359.22) and R3 (2,382.10). Support is expected at the Pivot (2,320.22), with subsequent levels at S1 (2,304.10) and S2 (2,281.22). The 50% Fibonacci retracement at 2,198.79 remains a significant support level. Sentiment in the broader crypto market and any developments in the Ethereum ecosystem will be key.
The S&P 500 is showing conflicting signals. The daily RSI is 45.4, indicating a bearish bias, while the 1-hour and 4-hour RSIs are stronger at 71.0 and 62.8 respectively, suggesting short-term bullishness. The daily MACD histogram is negative. Key resistance will be at R1 (6,605), with a potential push towards R2 (6,686) and R3 (6,833). Support is expected at the Pivot (6,458), followed by S1 (6,377) and S2 (6,231). The 38.2% Fibonacci retracement at 6,579 is a critical level. The ongoing AI rally faces potential challenges from rising inflation expectations and geopolitical risks.
The Nasdaq 100 shows an extremely bullish technical setup on shorter timeframes, with daily RSI at 83.0 and 1-hour RSI at 83.9, both in overbought territory. The MACD histogram is strongly positive across daily and weekly charts. However, this extreme bullishness might be vulnerable to a correction, especially if inflation data surprises to the upside. Key resistance is at R1 (28,755), with potential to reach R2 (28,986) and R3 (29,147). Support is located at the Pivot (28,594), followed by S1 (28,363) and S2 (28,203). The 50% Fibonacci retracement at 26,026 is a significant level further down. The AI narrative continues to drive this index, but market-wide risk sentiment will be crucial.
The Dow Jones Industrial Average presents a bullish outlook, with a daily RSI of 59.6 and a positive MACD histogram. The 1-hour and 4-hour charts also show buying pressure. Key resistance is at R1 (49,942), followed by R2 (50,350) and R3 (50,583). Support is expected at the Pivot (49,709), with subsequent levels at S1 (49,301) and S2 (49,068). The 38.2% Fibonacci retracement at 48,089 is a significant support level. The index could benefit from a rotation out of purely growth-focused tech stocks.
Resistance
Price
R3
50,583
R2
50,350
R1
49,942
Pivot
49,709
Support
Price
S1
49,301
S2
49,068
S3
48,660
Fib 38.2%
48,089
Economic Calendar Preview
U.S. Consumer Price Index (CPI) YoY - Tue, May 12 12:30 UTC
Forecast: 3.3% | Previous: 3.3%
Scenario
Condition
Expected Impact
Better than expected
Actual > 3.3%
USD strengthens as higher inflation may imply a more hawkish Fed stance; risk assets could face pressure.
In line with forecast
Actual ≈ 3.3%
Neutral reaction, as markets have likely priced in this outcome. Focus may shift to core CPI or Fed commentary.
Worse than expected
Actual < 3.3%
USD weakens as lower inflation could lead to expectations of earlier Fed rate cuts; risk assets may benefit.
U.S. Core Consumer Price Index (CPI) MoM - Tue, May 12 12:30 UTC
Forecast: 0.2% | Previous: 0.2%
Scenario
Condition
Expected Impact
Better than expected
Actual > 0.2%
USD strengthens, reinforcing the possibility of a hawkish Fed; potential negative for equities and gold.
In line with forecast
Actual ≈ 0.2%
Limited market impact, as this outcome is largely anticipated. Focus will remain on the headline CPI and Fed policy signals.
Worse than expected
Actual < 0.2%
USD weakens, as a cooler core inflation reading could increase expectations for Fed easing; supportive for risk assets.
U.S. Producer Price Index (PPI) MoM - Wed, May 13 12:30 UTC
Forecast: 0.5% | Previous: 0.5%
Scenario
Condition
Expected Impact
Better than expected
Actual > 0.5%
USD may see a modest strengthening, with potential inflationary pressures signaling a less dovish Fed.
In line with forecast
Actual ≈ 0.5%
Limited immediate impact, as this level is expected. Market participants will look for confirmation from CPI data.
Worse than expected
Actual < 0.5%
USD could weaken, suggesting moderating inflationary pressures, which might support expectations for Fed rate adjustments.
U.K. Monthly Gross Domestic Product (GDP) 3M/ - Thu, May 14 06:00 UTC
Forecast: 0.5% | Previous: 0.5%
Scenario
Condition
Expected Impact
Better than expected
Actual > 0.5%
GBP strengthens, indicating robust economic activity and potentially supporting a less dovish Bank of England stance.
In line with forecast
Actual ≈ 0.5%
Neutral reaction for GBP, as the market digests expected growth figures.
Worse than expected
Actual < 0.5%
GBP weakens, signaling economic slowdown and potentially increasing pressure for the Bank of England to consider easing measures.
Weekly Trading Bias
Equities: Cautiously optimistic, with the AI narrative providing a strong tailwind for tech, but inflation data poses a significant risk. A hawkish CPI surprise could trigger a risk-off move. Forex: Bullish on EUR/USD and GBP/USD due to perceived USD weakness. USD/JPY remains volatile with mixed signals. Precious Metals: Bullish bias, especially if US inflation proves sticky, supporting gold and silver as inflation hedges. Energy: Bearish bias for Brent and WTI, given the current technical setup and potential demand concerns, though geopolitical factors remain a wildcard. Cryptocurrencies: Mixed, with Bitcoin showing resilience but facing resistance, while Ethereum's longer-term outlook appears more cautious. The overall risk sentiment, heavily influenced by US inflation data, will dictate direction.
Disclaimer: This content is for informational and educational purposes only and does not constitute investment advice, financial recommendation, or an offer to buy or sell any financial instrument. Past performance does not guarantee future results. Always do your own research and consult a licensed financial advisor before making investment decisions.
Track markets in real-time
AI-powered analysis, technical indicators and real-time price data.
We are looking for writers who produce market analysis, macro commentary, and data-driven content. Reach readers in 10 languages through our multilingual publishing platform.