Weekly Market Outlook - Week 18 (April 27, 2026 – May 1, 2026): Fed Decision Looms, Inflation Data in Focus
Week 18 (April 27, 2026 – May 1, 2026) market outlook: The Federal Reserve's interest rate decision and key inflation data will shape market direction. Explore technical levels, economic calendar events, and trading biases for major assets.
Weekly Market Outlook: April 27, 2026 – May 1, 2026 (Week 18)
Executive Summary
The upcoming trading week, April 27 to May 1, 2026, will be dominated by key central bank actions and inflation data. Traders will be closely monitoring the Federal Reserve's interest rate decision and US inflation figures for directional cues. The US Dollar faces potential headwinds if the Fed signals a dovish shift, while risk assets like equities and cryptocurrencies could see renewed upside if inflation moderates. Gold will remain sensitive to interest rate expectations and geopolitical undercurrents.
The US Dollar Index (DXY) is currently positioned at 98.226, with a predominantly Sell sentiment across multiple timeframes (1H:Sell, 4H:Sell, 1D:Sell), driven by a RSI(14) of 37.8 in the 1H and 49.9 in the 4H. The MACD histogram is negative on 1H and 4H, suggesting bearish momentum. However, the weekly sentiment remains SELL with a strength of 90%, indicating that the broader trend might still be challenged. Key levels to watch include resistance at R1=98.720 and support at S1=98.300. A break below the pivot point of 98.480 could signal further downside, with the 61.8% Fibonacci retracement at 97.970 as a significant support target. Conversely, a sustained move above 98.720 would negate the short-term bearish outlook.
EUR/USD is trading at 1.17213, exhibiting a strong Buy sentiment across all observed timeframes (1H:Buy, 4H:Buy, 1D:Buy). The RSI(14) is in the bullish zone on the 1H (62.5) and neutral on 4H (48.9) and 1D (54.5). The Stochastic Oscillator shows overbought conditions on the 1H (%K=86.2), suggesting a potential for a short-term pullback, but the overall weekly sentiment is firmly Buy with 85% strength. Key resistance is at R1=1.17093, with the pivot at 1.16889. A decisive break above R1 could propel the pair towards R2 at 1.17363. Support is located at S1=1.16619.
GBP/USD is currently priced at 1.35355, showing a robust Buy signal across all timeframes (1H:Buy, 4H:Buy, 1D:Buy). The 1H RSI(14) at 73.4 indicates overbought conditions, and the Stochastic %K at 95.2 reinforces this. Despite potential short-term consolidation, the overall weekly sentiment is strongly Buy (84% strength). The immediate resistance lies at R1=1.35059, with the pivot at 1.34762. A push above R1 could target R2 at 1.35468. The primary support is seen at S1=1.34353.
USD/JPY is trading at 159.33, displaying mixed signals. While the 1H and 4H exhibit a Sell sentiment (1H:Sell, 4H:Sell), the Daily timeframe shows a Buy signal (1D:Buy). The RSI(14) is 37.6 on 1H, suggesting weakness, but climbing to 53.7 on the daily. The weekly sentiment is Buy with 71% strength, indicating a potential for a rebound. Key resistance is at R1=159.90, and the pivot is at 159.60. A break above R1 could lead to further upside, targeting R2 at 160.14. Support is found at S1=159.36.
AUD/USD is positioned at 0.71508, with a consistent Buy sentiment across all timeframes (1H:Buy, 4H:Buy, 1D:Buy). The RSI(14) is strong on 1H (58.8) and 1D (60.3), indicating bullish momentum. The weekly sentiment is firmly Buy with 88% strength. The immediate resistance is at R1=0.71583, with the pivot at 0.71342. A breakout above R1 could target R2 at 0.71897. Support is situated at S1=0.71028.
NZD/USD is trading at 0.58808, showing a predominantly Buy signal on daily and weekly charts (1D:Buy, 1W:Buy), but with a neutral signal on 4H (4H:Neutral) and a buy on 1H. The RSI(14) is 61.0 on 1H and 54.5 on 1D, supporting a bullish bias. The weekly sentiment is Buy with 82% strength. Key resistance is at R1=0.58934, with the pivot at 0.58663. A move above R1 could target R2 at 0.59358. Support is found at S1=0.58239.
Gold is currently trading at 4,708.05. The technical indicators present a mixed picture: the 1H shows a Buy signal, while the 4H and 1D indicate Sell (4H:Sell, 1D:Sell). The RSI(14) is in neutral territory across timeframes (44.1-50.2). The weekly sentiment is Sell with 85% strength, suggesting potential downside pressure. Key resistance is at R1=4,743.72, with the pivot at 4,703.93. A break above R1 could test R2 at 4,793.41. Support is critical at S1=4,654.24, with the 50% Fibonacci retracement at 4,758.92 acting as a significant level.
Silver is trading at 75.647, with a predominantly Sell sentiment on the 1H and 4H (1H:Sell, 4H:Sell), but a Buy signal on the 1D (1D:Buy). The RSI(14) is below 50 across all timeframes (41.5-48.8), indicating bearish momentum. The weekly sentiment is Sell with 81% strength. Immediate resistance is at R1=77.740, and the pivot point is 75.970. A break below S1=73.620 could lead to further declines, targeting S2 at 71.850. The 50% Fibonacci level at 78.650 will be a key area to watch.
Brent crude is at 106.05, showing a strong Buy sentiment across all observed timeframes (1H:Buy, 4H:Buy, 1D:Buy). The RSI(14) is in bullish territory on 1H (56.3) and 4H (63.2), with a strong weekly sentiment of Buy at 88% strength. Immediate resistance is at R1=109.02, with the pivot at 105.53. A decisive move above R1 could target R2 at 111.26. Support is situated at S1=103.29.
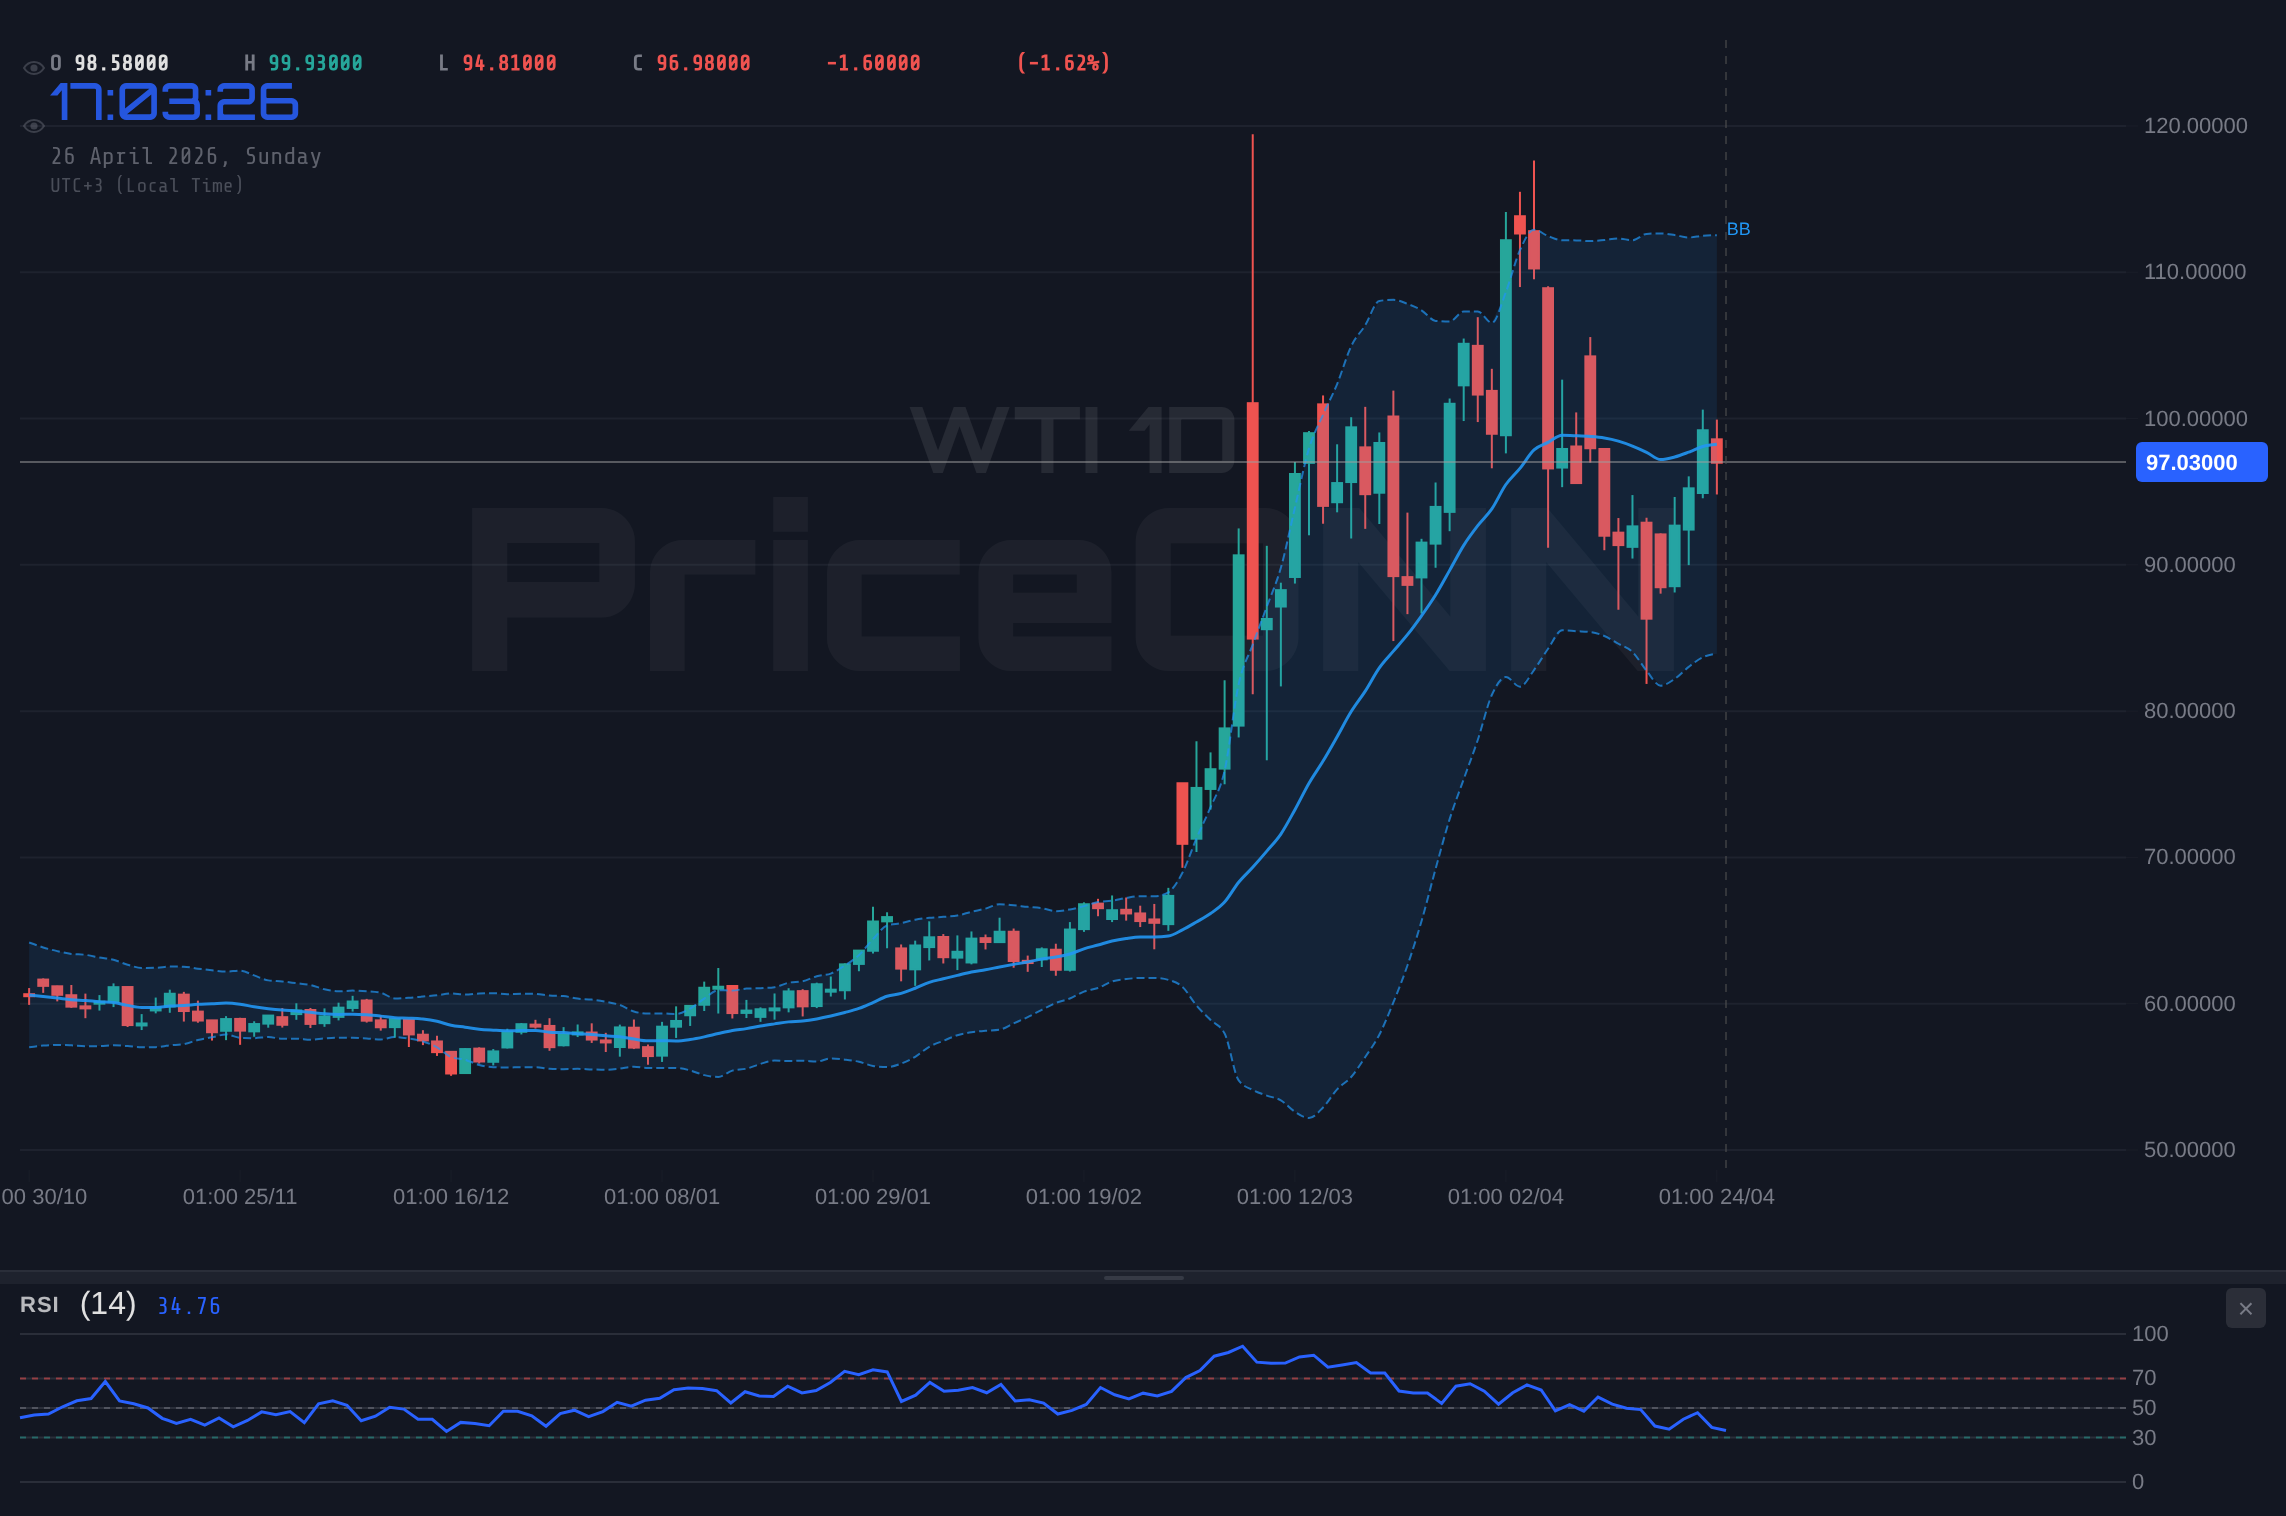
WTI crude is trading at 97.03, presenting mixed signals. The 1H shows a Sell sentiment (1H:Sell), while 4H and 1D indicate Buy (4H:Buy, 1D:Buy). The RSI(14) is in neutral territory on 1H (48.6) but bullish on 4H (56.6) and 1D (53.4). The weekly sentiment is Buy with 77% strength. Key resistance is at R1=101.69, with the pivot at 98.12. A break above R1 could target R2 at 104.18. Support is found at S1=95.63.
Bitcoin is currently priced at 77,961, exhibiting a strong Buy sentiment across all observed timeframes (1H:Buy, 4H:Buy, 1D:Buy). The RSI(14) is in the bullish zone on 1D (63.9), and Stochastics are showing bullish momentum. The weekly sentiment is firmly Buy with 87% strength. Key resistance is at R1=77,866, with the pivot at 77,505. A decisive breakout above R1 could propel BTC towards R2 at 78,251. Support is located at S1=77,120.
Ethereum is trading at 2,333.80, showing a strong Buy signal on 1H and 4H (1H:Buy, 4H:Buy), with a mixed signal on 1D (1D:Buy). The RSI(14) is in neutral territory on 1H (63.5) and 1D (56.0). The weekly sentiment is Buy with 91% strength. Immediate resistance is at R1=2,324.63, with the pivot at 2,311.55. A sustained move above R1 could target R2 at 2,338.49. Support is found at S1=2,297.69.
The S&P 500 is currently at 6,573, exhibiting a mixed sentiment. The 1H and 4H show a Buy signal (1H:Buy, 4H:Buy), while the 1D indicates Sell (1D:Sell). The RSI(14) is 71.0 on 1H, suggesting overbought conditions, but is neutral at 45.4 on the daily. The weekly sentiment is Buy with 83% strength. Key resistance is at R1=6,605, with the pivot at 6,458. A move above R1 could test R2 at 6,686. Support is critical at S1=6,377.
The Nasdaq 100 is trading at 27,303, with a strong Buy sentiment across all observed timeframes (1H:Buy, 4H:Buy, 1D:Buy). The RSI(14) is in overbought territory on 1H (72.6), 4H (73.1), and 1D (76.1). The weekly sentiment is strongly Buy with 88% strength. Immediate resistance is at R1=27,020, with the pivot at 26,778. A sustained breakout above R1 could target R2 at 27,247. Support is found at S1=26,551.
The Dow Jones 30 is at 49,244, showing a predominantly Buy sentiment on Daily and Weekly charts (1D:Buy, 1W:Buy), with a neutral signal on 4H (4H:Neutral) and a buy on 1H (1H:Buy). The RSI(14) is in bullish territory on 1D (65.5). The weekly sentiment is strongly Buy with 91% strength. Key resistance is at R1=49,532, with the pivot at 49,197. A move above R1 could target R2 at 49,856. Support is situated at S1=48,873.
Resistance
Price
R3
50,191
R2
49,856
R1
49,532
Pivot
49,197
Support
Price
S1
48,873
S2
48,538
S3
48,214
Fib 61.8%
47,949
Economic Calendar Preview
Fed Interest Rate Decision - Wed, Apr 29 18:00 UTC
Forecast: - | Previous: 3.75%
Scenario
Condition
Expected Impact
No Change in Rates
Actual = 3.75%
USD may see muted reaction initially; market focus will shift to forward guidance for clues on future policy direction. Equities and risk assets could benefit from sustained accommodative policy expectations.
Dovish Tilt (Hint of Cuts)
Fed signals potential rate cuts sooner than expected, possibly due to easing inflation or growth concerns.
USD likely to weaken significantly as markets price in lower yields. EUR/USD and GBP/USD could surge. Gold may find upward momentum.
Hawkish Stance (Higher for Longer)
Fed maintains a firm stance on inflation, suggesting rates will stay higher for longer, or even hinting at potential hikes.
USD likely to strengthen as markets price in higher yields. Bonds may sell off. Risk assets could face pressure.
Germany Consumer Price Index (CPI) YoY - Wed, Apr 29 12:00 UTC
Forecast: - | Previous: 2.7%
Scenario
Condition
Expected Impact
Inflation Higher than Previous
Actual > 2.7%
EUR could weaken as it may increase pressure on the ECB to consider tighter monetary policy sooner, potentially dampening economic growth prospects.
In Line with Previous
Actual ≈ 2.7%
EUR may see a neutral reaction, with attention turning to other economic indicators and central bank commentary.
Inflation Lower than Previous
Actual < 2.7%
EUR could strengthen as it might ease concerns about inflationary pressures, potentially allowing for a more accommodative monetary stance from the ECB in the future.
Eurozone Consumer Price Index (CPI) YoY - Thu, Apr 30 09:00 UTC
Forecast: - | Previous: 2.6%
Scenario
Condition
Expected Impact
Inflation Higher than Previous
Actual > 2.6%
EUR could weaken as it may signal persistent inflationary pressures, potentially leading to a more cautious stance from the ECB regarding monetary easing.
In Line with Previous
Actual ≈ 2.6%
EUR may experience a neutral reaction, with market participants likely to focus on the Fed decision and other key economic data releases.
Inflation Lower than Previous
Actual < 2.6%
EUR could strengthen as it might suggest that inflationary pressures are abating, potentially giving the ECB more room to consider monetary policy easing.
Japan Industrial Production MoM - Wed, Apr 29 23:50 UTC
Forecast: - | Previous: -2%
Scenario
Condition
Expected Impact
Production Improves Significantly
Actual > 0% (and notably positive)
JPY could strengthen as it would indicate a recovery in Japan's industrial output, boosting confidence in the Japanese economy.
Production Shows Slight Improvement or Stagnation
Actual ≈ -2% to 0%
JPY may see a muted reaction, as the data would suggest a slow or uncertain recovery in industrial activity.
Production Declines Further
Actual < -2%
JPY could weaken as a further contraction in industrial production would signal ongoing economic weakness in Japan.
Weekly Trading Bias
The upcoming week presents a complex interplay of monetary policy expectations and inflation data. A generally bullish bias is suggested for risk assets like Nasdaq 100, S&P 500, Dow Jones, BTC, and ETH, contingent on the Fed's stance and inflation readings. Forex majors EUR/USD and GBP/USD are expected to find strength if the USD weakens. USD/JPY's direction will be heavily influenced by yield differentials and BoJ policy signals. Precious metals, particularly Gold, will be sensitive to shifts in real interest rates and geopolitical sentiment. Energy markets are expected to remain volatile, influenced by supply concerns and global demand outlook. Overall risk appetite will be a key determinant of market direction.
Disclaimer: This content is for informational and educational purposes only and does not constitute investment advice, financial recommendation, or an offer to buy or sell any financial instrument. Past performance does not guarantee future results. Always do your own research and consult a licensed financial advisor before making investment decisions.
Track markets in real-time
AI-powered analysis, technical indicators and real-time price data.
We are looking for writers who produce market analysis, macro commentary, and data-driven content. Reach readers in 10 languages through our multilingual publishing platform.