Weekly Market Outlook - Week 19 (May 4, 2026 – May 8, 2026): Key Economic Data, Risk Appetite Shifts, and Major Market Levels
Week 19 (May 4, 2026 – May 8, 2026) market outlook: Key economic data releases from the US and Europe, shifting risk appetite, and crucial levels in forex, commodities, crypto, and indices.
Weekly Market Outlook: May 4, 2026 – May 8, 2026 (Week 19)
Executive Summary
The upcoming trading week, May 4-8, 2026, will be shaped by a series of crucial economic data releases, particularly from the United States and Europe. Traders will be closely monitoring Manufacturing and Services PMI figures, U.S. housing data, and employment indicators for insights into economic momentum. Shifting risk appetite will likely influence currency pairs and commodity prices, with the US Dollar potentially facing further pressure if risk sentiment continues to build. Key levels in major indices like the S&P 500 and Nasdaq 100, alongside movements in Gold and Oil, will be critical for short-term direction.
The US Dollar Index (DXY) closed the week near 97.940, showing a marginal daily gain. Technical indicators present a mixed but leaning negative picture for the upcoming week. The 1-hour RSI is in overbought territory at 53.2, while the 4-hour and Daily RSIs are below 50, at 43.5 and 44.1 respectively, suggesting potential underlying weakness. The 1-hour Stochastics are overbought (94.3 %K), but the 4-hour is oversold (17.8 %K), indicating short-term fluctuations. The MACD histogram on the 1-hour is positive (+0.04), but on the 4-hour and Daily, it is negative (-0.08, -0.01), signaling a lack of clear trend. ADX remains low at 1.0 across all timeframes, indicating weak directional momentum. A sustained move below the Pivot at 98.130 could signal further downside, targeting support levels.
EUR/USD is positioned at 1.17180, with mixed signals across timeframes. The Daily RSI at 53.6 suggests a slight bullish bias, supported by the Daily MACD histogram being neutral (0.00) and a strong Buy signal from the 1D and 1W timeframes. However, the 1-hour RSI (43.0) and Stochastics (%K at 7.0) indicate short-term selling pressure. The Stochastic %K on the 4-hour (82.7) and 1-week (72.6) are in overbought territory, suggesting potential upward momentum might be capped. Key resistance looms at R1 (1.17620), while a break below the Pivot (1.17081) could open the door to S1 (1.16754). The upcoming Eurozone Manufacturing PMI data on Monday will be a key driver.
GBP/USD is trading around 1.35700. The Daily RSI (58.7) and Weekly RSI (56.7) indicate a moderate bullish sentiment. The 4-hour and Daily MACD histograms are flat, but the overall signal strength across longer timeframes is strongly bullish (8/0/0 on 1D, 7/0/0 on 1W). The 1-hour RSI (42.7) and Stochastics (%K at 5.4) show short-term weakness. However, the 4-hour Stoch %K (85.1) and 1-week %K (79.9) are in overbought territory. Price action will be closely watched around the Pivot (1.35551). A break above R1 (1.36572) could signal further upside, while a fall below the Pivot might test S1 (1.34994).
USD/JPY is currently at 157.05. The Daily RSI (39.6) and MACD histogram (-0.27) suggest bearish pressure, reinforced by strong Sell signals on the 4H and 1D charts. The 1-hour RSI (50.1) is neutral, and Stochastics are mixed, with the 1H showing overbought conditions (88.4 %K) and the 4H showing oversold (23.2 %K). The longer-term weekly sentiment is also leaning bearish (3/4/0), contradicting the short-term 1H buy signal. Price action will be critical around the Pivot (157.61). A move below S1 (154.49) would be a significant bearish development, while a sustained push above R1 (159.67) could alter the outlook.
AUD/USD is trading at 0.71992. The Daily RSI (61.3) and Weekly RSI (68.4) are in bullish territory, supported by strong Buy signals on both timeframes. The 4-hour Stochastics (%K at 89.9) are nearing overbought conditions, while the 1-hour RSI (58.5) is also firm. The overall sentiment is strongly bullish. The key level to watch will be the Pivot at 0.71700. A sustained break above R1 (0.72319) could indicate further appreciation, targeting R2 (0.72642). Conversely, a dip below the Pivot might see price test S1 (0.71377).
NZD/USD is hovering around 0.58971. The Daily RSI (54.7) and Weekly RSI (53.2) suggest a neutral to slightly bullish stance. The 4-hour and Daily charts show strong Buy signals, reinforced by the 1-hour RSI (52.8). The 4-hour Stochastics (%K at 86.8) are in overbought territory, potentially limiting near-term upside. The pair will be watching the Pivot at 0.58772. A move above R1 (0.59398) could lead to further gains, while failure to hold the Pivot might see price retest S1 (0.58450).
Gold is trading near 4,616.89. The Daily RSI (42.9) indicates bearish momentum, and the MACD histogram (-10.98) also points lower. This contrasts with the 1-hour RSI (52.9) and Stochastics (%K at 63.0), which suggest some short-term buying interest. The Weekly sentiment is mixed but leans towards a BUY signal. Key support is found at the 50% Fibonacci retracement level at 4,758.92 and the Pivot at 4,602.55. A decisive break below the Pivot could see prices fall towards S1 (4,558.32), while a recovery above R1 (4,665.95) might initiate a move towards R2 (4,710.18).
Silver is currently at 75.417. The Daily RSI (48.9) suggests neutral to slightly bearish momentum, with the MACD histogram (-0.20) also indicating a lack of strong direction. However, the 1-hour RSI (61.8) and Stochastics (%K at 68.4) show some short-term buying strength. Longer-term, the Weekly sentiment leans positive. The Pivot at 72.920 will be a key level. A move above R1 (74.660) could see prices challenge R2 (75.620), while a failure to hold the Pivot might lead to a test of S1 (71.960).
BRENT Crude is trading at 114.11, having experienced a notable daily decline. The Daily RSI (61.9) remains in bullish territory, but the 1-hour RSI (43.5) suggests short-term weakness. The MACD histogram on the Daily is positive (+1.32), indicating underlying upward momentum, though the 1-hour is negative (-0.31). Stochastics on the Daily (87.1 %K) are in overbought territory, potentially signaling a pause or pullback. The Pivot at 116.61 will be a crucial level. A break below S1 (112.73) could signal further downside, while holding above the Pivot might see a retest of R1 (120.67).
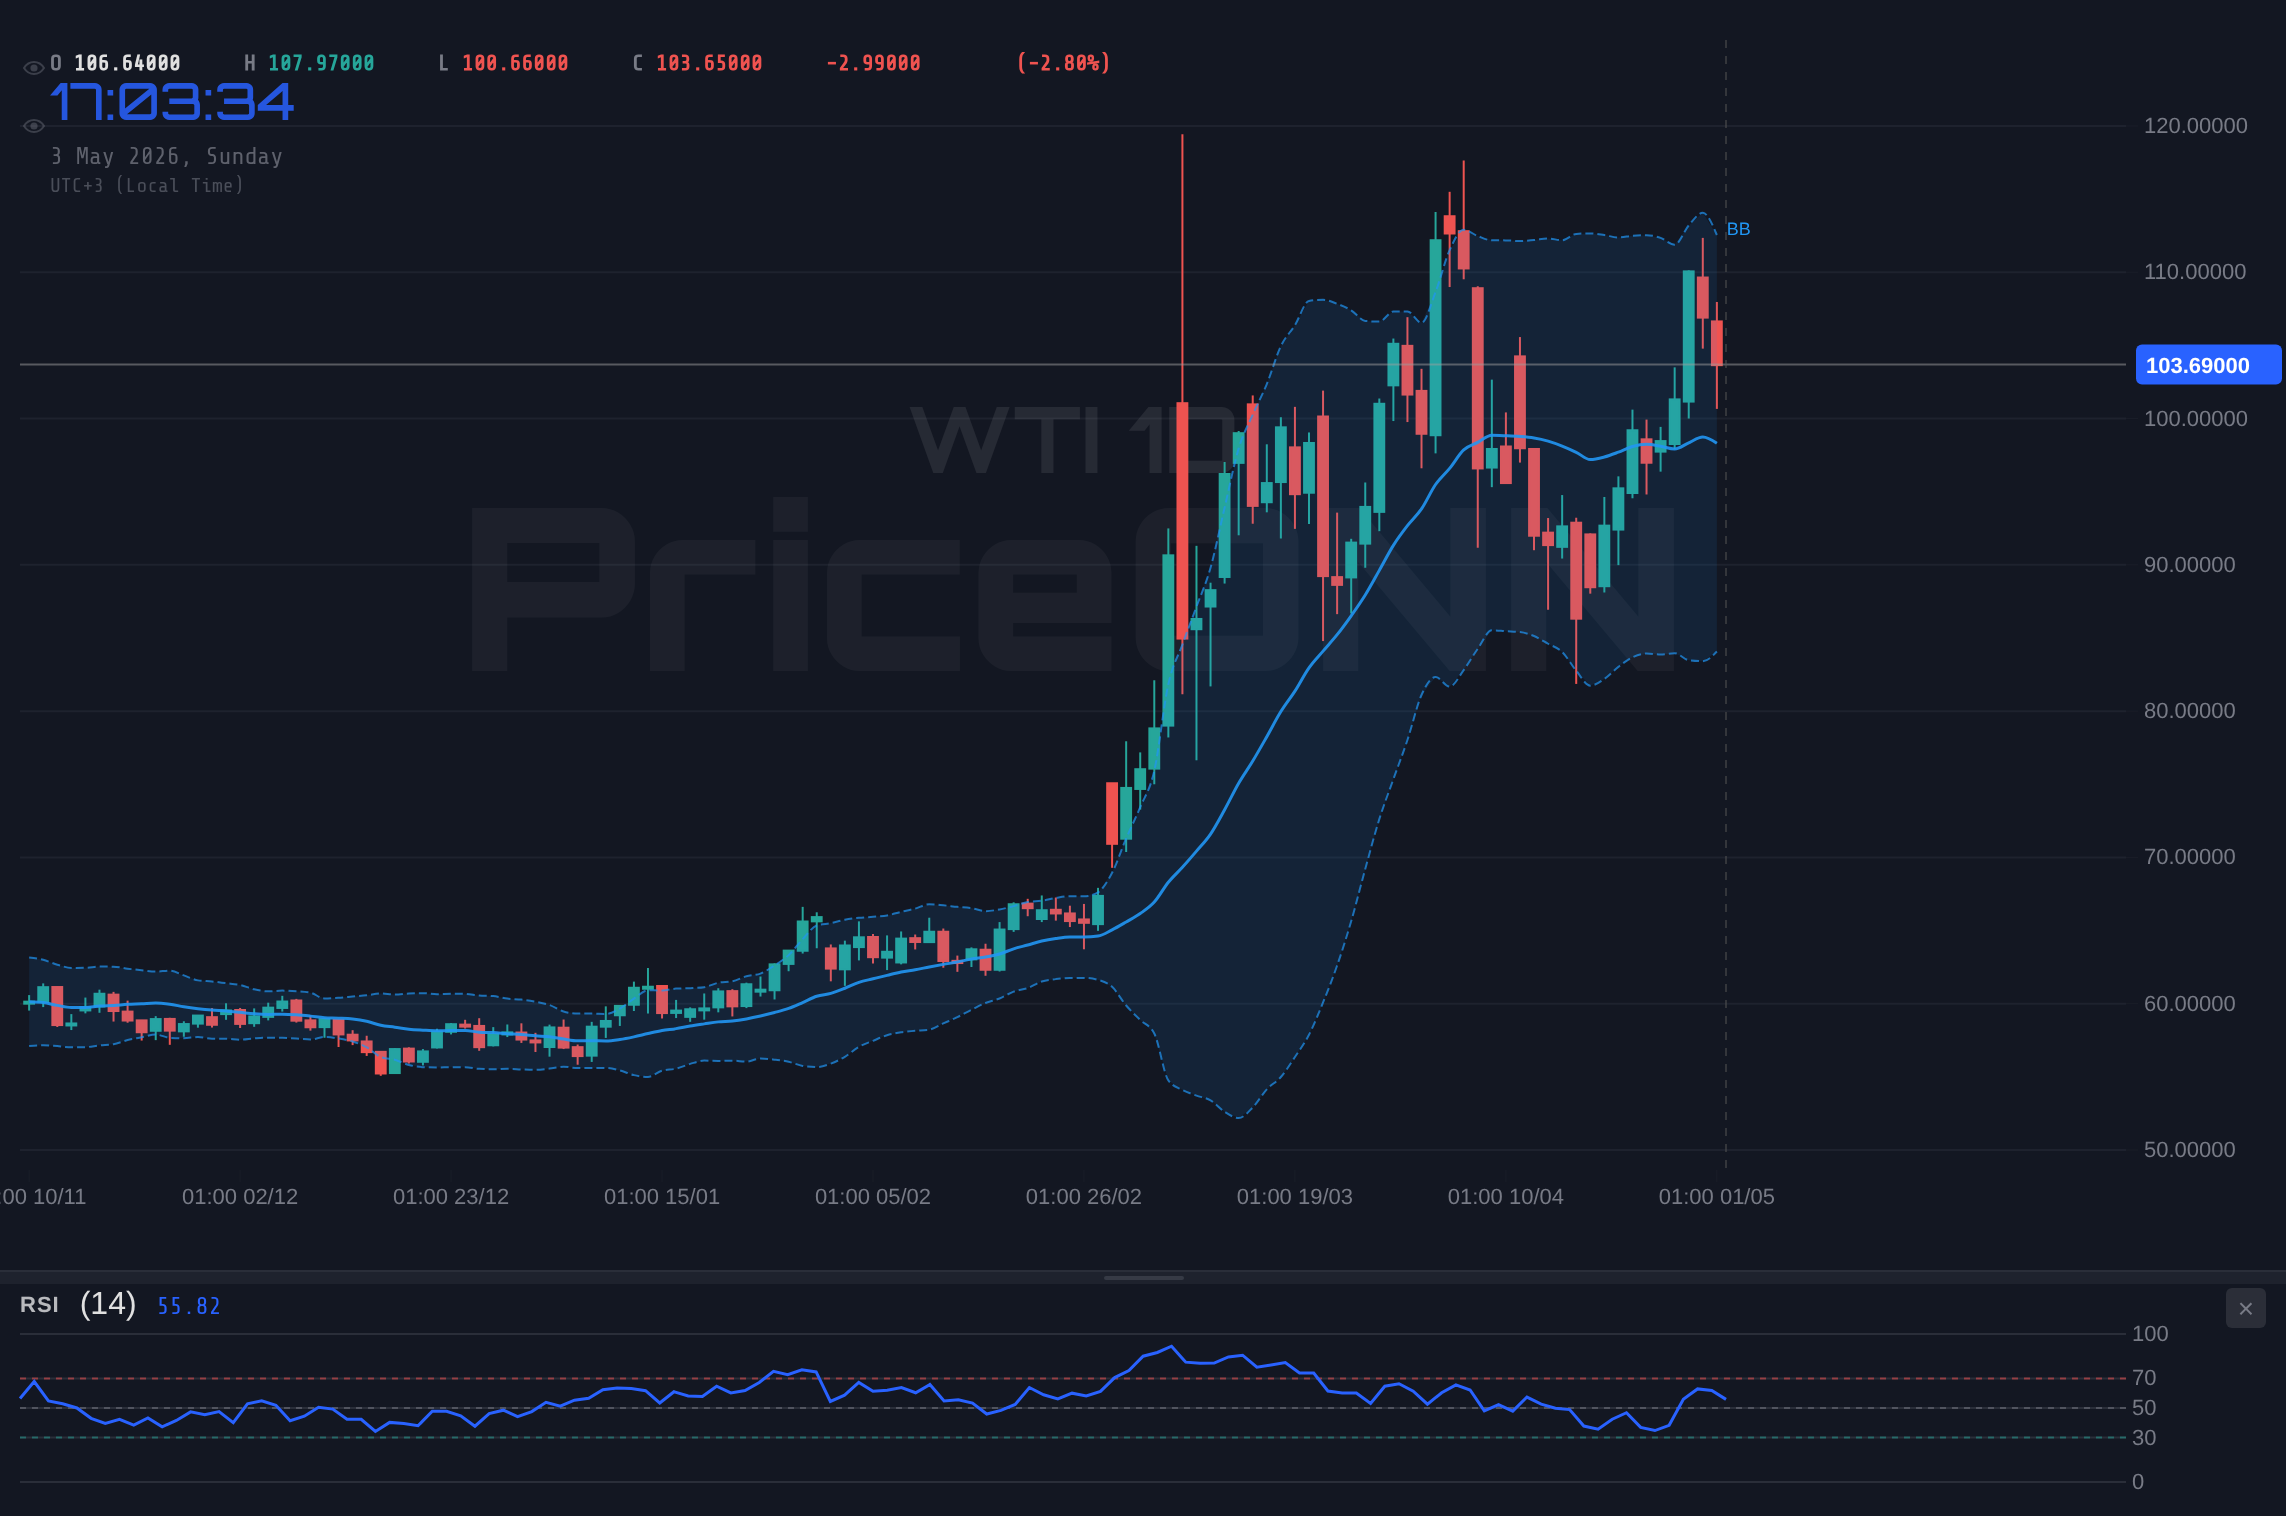
WTI Crude is positioned at 103.69, also showing a significant daily drop. Similar to BRENT, the Daily RSI (56.9) is in a positive zone, while the 1-hour RSI (40.5) indicates short-term selling pressure. The Daily MACD histogram (+0.76) is positive, but the 1-hour is negative (-0.21). Daily Stochastics (%K at 80.5) are in overbought territory. The Pivot at 108.01 is a key level to monitor. A failure to hold this level could lead to tests of S1 (103.67), while a bounce from current levels might target R1 (111.24).
Bitcoin is trading around 78,686. The Daily RSI (63.1) and Weekly RSI (46.9) present a divergence, with the daily showing strength and the weekly indicating a more neutral to potentially weakening trend. The Daily MACD histogram (-70.18) is negative, while the 1-hour is positive (+21.86). The 1-hour Stochastics (%K at 78.2) are in overbought territory, suggesting potential for a short-term pullback. The Pivot at 78,303 is a critical level. A sustained move above R1 (78,749) could signal a continuation of the recent uptrend, targeting R2 (79,042). Conversely, a break below the Pivot might lead to tests of S1 (78,010).
Ethereum is positioned at 2,321.45. The Daily RSI (54.6) is in bullish territory, but the 1-hour RSI (62.7) shows stronger short-term momentum. The Daily MACD histogram (-10.14) is negative, while the 1-hour is positive (+1.28). Weekly sentiment is mixed (3/4/0). The Stochastics on the 1-hour are overbought (74.8 %K), suggesting potential for consolidation or a minor pullback. The Pivot at 2,300.40 is the immediate focus. A break above R1 (2,319.82) could see prices advance towards R2 (2,330.54). A fall below the Pivot might test S1 (2,289.68).
Resistance
Price
R3
2,349.96
R2
2,330.54
R1
2,319.82
Pivot
2,300.40
Support
Price
S1
2,289.68
S2
2,270.26
S3
2,259.54
Fib 61.8%
2,136.62
Note: An active BUY signal for ETHUSD with 31% strength on the 15-minute timeframe carries into the week.
The S&P 500 is trading at 6,573. The Daily RSI (45.4) suggests bearish momentum, contrasting with the 1-hour RSI (71.0) which is in overbought territory. The MACD histogram on the 1-hour is negative (-0.36), while on the 4-hour it's positive (+27.63). The Weekly sentiment is strongly bearish (1/6/0). The Pivot at 6,458 is a key level. A failure to hold this level could lead to tests of S1 (6,377) and S2 (6,231). A rebound above R1 (6,605) might offer temporary relief, but the longer-term technicals suggest caution.
The Nasdaq 100 is at 27,664. The Daily RSI (75.2) is in overbought territory, indicating strong bullish momentum but also potential for a correction. The 1-hour RSI (60.2) is also firm. The MACD histogram on the Daily is strongly positive (+101.16), supporting the bullish trend. The Weekly sentiment is overwhelmingly bullish (7/0/0). The Pivot at 27,328 is a critical support level. A sustained move above R1 (27,625) could propel prices higher towards R2 (27,787), while a pullback could test the Pivot and potentially S1 (27,165).
The Dow Jones 30 is trading at 49,464. The Daily RSI (61.7) suggests a bullish trend, corroborated by the 4-hour RSI (54.5). The Daily MACD histogram (+44.48) is positive, and the Weekly sentiment is strongly bullish (7/0/0). The 1-hour RSI (41.1) and Stochastics (%K at 9.8) indicate short-term weakness. The Pivot at 49,329 will be a key level to watch. A break above R1 (50,191) could signal further upside, while a fall below the Pivot might test S1 (48,885).
Resistance
Price
R3
51,497
R2
50,635
R1
50,191
Pivot
49,329
Support
Price
S1
48,885
S2
48,023
S3
47,579
Fib 61.8%
46,788
Economic Calendar Preview
Eurozone Manufacturing Purchasing Managers Index (PMI) - Mon, 04 May 08:00 UTC
Forecast: 52.2 | Previous: 52.2
Scenario
Condition
Expected Impact
Better than expected
Actual > 52.2
EUR strengthens - A reading above the forecast would indicate robust manufacturing activity, boosting confidence in the Eurozone economy.
In line with forecast
Actual ≈ 52.2
Neutral reaction
Worse than expected
Actual < 52.2
EUR weakens - A figure below expectations would suggest a slowdown in manufacturing, potentially pressuring the Euro.
U.S. New Home Sales MoM - Tue, 05 May 14:00 UTC
Forecast: 1 | Previous: -17.6
Scenario
Condition
Expected Impact
Better than expected
Actual > 1
USD strengthens - Stronger-than-expected new home sales would indicate a resilient housing market, supporting the US Dollar.
In line with forecast
Actual ≈ 1
Neutral reaction
Worse than expected
Actual < 1
USD weakens - A weaker reading than forecast would signal a slowdown in the housing sector, potentially dampening sentiment towards the US Dollar.
U.S. ISM Non-Manufacturing Purchasing Manager - Tue, 05 May 14:00 UTC
Forecast: 53.8 | Previous: 54
Scenario
Condition
Expected Impact
Better than expected
Actual > 53.8
USD strengthens - A higher ISM Non-Manufacturing PMI indicates expansion in the services sector, supporting the US Dollar.
In line with forecast
Actual ≈ 53.8
Neutral reaction
Worse than expected
Actual < 53.8
USD weakens - A lower reading suggests a contraction or slowdown in the services sector, potentially weakening the US Dollar.
U.S. JOLTS Job Openings - Tue, 05 May 14:00 UTC
Forecast: 6.87 | Previous: 6.882
Scenario
Condition
Expected Impact
Better than expected
Actual > 6.87
USD strengthens - A higher number of job openings suggests a robust labor market, which could support hawkish Fed sentiment and strengthen the USD.
In line with forecast
Actual ≈ 6.87
Neutral reaction
Worse than expected
Actual < 6.87
USD weakens - A lower number of job openings could indicate labor market cooling, potentially leading to a weaker USD.
Weekly Trading Bias
The upcoming week presents a potential for shifting risk sentiment. With key US and European economic data on the horizon, market participants will be assessing the strength of global economies. A continuation of the 'risk-on' sentiment could see the US Dollar under pressure, benefiting commodity currencies and potentially riskier assets. Conversely, any signs of economic slowdown or geopolitical uncertainty could prompt a flight to safety, strengthening the Dollar. Precious metals may see volatility around key support and resistance levels, while energy markets will continue to be influenced by supply/demand dynamics and geopolitical events. Cryptocurrencies, particularly Bitcoin and Ethereum, will likely follow broader market sentiment, with potential for significant moves if key technical levels are breached.
Disclaimer: This content is for informational and educational purposes only and does not constitute investment advice, financial recommendation, or an offer to buy or sell any financial instrument. Past performance does not guarantee future results. Always do your own research and consult a licensed financial advisor before making investment decisions.
Track markets in real-time
AI-powered analysis, technical indicators and real-time price data.
We are looking for writers who produce market analysis, macro commentary, and data-driven content. Reach readers in 10 languages through our multilingual publishing platform.