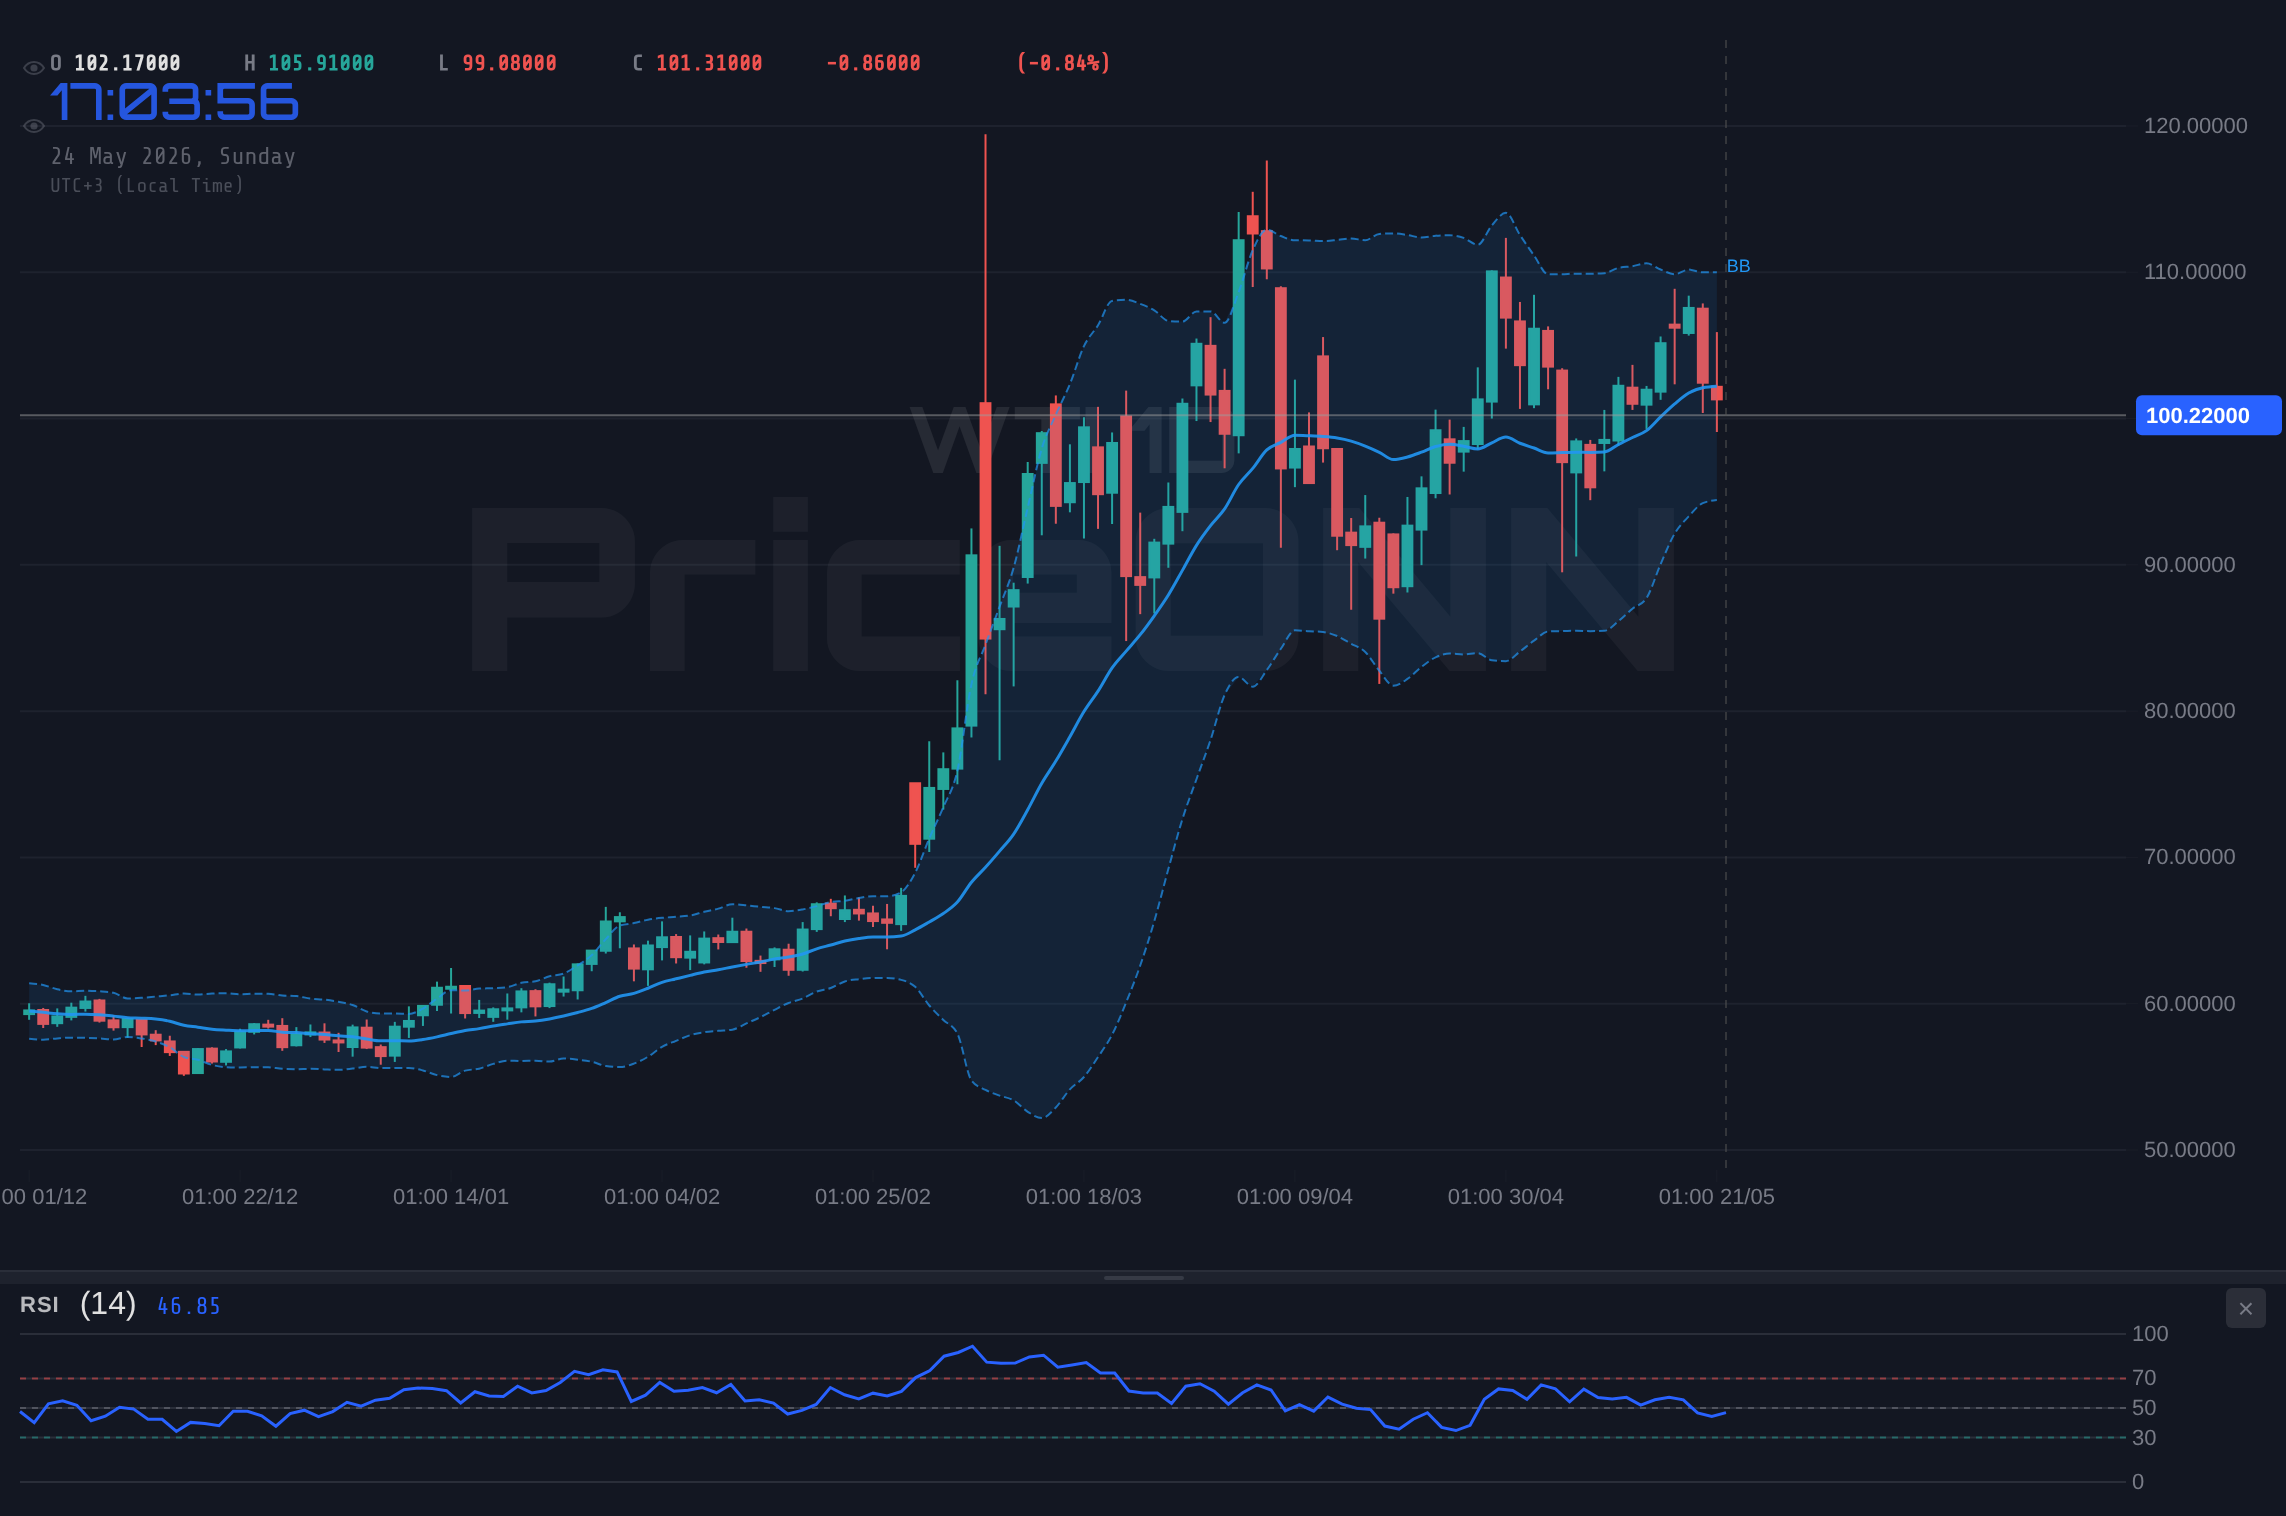
Weekly Market Outlook - Week 22 (May 25, 2026 – May 29, 2026): Key Inflation Data, Central Bank Watch, and Commodity Price Action
Week 22 (May 25, 2026 – May 29, 2026) market outlook: Key inflation data from the US and Canada, central bank watch, and commodity price action. Full technical analysis and scenario planning.
Weekly Market Outlook: May 25, 2026 – May 29, 2026 (Week 22)
Executive Summary
This upcoming week, traders will be closely monitoring key inflation data releases from major economies, which could significantly influence central bank policy expectations. The US Dollar may see volatility based on these figures and ongoing geopolitical developments. Commodity markets, particularly oil, will remain sensitive to supply-side news and geopolitical tensions. Stock indices will look to economic data for direction, while cryptocurrencies could experience fluctuations tied to broader market sentiment and any specific regulatory or adoption news.
The US Dollar Index (DXY) closed the previous week near 99.016, with mixed signals across timeframes. While the 1-hour and 4-hour charts show a predominantly 'SELL' signal, the daily and weekly charts lean towards 'BUY'. This divergence suggests potential choppiness. The RSI(14) on the daily chart is at 56.8, indicating a moderately bullish sentiment, but the Stochastic %K is in overbought territory at 90.7, suggesting a potential pullback. Key resistance will be at the Pivot of 99.160, with R1 at 99.630. Support is expected at S1 (98.920) and S2 (98.450). Any significant deviation in upcoming US economic data, particularly inflation figures, could drive the DXY decisively through these levels.
EUR/USD is trading near 1.15988. The technical indicators present a predominantly bearish outlook, with 'SELL' signals across all four timeframes (1H, 4H, 1D, 1W). The daily RSI(14) at 42.0 suggests bearish momentum, and the Stochastic %K at 14.9 indicates oversold conditions on the daily timeframe, potentially signaling a brief pause or reversal. Key support is situated at the Pivot of 1.16157, followed by S1 at 1.15871. A break below S1 could target S2 at 1.15532. Resistance will be encountered at R1 (1.16496). Upcoming Eurozone inflation data will be crucial; a weaker-than-expected print could pressure the pair lower.
GBP/USD is currently positioned around 1.34322. The technical signals are mixed, with 'BUY' signals on the 1-hour and 4-hour charts, contrasting with 'SELL' signals on the daily and weekly. The daily RSI(14) at 46.6 indicates a slightly bearish bias, while the Stochastic %K at 33.1 on the daily chart suggests room for further downside before reaching oversold conditions. Traders will be watching the Pivot at 1.34217 closely. Support lies at S1 (1.33819) and S2 (1.33323). Resistance is expected at R1 (1.34713). UK inflation data will be a key focus; any upside surprise could bolster the Pound.
USD/JPY is trading near 159.18, showing a consistent 'BUY' sentiment across all timeframes. The daily RSI(14) at 56.7 points to bullish momentum, and the Stochastic %K at 91.9 on the daily timeframe is in overbought territory, signaling a potential for consolidation or a minor pullback. Key resistance is at R1 (159.18), with R2 at 159.46. Support can be found at the Pivot (158.88) and S1 (158.60). Japanese economic data, particularly inflation, and any commentary from the Bank of Japan will be closely watched. A sustained move above R1 could target R2.
AUD/USD is trading around 0.71261. The technical picture is predominantly bearish, with 'SELL' signals on the 1-hour, 4-hour, and daily charts, while the weekly chart shows a 'BUY' signal. The daily RSI(14) at 49.0 is neutral, but the Stochastic %K at 28.8 on the daily suggests potential for further downside. Key support is at the Pivot (0.71355), with S1 at 0.70979. A break below S1 could lead to S2 at 0.70483. Resistance will be faced at R1 (0.71851). Australian inflation data and any related RBA commentary will be critical. A weaker inflation print could weigh on the AUD.
NZD/USD is trading near 0.58463. The technical indicators overwhelmingly point to a bearish bias, with 'SELL' signals on the 1-hour, 4-hour, and daily charts, and a 'SELL' signal on the weekly as well. The daily RSI(14) at 48.7 suggests bearish momentum, and the Stochastic %K at 26.2 on the daily chart indicates it is approaching oversold territory. Key support is located at the Pivot (0.58541), followed by S1 at 0.58214. A break below S1 could target S2 at 0.57813. Resistance is expected at R1 (0.58942). New Zealand economic data releases will be closely monitored for potential impact.
Gold is trading around 4,505.34, with a consistent 'SELL' signal across all timeframes. The daily RSI(14) at 40.0 indicates bearish momentum, and the Stochastic %K at 16.6 on the daily chart suggests it is in oversold territory, potentially foreshadowing a bounce. The 1-hour and 4-hour charts show bearish MACD histograms, reinforcing the short-term weakness. Key support lies at S1 (4,480.56) and S2 (4,417.58). Resistance will be encountered at the Pivot (4,516.43) and R1 (4,579.41). Geopolitical developments, particularly regarding the Strait of Hormuz and Iran cease-fire talks, along with inflation data, will be critical catalysts. A break below S1 could signal further downside.
Silver is trading near 75.369, with 'SELL' signals dominating the 1-hour, 4-hour, and daily timeframes, while the weekly chart shows a 'BUY' signal. The daily RSI(14) at 46.2 indicates mild bearish sentiment, and the Stochastic %K at 11.6 on the daily suggests oversold conditions. The MACD histogram on the daily is negative. Key support levels to watch are S1 (73.760) and S2 (71.700). Resistance will be found at the Pivot (75.170) and R1 (77.230). Industrial demand outlook and broader market risk appetite will influence silver's direction. A sustained push above the Pivot could signal a shift in momentum.
Brent crude is trading around 104.95, with 'SELL' signals prevalent on the 1-hour, 4-hour, and daily charts, though the weekly chart indicates a 'BUY' signal. The daily RSI(14) at 46.9 suggests a bearish lean, while the Stochastic %K at 44.1 on the daily indicates it is approaching oversold territory. The MACD histogram is negative across the shorter timeframes. Key support is at S1 (103.63) and S2 (100.12). Resistance is expected at the Pivot (108.46) and R1 (111.97). Geopolitical tensions in the Middle East and OPEC+ supply decisions will remain primary drivers. A break below S1 could expose lower levels.
WTI crude is trading near 100.22, showing 'SELL' signals on the 1-hour, 4-hour, and daily charts, with a 'BUY' signal on the weekly. The daily RSI(14) at 49.8 is neutral, and the Stochastic %K at 59.7 on the daily suggests it is in mid-range. The MACD histogram is negative on the shorter timeframes. Support is found at S1 (99.26) and S2 (96.08). Resistance lies at the Pivot (103.57) and R1 (106.75). Inventory data and geopolitical stability will be key factors. A decisive move below S1 could signal a deeper correction.
Bitcoin is trading around 76,802, with mixed signals across timeframes: 'NEUTRAL' on 1H, 'BUY' on 4H, and 'SELL' on Daily and Weekly. The daily RSI(14) at 45.2 indicates bearish momentum, while the Stochastic %K at 22.2 on the daily suggests oversold conditions. The MACD histogram is negative on the daily, reinforcing the bearish short-term outlook. Key support levels are S1 (75,137) and S2 (74,288). Resistance will be tested at the Pivot (76,521) and R1 (77,370). Regulatory news and broader risk sentiment will be significant drivers.
Ethereum is trading near 2,109.12, with 'SELL' signals on the 1-hour and daily charts, 'NEUTRAL' on 4-hour, and 'SELL' on the weekly. The daily RSI(14) at 37.8 indicates bearish momentum, and the Stochastic %K at 22.0 on the daily suggests oversold conditions. The MACD histogram is negative on the daily. Key support is at S1 (2,037.78) and S2 (2,004.48). Resistance will be encountered at the Pivot (2,088.51) and R1 (2,121.81). Developments in the DeFi space and broader crypto market sentiment will be influential.
The S&P 500 is trading around 6,573. The technical signals are mixed: 'BUY' on 1H and 4H, 'SELL' on 1D and 1W. The daily RSI(14) at 45.4 indicates bearish momentum, while the Stochastic %K at 43.0 on the daily is in mid-range. The MACD histogram is negative on the daily. Key support is at S1 (6,377) and S2 (6,231). Resistance is at the Pivot (6,458) and R1 (6,605). Upcoming inflation data and corporate earnings will be critical for direction. A break below S1 could signal further downside.
The Nasdaq 100 is trading near 29,459. Technical signals are mixed: 'SELL' on 1H, 'BUY' on 4H, 'NEUTRAL' on 1D, and 'BUY' on 1W. The daily RSI(14) at 70.9 suggests overbought conditions, while the Stochastic %K at 56.6 on the daily is in mid-range. The MACD histogram is negative on the daily. Key support is at S1 (28,828) and S2 (28,471). Resistance will be found at the Pivot (29,066) and R1 (29,424). Tech sector performance and broader market sentiment will drive this index.
The Dow Jones Industrial Average is trading around 50,553. Technical signals are consistently bullish across all timeframes ('BUY' on 1H, 4H, 1D, 1W). The daily RSI(14) at 64.0 indicates strong bullish momentum, and the Stochastic %K at 67.5 on the daily is in bullish territory. The MACD histogram is positive on the daily. Key support is at S1 (49,422) and S2 (48,899). Resistance will be tested at the Pivot (49,745) and R1 (50,268). Continued strength in US economic data could support further upside.
Resistance
Price
R3
51,114
R2
50,591
R1
50,268
Pivot
49,745
Support
Price
S1
49,422
S2
48,899
S3
48,576
Fib 38.2%
48,251
Economic Calendar Preview
US CPI (Wednesday, May 27, 12:30 UTC)
Forecast: 3.2% | Previous: 3.0%
Scenario
Condition
Expected Impact
Better than expected
Actual > 3.2%
USD strengthens as higher inflation could imply a more hawkish Fed stance, potentially delaying rate cuts.
In line with forecast
Actual ≈ 3.2%
Neutral reaction, as the market would have already priced in this outcome. Focus shifts to other catalysts.
Worse than expected
Actual < 3.2%
USD weakens as lower inflation might suggest a less urgent need for the Fed to maintain tight policy, increasing expectations for earlier rate cuts.
Canadian CPI (Thursday, May 28, 12:30 UTC)
Forecast: 2.9% | Previous: 2.8%
Scenario
Condition
Expected Impact
Better than expected
Actual > 2.9%
CAD strengthens as higher inflation could lead to a more cautious Bank of Canada, potentially supporting higher interest rates.
In line with forecast
Actual ≈ 2.9%
Neutral reaction, with CAD likely to remain range-bound unless other significant news emerges.
Worse than expected
Actual < 2.9%
CAD weakens as lower inflation might prompt the Bank of Canada to consider easing monetary policy sooner, potentially pressuring the currency.
US GDP (Friday, May 29, 12:30 UTC)
Forecast: 1.8% | Previous: 1.7%
Scenario
Condition
Expected Impact
Better than expected
Actual > 1.8%
USD strengthens, reflecting a robust US economy which could support higher interest rates and attract capital inflows.
In line with forecast
Actual ≈ 1.8%
Limited impact on USD, as market expectations would be largely met.
Worse than expected
Actual < 1.8%
USD weakens, signaling potential economic slowdown which might increase expectations for Fed rate cuts or stimulus measures.
Weekly Trading Bias
The upcoming week presents a complex trading environment. The overall bias leans towards cautious risk-off sentiment, particularly in the early part of the week, as markets digest key inflation data. The US Dollar may find support if inflation proves sticky, while a cooler reading could trigger a weakening trend. Forex majors will likely exhibit volatility based on their respective domestic inflation figures and central bank expectations. Precious metals may see short-term bounces from oversold levels but face headwinds from potential dollar strength and geopolitical uncertainties impacting oil. Energy markets will remain highly sensitive to Middle Eastern developments and OPEC+ guidance. Cryptocurrencies could experience choppy trading, with BTC and ETH showing mixed short-term signals but longer-term bearish indicators. Stock indices present a divergence, with the Dow Jones showing bullish strength while the S&P 500 and Nasdaq exhibit mixed signals, suggesting selective opportunities rather than broad market rallies.
Disclaimer: This content is for informational and educational purposes only and does not constitute investment advice, financial recommendation, or an offer to buy or sell any financial instrument. Past performance does not guarantee future results. Always do your own research and consult a licensed financial advisor before making investment decisions.
Track markets in real-time
AI-powered analysis, technical indicators and real-time price data.
We are looking for writers who produce market analysis, macro commentary, and data-driven content. Reach readers in 10 languages through our multilingual publishing platform.