Weekly Market Review - Week 21 (May 18, 2026 – May 22, 2026): Risk Assets Rally, Dollar Weakens, Oil Dips
Week 21 (May 18, 2026 – May 22, 2026): Review of a week marked by a rally in risk assets, a weakening US Dollar, and a dip in oil prices. Stocks surged while crypto faced selling pressure.
Weekly Market Review: May 18, 2026 – May 22, 2026 (Week 21)
Executive Summary
The trading week of May 18-22, 2026, saw a notable shift in market sentiment, with risk assets experiencing a broad rally while the US Dollar Index (DXY) weakened. Major stock indices like the S&P 500, Nasdaq 100, and Dow Jones 30 closed the week higher, driven by positive economic data and a more dovish tone from central banks. Precious metals, particularly gold, also found support, climbing to test higher levels. Energy markets, however, faced headwinds, with Brent and WTIcrude oil prices experiencing a dip. Cryptocurrencies like Bitcoin and Ethereum continued their recent downtrend, with significant daily losses registered by Friday's close.
US Dollar & DXY Analysis
The US Dollar Index (DXY) experienced a net decline over the week, closing at 99.028, down 0.37% on Friday alone. Technical indicators across multiple timeframes suggested a weakening dollar. On the Daily timeframe, the RSI stood at 57.0, indicating a bullish trend but showing signs of slowing momentum compared to the Weekly RSI of 53.2. The MACD Histogram on the daily chart was positive at +0.16, suggesting underlying bullish momentum, but the 1-hour and 4-hour MACD Histograms were near zero, signalling a lack of strong conviction. The ADX remained at 1.0 across all observed timeframes, indicating a lack of strong trending power. The DXY's price action during the week saw it struggle to maintain levels above its 20-day SMA of 99.017 on the 1-hour chart and 99.032 on the 4-hour chart, while it remained below the 50-day SMA (98.999) on the 1-hour and 4-hour charts. The price closed below the 1-day Pivot point of 99.160, with key resistance seen at R1=99.630 and R2=99.870. Support was found near the S1=98.920 level.
EUR/USD traded in a tight range for much of the week, ultimately closing near 1.16028 with a daily loss of 0.16%. The pair struggled to gain traction despite some positive sentiment elsewhere. The daily RSI was at 42.0, firmly in bearish territory, supported by the 1-hour RSI of 48.0 and 4-hour RSI of 44.3. The weekly RSI at 48.2 also suggested a lack of upward momentum. MACD histograms across all timeframes were flat or negative, indicating bearish pressure. The Stochastic Oscillator on the daily timeframe showed %K at 14.9 and %D at 15.5, indicating oversold conditions, though this did not translate into sustained buying. The pair hovered below its 20-day SMA of 1.16960 on the daily chart and the 50-day SMA of 1.16497. Key resistance was observed at R1=1.16496, with the Pivot at 1.16157 acting as a near-term barrier. Support was tested near S1=1.15871.
GBP/USD showed resilience, closing the week at 1.34355 with a modest daily gain of 0.03%. The pair found support and traded above its 50-day SMA of 1.34337 on the 4-hour chart. The daily RSI was at 46.6, indicating a bearish bias but showing less weakness than EUR/USD. The 1-hour RSI at 55.9 and 4-hour RSI at 56.2 suggested some intraday buying strength. The weekly RSI stood at 50.1, indicating a neutral to slightly bullish stance. The Stochastic Oscillator on the daily timeframe showed %K at 33.1 and %D at 21.9, suggesting it was moving out of oversold territory. The MACD histogram on the daily was flat, but the 1-hour and 4-hour showed slight positive movement. The pair traded below the daily Pivot of 1.34217 for much of the week, with resistance at R1=1.34713 and support at S1=1.33819.
USD/JPY experienced upward pressure throughout the week, closing at 159.19 with a daily gain of 0.19%. The pair consistently traded above its 20-day SMA of 159.11 on the 1-hour chart and above the 50-day SMA of 158.58 on the 4-hour chart. The daily RSI was at 56.8, indicating a bullish trend, with the 1-hour RSI at 59.0 and 4-hour RSI at 62.3 reinforcing this. The weekly RSI at 57.7 confirmed the bullish sentiment. The Stochastic Oscillator on the daily timeframe showed %K at 92.1 and %D at 92.1, indicating extreme overbought conditions, suggesting a potential for consolidation or pullback. The MACD histogram on the daily was positive at +0.21, but the 1-hour and 4-hour histograms were near zero. The pair successfully broke above the daily Pivot of 158.88 and tested resistance levels, with R1 at 159.18 and R2 at 159.46. Fibonacci resistance was noted at 78.6% at 159.50.
AUD/USD faced selling pressure, closing the week at 0.71296 with a daily loss of 0.25%. The pair traded below its 20-day SMA of 0.71329 on the 1-hour chart and its 50-day SMA of 0.71698 on the 4-hour chart. The daily RSI was at 49.0, indicating a neutral to slightly bearish stance, with the 1-hour RSI at 47.8 and 4-hour RSI at 46.7 reinforcing this. The weekly RSI at 62.3 suggested an underlying bullish trend on longer timeframes, creating a divergence. The Stochastic Oscillator on the daily timeframe showed %K at 28.8 and %D at 38.4, indicating it was moving out of oversold territory but still weak. The MACD histogram on the daily was flat. The pair closed below the daily Pivot of 0.71355, with resistance at R1=0.71851 and support at S1=0.70979. Fibonacci support was noted at 38.2% at 0.71000.
NZD/USD also experienced a downturn, closing the week at 0.58495 with a daily loss of 0.21%. The pair traded below its 20-day SMA of 0.58608 on the 1-hour chart and its 50-day SMA of 0.58800 on the 4-hour chart. The daily RSI was at 48.7, indicating a bearish bias, with the 1-hour RSI at 43.0 and 4-hour RSI at 46.8 reinforcing this. The weekly RSI at 48.9 suggested a lack of bullish conviction. The Stochastic Oscillator on the daily timeframe showed %K at 26.2 and %D at 29.9, indicating it was approaching oversold territory. The MACD histogram on the daily was flat. The pair closed below the daily Pivot of 0.58541, with resistance at R1=0.58942 and support at S1=0.58214. Fibonacci support was noted at 50.0% at 0.58000.
Gold prices saw a slight decline over the week, closing at 4,507.20 with a daily loss of 0.8%. Despite the late week weakness, gold tested higher levels earlier in the week. The daily RSI was at 40.1, indicating bearish momentum, with the 1-hour RSI at 44.3 and 4-hour RSI at 42.0 reinforcing this. The weekly RSI at 48.5 suggested a neutral to slightly bearish long-term outlook. The Stochastic Oscillator on the daily timeframe showed %K at 16.8 and %D at 32.8, indicating oversold conditions and potential for a bounce. Williams%R on the daily was at -83.2, also signalling oversold territory. The pair traded below its 20-day SMA of 4,618.46 and 50-day SMA of 4,677.57. The price struggled to break above the daily Pivot of 4,516.43, with significant resistance at R1=4,579.41 and R2=4,615.28. Key support was identified at S1=4,480.56. The 38.2% Fibonacci retracement level was at 4,516.27, closely aligning with the daily pivot.
Silver mirrored gold's trend, closing the week at 75.463 with a daily loss of 0.46%. The daily RSI was at 46.3, indicating bearish sentiment, with the 1-hour RSI at 44.4 and 4-hour RSI at 43.4 supporting this. The weekly RSI at 52.5 was more neutral. The Stochastic Oscillator on the daily timeframe showed %K at 11.8 and %D at 38.0, indicating oversold conditions. Williams%R on the daily was at -80.9, reinforcing the oversold signal. The pair traded below its 20-day SMA of 77.404 and 50-day SMA of 76.083. The price fell below the daily Pivot of 75.170, testing support levels. Key resistance was seen at R1=77.230, with support at S1=73.760 and S2=71.700. The 50.0% Fibonacci retracement level was at 75.150, close to the daily pivot.
Brent crude oil faced selling pressure during the week, closing at 104.96 with a daily loss of 2.05%. The pair traded below its 20-day SMA of 105.66 on the 1-hour chart and its 50-day SMA of 109.65 on the 4-hour chart. The daily RSI was at 46.9, indicating bearish sentiment, with the 1-hour RSI at 44.1 and 4-hour RSI at 38.2 reinforcing this. The weekly RSI at 62.1 suggested an underlying bullish trend, but short-term indicators pointed downwards. The ADX was at 1.0 across all timeframes, showing a lack of strong trend direction. Bollinger Bands on the daily chart showed the price near the lower band (101.87), indicating potential for mean reversion. The pair closed below the daily Pivot of 108.46, with resistance at R1=111.97 and support at S1=103.63. The 50.0% Fibonacci retracement level was at 103.88.
Resistance
Price
R3
120.31
R2
116.80
R1
111.97
Pivot
108.46
Support
Price
S1
103.63
S2
100.12
S3
95.29
Fib 50.0%
103.88
WTI Crude Oil
WTI crude oil followed a similar pattern to Brent, closing the week at 100.18 with a daily loss of 2.22%. The pair traded below its 20-day SMA of 100.70 on the 1-hour chart and its 50-day SMA of 103.26 on the 4-hour chart. The daily RSI was at 49.8, indicating a neutral to slightly bearish stance, with the 1-hour RSI at 44.9 and 4-hour RSI at 40.8 reinforcing this. The weekly RSI at 61.9 suggested an underlying bullish trend. The ADX was at 1.0 across all timeframes, indicating a lack of strong trend direction. Bollinger Bands on the daily chart showed the price near the lower band (94.33), suggesting potential for a bounce. The pair closed below the daily Pivot of 103.57, with resistance at R1=106.75 and support at S1=99.26. The 50.0% Fibonacci retracement level was at 99.75.
Bitcoin experienced significant selling pressure, closing the week at 75,566 with a daily loss of 2.76%. The cryptocurrency traded well below its 20-day SMA of 76,545 on the 1-hour chart and its 50-day SMA of 77,964 on the 4-hour chart. The daily RSI was at 40.1, indicating bearish momentum, with the 1-hour RSI at 28.4 and 4-hour RSI at 32.1 reinforcing this, placing it in oversold territory. The weekly RSI at 43.9 also suggested a bearish outlook. The Stochastic Oscillator on the daily timeframe showed %K at 18.5 and %D at 16.8, confirming oversold conditions. Williams%R on the daily was at -100.0, indicating extreme oversold conditions. The pair closed well below the daily Pivot of 77,545, with resistance at R1=78,366 and support at S1=76,886. The 50.0% Fibonacci retracement level was at 74,567.
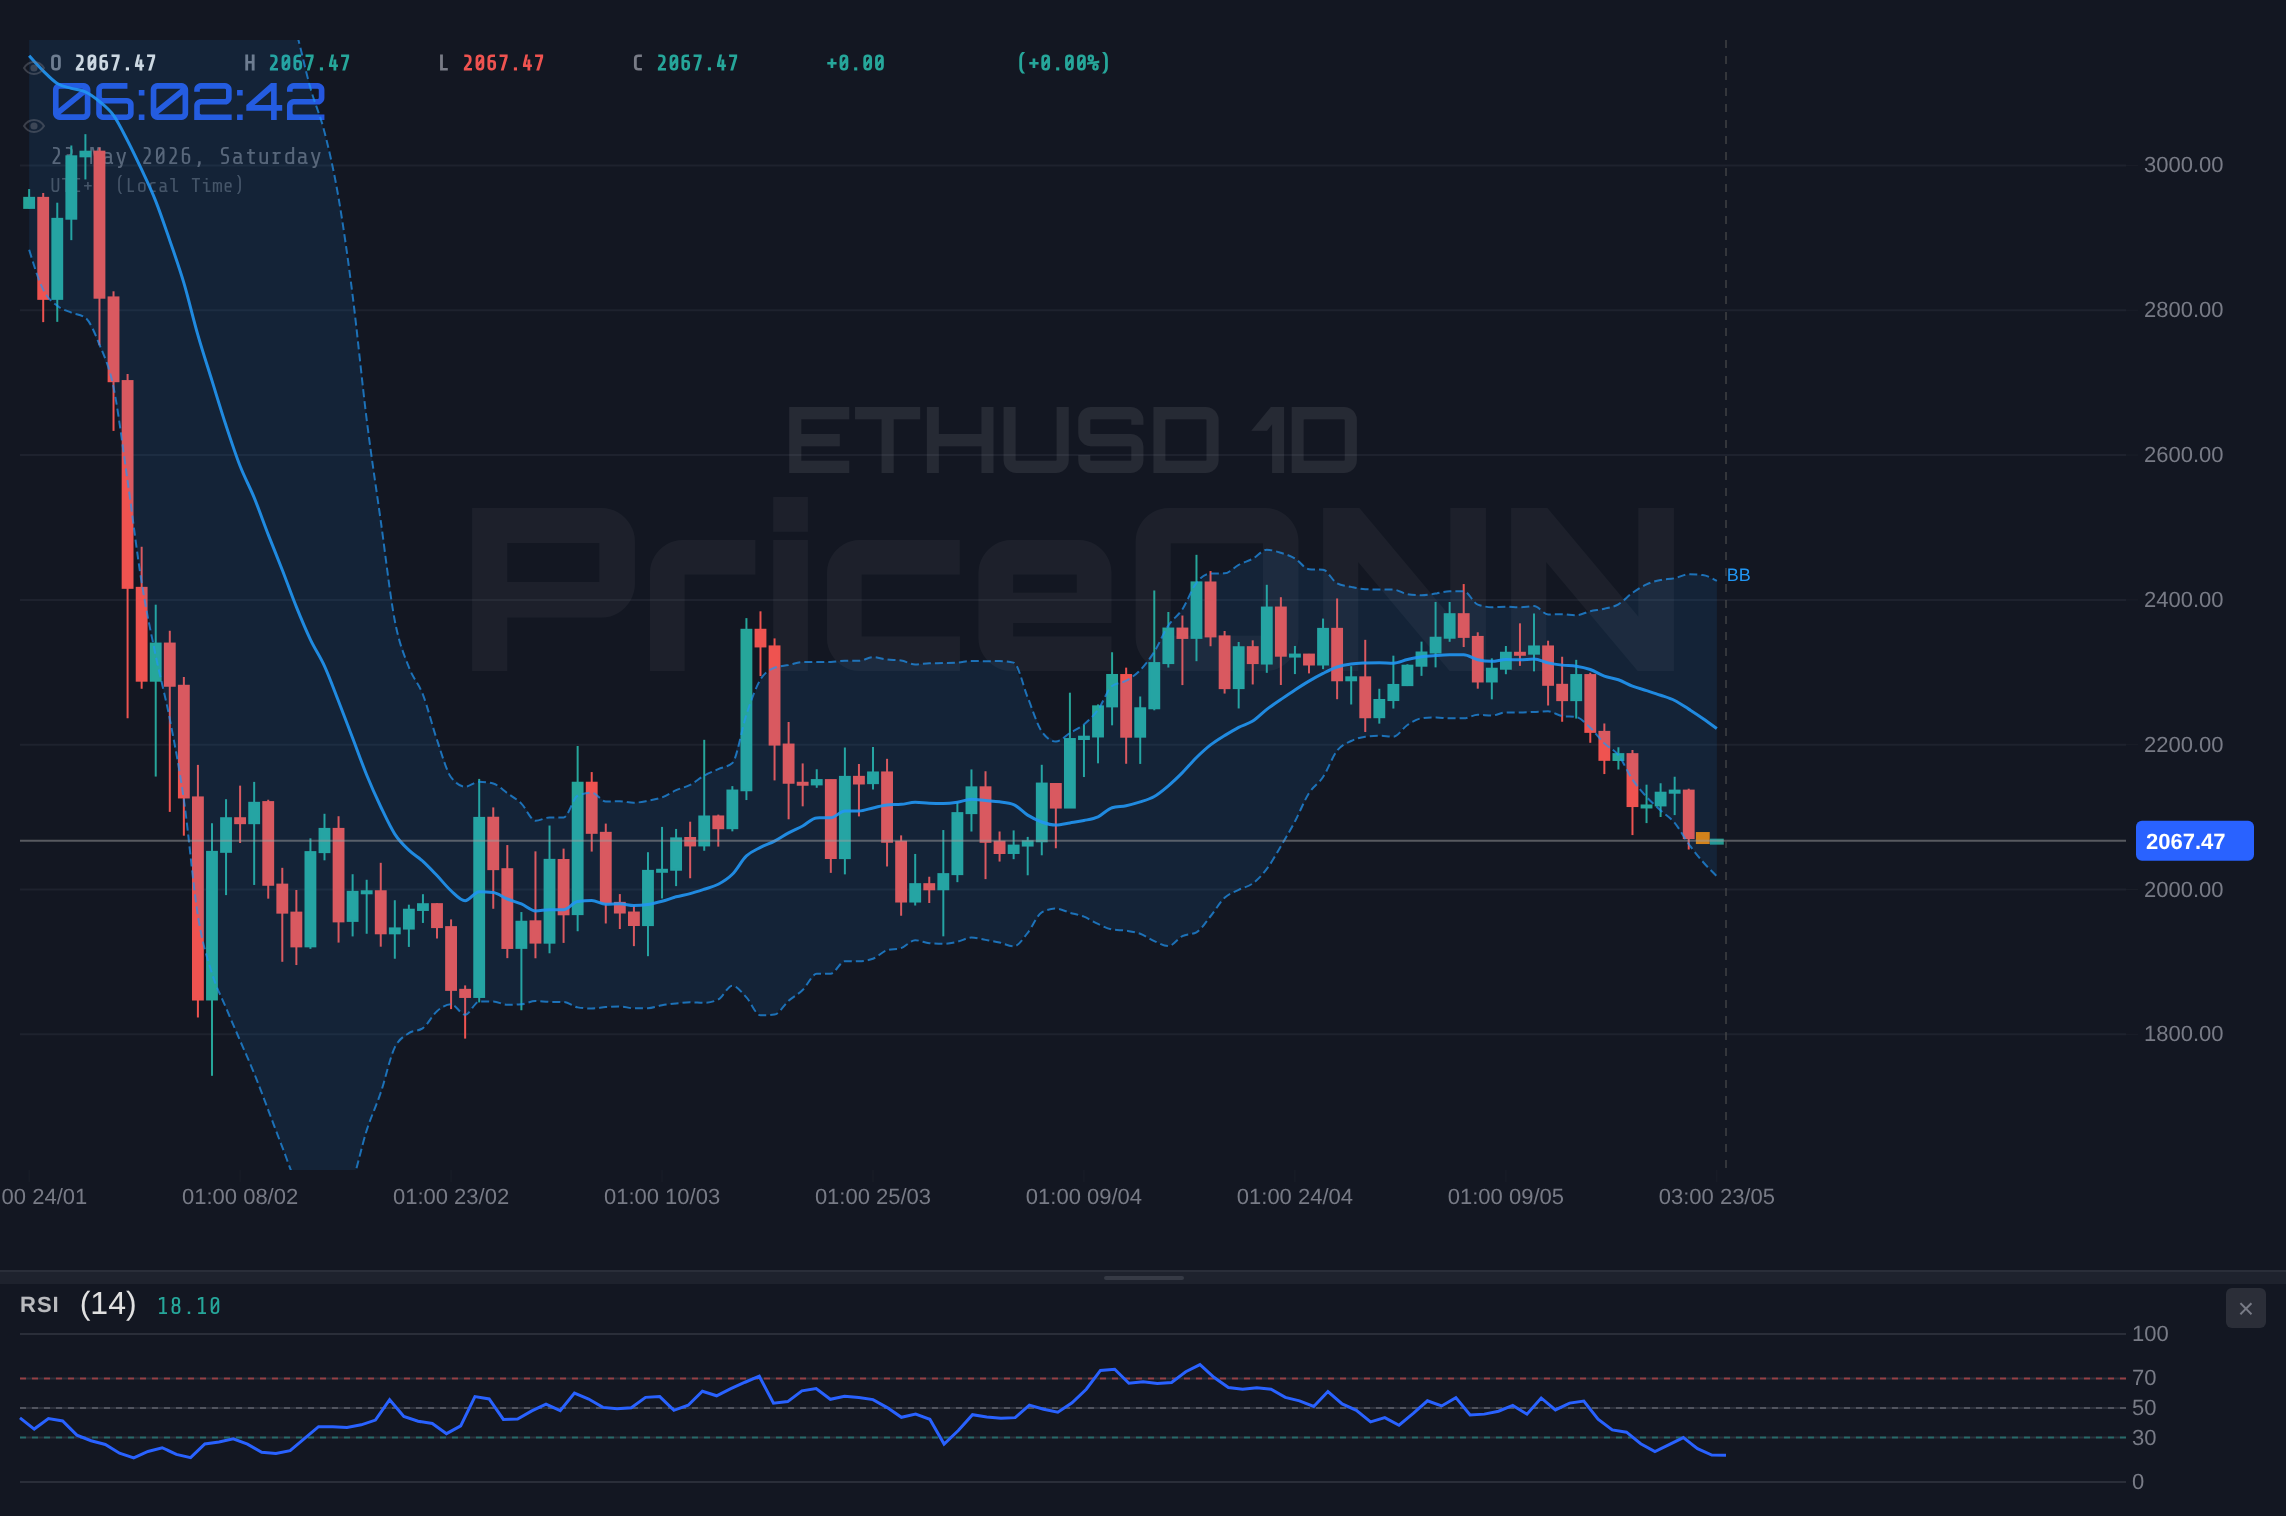
Ethereum followed Bitcoin's downward trend, closing the week at 2,067.39 with a notable daily loss of 3.24%. The cryptocurrency traded below its 20-day SMA of 2,099.43 on the 1-hour chart and its 50-day SMA of 2,159.65 on the 4-hour chart. The daily RSI was at 32.1, firmly in oversold territory, with the 1-hour RSI at 31.4 and 4-hour RSI at 31.1 reinforcing this. The weekly RSI at 38.3 also suggested a bearish outlook. The Stochastic Oscillator on the daily timeframe showed %K at 17.1 and %D at 14.6, confirming oversold conditions. Williams%R on the daily was at -96.3, indicating extreme oversold conditions. The pair closed below the daily Pivot of 2,131.70, with resistance at R1=2,160.65 and support at S1=2,107.65. The 78.6% Fibonacci retracement level was at 2,114.36.
The S&P 500 experienced a strong week, closing at 6,573 with a daily gain of 0.74%. The index traded above its 20-day SMA of 6,527 on the 1-hour chart and its 50-day SMA of 6,508 on the 4-hour chart, indicating bullish momentum. The daily RSI was at 45.4, suggesting bearish momentum on that timeframe, but the 1-hour RSI at 71.0 and 4-hour RSI at 62.8 indicated strong short-term buying interest. The weekly RSI at 45.8 showed a longer-term bearish bias. The Stochastic Oscillator on the daily timeframe showed %K at 43.0 and %D at 29.9, moving out of oversold territory. The pair closed above the daily Pivot of 6,458, with resistance at R1=6,605 and support at S1=6,377. The 38.2% Fibonacci retracement level was at 6,579.
The Nasdaq 100 also posted gains, closing at 29,460 with a daily increase of 0.94%. The index traded above its 20-day SMA of 29,506 on the 1-hour chart and its 50-day SMA of 29,184 on the 4-hour chart. The daily RSI was at 71.0, indicating overbought conditions, with the 1-hour RSI at 50.3 and 4-hour RSI at 59.6 showing mixed sentiment. The weekly RSI at 74.8 confirmed extended bullishness. The Stochastic Oscillator on the daily timeframe showed %K at 56.6 and %D at 68.6, indicating it was in the upper range but not yet overbought. The pair closed above the daily Pivot of 29,066, testing resistance at R1=29,424. Support was found at S1=28,828. The 23.6% Fibonacci retracement level was at 28,050.
The Dow Jones Industrial Average showed strong upward momentum, closing at 50,553 with a daily gain of 1.21%. The index traded above its 20-day SMA of 50,534 on the 1-hour chart and its 50-day SMA of 49,784 on the 4-hour chart. The daily RSI was at 64.0, indicating bullish momentum, with the 1-hour RSI at 56.3 and 4-hour RSI at 66.0 reinforcing this. The weekly RSI at 63.5 confirmed a bullish trend. The Stochastic Oscillator on the daily timeframe showed %K at 67.5 and %D at 60.7, indicating it was in the upper range. The pair closed above the daily Pivot of 49,745, testing resistance at R1=50,268. Support was found at S1=49,422. The 38.2% Fibonacci retracement level was at 48,251.
Resistance
Price
R3
51.114
R2
50.591
R1
50.268
Pivot
49.745
Support
Price
S1
49.422
S2
48.899
S3
48.576
Fib 38.2%
48.251
Economic Calendar Impact
Several key economic events influenced market dynamics during the week ending May 22, 2026. Notably, Canadian inflation data and GDP figures provided crucial insights into the health of the Canadian economy, while German consumer sentiment offered clues about European economic outlook. The market's reaction to these events was mixed, reflecting underlying uncertainties and differing economic trajectories.
Canadian Inflation Data: Headline CPI rose to 2.8% in April, slightly above the forecast of 2.7%. This surprise increase, primarily driven by gasoline prices, put some pressure on CAD initially. However, core measures remained within expectations, suggesting underlying price pressures were contained. The Bank of Canada's reaction function was closely watched, with traders interpreting this as unlikely to trigger immediate policy shifts.
Canadian Q1 GDP: Preliminary estimates suggested Q1 GDP growth turned positive, projected at a rebound of 0.4% compared to a contraction in Q4 2025. This positive surprise offered support to the Canadian Dollar, as it indicated economic resilience. The market priced in a more optimistic outlook for Canada following this data release.
German Consumer Sentiment: German consumer sentiment improved to -29.8 in June, a significant rise from -33.1 in the previous month. This better-than-expected figure, driven by improved expectations for income and economic activity, provided a modest boost to the Euro. It suggested a potential easing of domestic concerns within the Eurozone's largest economy.
Week in Summary
The week of May 18-22, 2026, was characterized by a rotation into risk assets, a weakening US Dollar, and a dip in energy prices. Major stock indices experienced robust gains, driven by positive economic indicators and a generally optimistic market mood. The S&P 500, Nasdaq 100, and Dow Jones 30 all closed the week higher, demonstrating strong buying interest. Precious metals like gold and silver found some footing, although gold ended the week slightly lower after testing higher levels. Energy commodities, Brent and WTI crude oil, succumbed to selling pressure, closing the week in negative territory, possibly influenced by broader market sentiment and inventory concerns. Cryptocurrencies continued their recent slide, with both Bitcoin and Ethereum registering significant losses by Friday, trading deep in oversold territory across multiple timeframes. The US Dollar weakened against a basket of major currencies, with the DXY closing lower as investors sought higher-yielding assets. Key economic data from Canada and Germany provided mixed signals but generally supported a narrative of economic recovery and contained inflation, influencing currency movements. The overall market sentiment shifted towards risk appetite, with traders favouring equities and currencies linked to growth prospects over traditional safe havens or commodities.
Disclaimer: This content is for informational and educational purposes only and does not constitute investment advice, financial recommendation, or an offer to buy or sell any financial instrument. Past performance does not guarantee future results. Always do your own research and consult a licensed financial advisor before making investment decisions.
Track markets in real-time
AI-powered analysis, technical indicators and real-time price data.
We are looking for writers who produce market analysis, macro commentary, and data-driven content. Reach readers in 10 languages through our multilingual publishing platform.