

Weekly Market Review: April 27, 2026 – May 1, 2026 (Week 18)
Executive Summary
The trading week of April 27 to May 1, 2026, concluded with notable shifts across major asset classes. The U.S. Dollar Index (DXY) experienced a decline, closing the week at 97.952, pressured by a below-forecast GDP reading and a dovish shift in market sentiment regarding Fed policy. Gold prices remained resilient, largely holding their ground around the $4,616.48 mark, with weekly fluctuations contained within key Fibonacci levels. Equity markets, particularly the S&P 500 and Nasdaq 100, posted significant gains, driven by strong corporate earnings and a speculative AI boom, closing at 6,573 and 27,664 respectively. The energy sector saw a downturn, with Brent crude falling to $114.19 and WTI to $103.75, influenced by mixed manufacturing data and fluctuating geopolitical tensions. Cryptocurrencies, led by Bitcoin at $78,365 and Ethereum at $2,302.36, continued their upward momentum, buoyed by institutional interest and AI-driven narratives.
U.S. Dollar & DXY Analysis
The U.S. Dollar Index (DXY) presented a mixed technical picture throughout the week, ultimately closing at 97.952, down 0.14% on the daily close. On the 1-hour timeframe, the RSI was 53.7, indicating a slight bullish bias, while the 4-hour RSI at 43.8 suggested a move into bearish territory. The daily RSI stood at 44.1, reinforcing the bearish sentiment. MACD histograms showed a slight positive reading on the 1-hour (0.04) but turned negative on the 4-hour (-0.08) and daily (-0.01) charts, signaling a potential loss of upward momentum. The ADX remained at 1.0 across all timeframes, indicating a lack of strong trend. Bollinger Bands on the daily chart showed the price trading near the lower band (97.300), suggesting potential for a rebound, but the overall sentiment was bearish, particularly on the daily and weekly charts where the Signal was SELL.
| Resistance | Price |
|---|---|
| R3 | 99.620 |
| R2 | 99.220 |
| R1 | 98.520 |
| Pivot | 98.130 |
| Support | Price |
|---|---|
| S1 | 97.420 |
| S2 | 97.030 |
| S3 | 96.320 |
| Fib 61.8% | 98.300 |
Forex Majors Review
The EUR/USD pair concluded the week at 1.17205, experiencing a slight daily decline of 0.07%. Technical indicators presented a predominantly bullish outlook on longer timeframes. The daily RSI was 53.6, and the weekly RSI was 53.2, both situated in neutral-to-bullish territory. The MACD histogram was flat across all observed timeframes, indicating a lack of strong momentum. The Stochastic Oscillator showed an overbought condition on the 4-hour (82.7% K, 84.5% D) but was more neutral on the daily (36.9% K, 25.8% D). ADX values were consistently 1.0, suggesting weak trending conditions. The pair traded near the upper Bollinger Band on the 1-hour and 4-hour charts, but within the bands on the daily. The overall sentiment, based on the aggregated signals and multi-timeframe analysis, leaned towards BUY (78% strength), with the daily and weekly charts strongly favoring this direction.
| Resistance | Price |
|---|---|
| R3 | 1.18486 |
| R2 | 1.17947 |
| R1 | 1.17620 |
| Pivot | 1.17081 |
| Support | Price |
|---|---|
| S1 | 1.16754 |
| S2 | 1.16215 |
| S3 | 1.15888 |
| Fib 61.8% | 1.17000 |
GBP/USD ended the week at 1.35735, reflecting a daily decrease of 0.21%. The pair showed a bullish leaning across longer timeframes. The daily RSI was 58.7, and the weekly RSI was 56.7, both in the upper neutral zone. The MACD histogram was neutral across all timeframes. Stochastic oscillators indicated overbought conditions on the 4-hour (85.1% K, 89.9% D) and weekly (79.9% K, 39.6% D) charts. ADX values remained at 1.0, pointing to a lack of strong trend. The price was trading within the daily Bollinger Bands. The sentiment was strongly BUY (81% strength), with the daily and weekly signals overwhelmingly positive.
| Resistance | Price |
|---|---|
| R3 | 1.38150 |
| R2 | 1.37129 |
| R1 | 1.36572 |
| Pivot | 1.35551 |
| Support | Price |
|---|---|
| S1 | 1.34994 |
| S2 | 1.33973 |
| S3 | 1.33416 |
| Fib 61.8% | 1.33000 |
The USD/JPY pair closed the week at 157.07, marking a daily increase of 0.33%. Technical indicators were mixed, with a bearish leaning on the daily and weekly charts. The daily RSI was 39.8, and the weekly RSI was 52.3, placing the daily in the lower neutral zone and the weekly in the neutral zone. MACD histograms were negative on the 4-hour (-0.26) and daily (-0.27) charts. Stochastic %K was high on the 1-hour (89.5%) and weekly (63.1%), but low on the 4-hour (23.3%), suggesting conflicting signals. ADX was 1.0 across all timeframes. The price was trading below the daily upper Bollinger Band. The overall sentiment favored SELL (76% strength), primarily driven by the daily and weekly signals.
| Resistance | Price |
|---|---|
| R3 | 164.85 |
| R2 | 162.78 |
| R1 | 159.67 |
| Pivot | 157.61 |
| Support | Price |
|---|---|
| S1 | 154.49 |
| S2 | 152.43 |
| S3 | 149.31 |
| Fib 61.8% | 156.56 |
AUD/USD finished the week at 0.72002, showing a marginal daily gain of 0.01%. The pair exhibited a consistently bullish technical profile across all timeframes. Daily RSI was 61.3 and weekly RSI was 68.4, both firmly in bullish territory. MACD histograms were flat but positive. Stochastic oscillators indicated overbought conditions on the 4-hour (89.9% K, 90.0% D) and weekly (86.9% K, 53.2% D) charts. ADX values remained at 1.0, suggesting a lack of strong trend. The price was trading at the upper Bollinger Band on the 1-hour and 4-hour charts. The sentiment was strongly BUY (75% strength), supported by consistent BUY signals across all observed timeframes.
| Resistance | Price |
|---|---|
| R3 | 0.73261 |
| R2 | 0.72642 |
| R1 | 0.72319 |
| Pivot | 0.71700 |
| Support | Price |
|---|---|
| S1 | 0.71377 |
| S2 | 0.70758 |
| S3 | 0.70435 |
| Fib 61.8% | 0.70000 |
NZD/USD closed the week at 0.58987, down 0.15% on the day. Technical indicators suggested a bullish bias, particularly on longer timeframes. The daily RSI was 54.7 and the weekly RSI was 53.2, both in neutral-to-bullish territory. MACD histograms were flat. Stochastic oscillators showed overbought conditions on the 4-hour (86.8% K, 88.8% D) and daily (57.1% K, 53.0% D) charts. ADX was 1.0 across all timeframes. The price was trading near the upper Bollinger Band on the 1-hour and 4-hour charts. The overall sentiment was BUY (76% strength), with strong BUY signals on the 4-hour and daily charts.
| Resistance | Price |
|---|---|
| R3 | 0.60346 |
| R2 | 0.59720 |
| R1 | 0.59398 |
| Pivot | 0.58772 |
| Support | Price |
|---|---|
| S1 | 0.58450 |
| S2 | 0.57824 |
| S3 | 0.57502 |
| Fib 61.8% | 0.59000 |
Precious Metals
XAUUSD (Gold)
Gold prices concluded the week at $4,616.48, showing a modest daily decline of 0.11%. The weekly performance was characterized by consolidation within a tight range, suggesting indecision in the market. The daily RSI was 42.9, indicating a bearish momentum, while the weekly RSI at 52.0 was neutral. MACD histograms were negative on the daily (-11.00) and weekly (-74.85) charts, pointing to downward pressure. Stochastic oscillators showed oversold conditions on the daily (25.5% K, 19.0% D) but were neutral on the weekly (47.0% K, 40.2% D). ADX remained at 1.0 across all timeframes, signifying a lack of trend strength. The price was trading below the daily 20-day SMA (4,716.39) and below the daily upper Bollinger Band (4,874.71). The overall sentiment was mixed, with a slight leaning towards BUY (75% strength) due to strong weekly signals, despite weaker daily indicators.
| Resistance | Price |
|---|---|
| R3 | 4,773.58 |
| R2 | 4,710.18 |
| R1 | 4,665.95 |
| Pivot | 4,602.55 |
| Support | Price |
|---|---|
| S1 | 4,558.32 |
| S2 | 4,494.92 |
| S3 | 4,450.69 |
| Fib 61.8% | 4,914.68 |
Silver closed the week at $75.440, marking a significant daily gain of 2.36%. This upward movement contrasted with gold's slight dip. The daily RSI was 49.0, indicating a neutral stance, while the weekly RSI at 53.1 was in bullish territory. MACD histograms were negative on the daily (-0.20) and weekly (-2.08) charts, suggesting a potential for a trend reversal. Stochastic oscillators showed oversold conditions on the daily (27.5% K, 20.0% D) but were neutral on the weekly (46.3% K, 33.7% D). ADX remained at 1.0 across all timeframes. The price was trading below the daily 20-day SMA (75.910) but above the lower Bollinger Band (70.820). The overall sentiment was BUY (77% strength), driven by strong signals on the 1-hour and 4-hour charts.
| Resistance | Price |
|---|---|
| R3 | 77.360 |
| R2 | 75.620 |
| R1 | 74.660 |
| Pivot | 72.920 |
| Support | Price |
|---|---|
| S1 | 71.960 |
| S2 | 70.220 |
| S3 | 69.260 |
| Fib 61.8% | 82.830 |
Energy Markets
Brent crude futures ended the week at $114.19, experiencing a daily decline of 2.24%. The price action suggested a bearish sentiment, influenced by mixed economic data and potential easing of geopolitical tensions. The daily RSI was 62.0, indicating bullish momentum, while the weekly RSI at 70.4 suggested it was approaching overbought territory. MACD histograms were positive on the daily (+1.33) and weekly (+2.73) charts, pointing to underlying strength despite the weekly price drop. Stochastic oscillators showed overbought conditions on the daily (87.2% K, 92.5% D) and weekly (68.7% K, 71.8% D). ADX remained at 1.0, indicating a lack of strong trend. The price was trading above the daily 20-day SMA (103.77) and testing the upper Bollinger Band (118.59). The overall sentiment was BUY (78% strength), primarily driven by the daily and weekly signals.
| Resistance | Price |
|---|---|
| R3 | 128.61 |
| R2 | 124.55 |
| R1 | 120.67 |
| Pivot | 116.61 |
| Support | Price |
|---|---|
| S1 | 112.73 |
| S2 | 108.67 |
| S3 | 104.79 |
| Fib 61.8% | 89.05 |
WTI Crude Oil
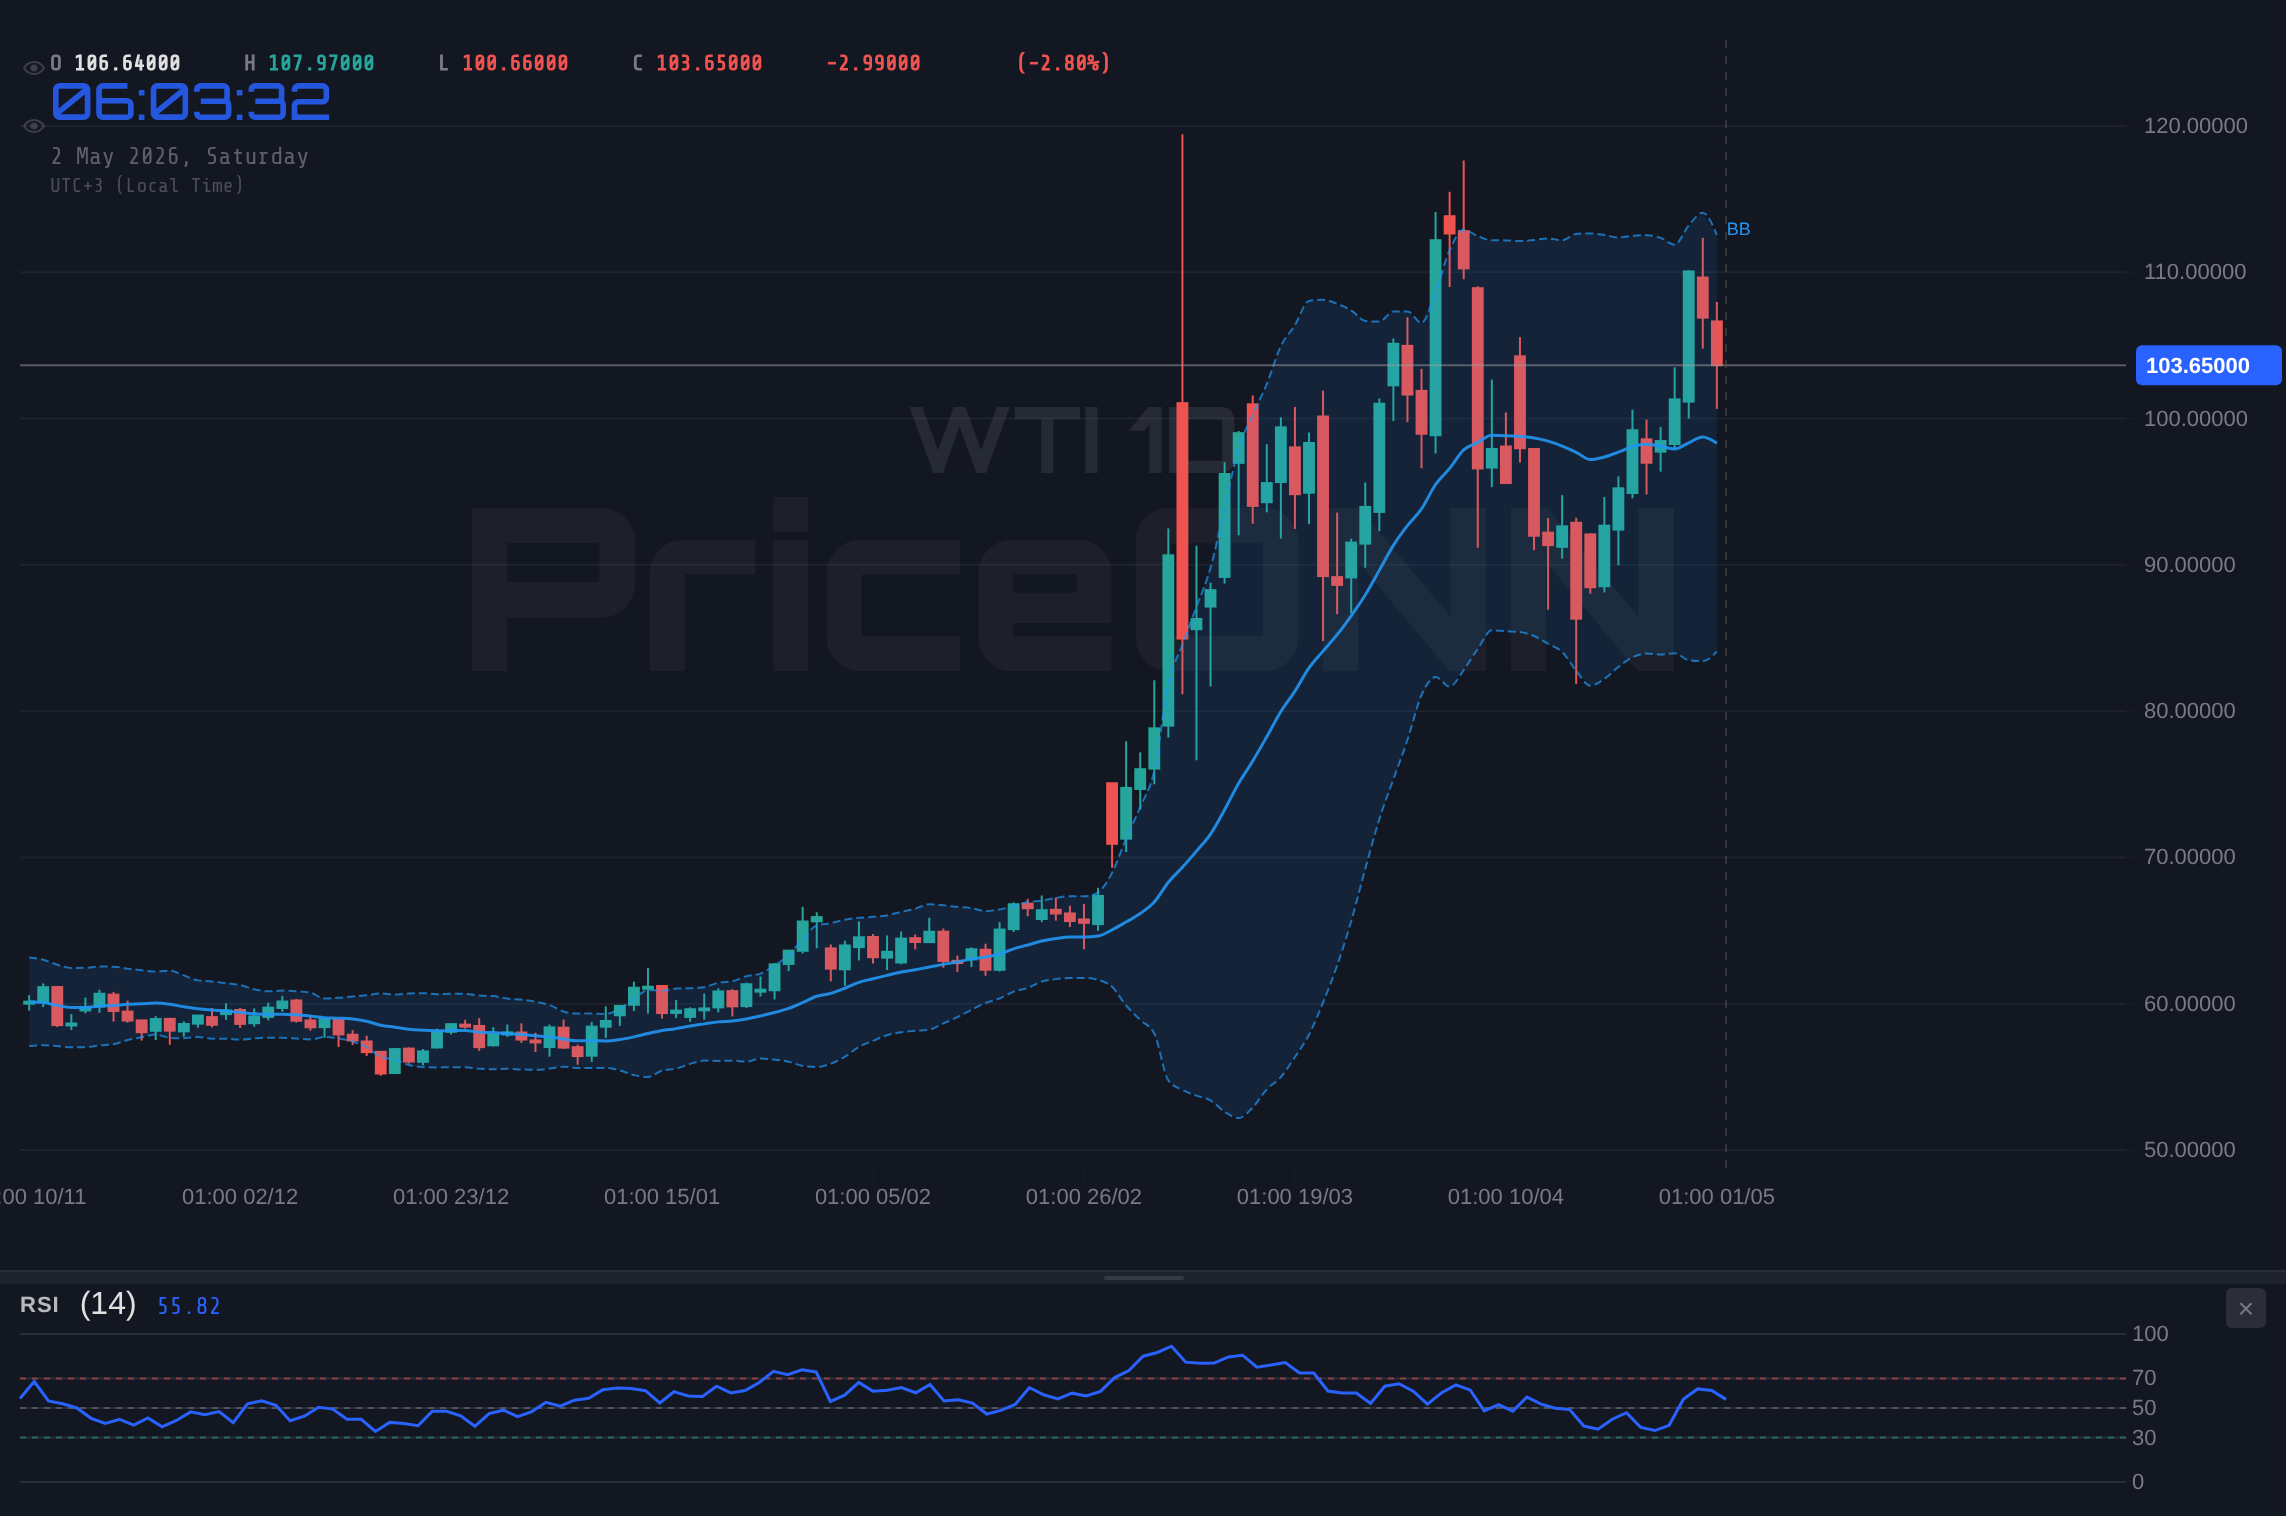
WTI crude oil futures closed the week at $103.75, registering a notable daily decrease of 2.95%. This decline mirrored the weakness seen in Brent crude. The daily RSI stood at 56.9, indicating bullish momentum, while the weekly RSI at 66.2 suggested it was in the upper neutral zone. MACD histograms were positive on the daily (+0.77) and weekly (+2.39) charts, aligning with the RSI readings. Stochastic oscillators indicated overbought conditions on the daily (80.6% K, 83.3% D) and weekly (56.9% K, 64.3% D). ADX remained at 1.0 across all timeframes. The price was trading above the daily 20-day SMA (98.32) and near the upper Bollinger Band (112.56). The overall sentiment was BUY (77% strength), supported by the daily and weekly signals.
| Resistance | Price |
|---|---|
| R3 | 118.81 |
| R2 | 115.58 |
| R1 | 111.24 |
| Pivot | 108.01 |
| Support | Price |
|---|---|
| S1 | 103.67 |
| S2 | 100.44 |
| S3 | 96.10 |
| Fib 61.8% | 85.01 |
Cryptocurrency Update
BTCUSD (Bitcoin)
Bitcoin experienced a strong week, closing at $78,365 with a daily gain of 2.44%. The cryptocurrency showed robust bullish momentum across all observed timeframes. The daily RSI was 62.1, and the weekly RSI was 46.5, placing the daily in bullish territory and the weekly in neutral. MACD histograms were strongly positive on the 4-hour (+266.81) and weekly (+1,535.94) charts, indicating significant upward momentum. Stochastic oscillators showed overbought conditions on the 4-hour (75.6% K, 80.2% D) and weekly (88.1% K, 56.9% D). ADX remained at 1.0, indicating a lack of trend strength. The price was trading above the daily 20-day SMA (76,100) and within the daily Bollinger Bands. The overall sentiment was strongly BUY (90% strength), with consistent BUY signals across all timeframes.
| Resistance | Price |
|---|---|
| R3 | 78,347 |
| R2 | 77,510 |
| R1 | 77,002 |
| Pivot | 76,165 |
| Support | Price |
|---|---|
| S1 | 75,657 |
| S2 | 74,820 |
| S3 | 74,312 |
| Fib 61.8% | 70,537 |
ETHUSD (Ethereum)
Ethereum also saw a positive week, closing at $2,302.36 with a daily gain of 1.8%. The cryptocurrency displayed a mixed but generally bullish technical picture. The daily RSI was 52.9, and the weekly RSI at 43.1, placing the daily in bullish territory and the weekly in the lower neutral zone. MACD histograms were positive on the 4-hour (+5.69) and weekly (+40.21) charts. Stochastic oscillators showed overbought conditions on the 4-hour (65.8% K, 70.4% D) and weekly (77.3% K, 55.2% D). ADX remained at 1.0. The price was trading above the daily 20-day SMA (2,313.63) and within the daily Bollinger Bands. The sentiment was BUY (84% strength), with strong BUY signals on the 1-hour and 4-hour charts, despite neutral signals on the daily.
| Resistance | Price |
|---|---|
| R3 | 2,331.12 |
| R2 | 2,304.18 |
| R1 | 2,282.96 |
| Pivot | 2,256.02 |
| Support | Price |
|---|---|
| S1 | 2,234.80 |
| S2 | 2,207.86 |
| S3 | 2,186.64 |
| Fib 61.8% | 2,136.62 |
Stock Indices
The S&P 500 index closed the week at 6,573, reflecting a strong daily gain of 0.74%. The index demonstrated bullish momentum, particularly on shorter timeframes. The daily RSI was 45.4, indicating bearish momentum, while the weekly RSI at 45.8 also suggested a lack of upward strength. MACD histograms were negative on the daily (-6.48) and weekly (-74.15) charts. Stochastic oscillators showed overbought conditions on the 4-hour (97.9% K, 87.0% D) but were neutral on the daily (43.0% K, 29.9% D). ADX remained at 1.0. The price was trading above the daily 20-day SMA (6,621) and within the daily Bollinger Bands. The overall sentiment was BUY (83% strength), driven by strong 1-hour and 4-hour signals, despite weaker daily indicators.
| Resistance | Price |
|---|---|
| R3 | 6,833 |
| R2 | 6,686 |
| R1 | 6,605 |
| Pivot | 6,458 |
| Support | Price |
|---|---|
| S1 | 6,377 |
| S2 | 6,231 |
| S3 | 6,150 |
| Fib 61.8% | 6,744 |
Nasdaq 100
The Nasdaq 100 index closed at 27,664, up 0.73% on the day. The index showed strong bullish momentum across most timeframes. The daily RSI was 75.2, indicating an overbought condition, while the weekly RSI at 68.4 was also in bullish territory. MACD histograms were significantly positive on the daily (+101.15) and weekly (+231.28) charts. Stochastic oscillators showed overbought conditions on the 1-hour (78.0% K, 81.7% D) and 4-hour (81.3% K, 84.4% D) charts, with the weekly showing 98.7% K. ADX remained at 1.0. The price was trading above the daily 20-day SMA (26,231) and within the daily Bollinger Bands. The sentiment was strongly BUY (77% strength), with consistent BUY signals across all timeframes.
| Resistance | Price |
|---|---|
| R3 | 28,084 |
| R2 | 27,787 |
| R1 | 27,625 |
| Pivot | 27,328 |
| Support | Price |
|---|---|
| S1 | 27,165 |
| S2 | 26,868 |
| S3 | 26,706 |
| Fib 61.8% | 24,696 |
Dow Jones Industrial Average (DJIA)
The Dow Jones Industrial Average closed the week at 49,460, down 0.58% on the day. The index presented a mixed technical picture, with shorter-term indicators leaning bearish while longer-term charts suggested underlying strength. The daily RSI was 61.6, in bullish territory, while the weekly RSI at 59.2 was also bullish. MACD histograms were positive on the 4-hour (+73.44) and daily (+44.16) charts. Stochastic oscillators showed overbought conditions on the 4-hour (84.3% K, 93.9% D) and weekly (89.9% K, 45.3% D). ADX remained at 1.0. The price was trading above the daily 20-day SMA (48,680) and within the daily Bollinger Bands. The sentiment was BUY (80% strength), supported by the 4-hour and daily signals, despite the daily price action.
| Resistance | Price |
|---|---|
| R3 | 51,497 |
| R2 | 50,635 |
| R1 | 50,191 |
| Pivot | 49,329 |
| Support | Price |
|---|---|
| S1 | 48,885 |
| S2 | 48,023 |
| S3 | 47,579 |
| Fib 61.8% | 46,788 |
Economic Calendar Impact
Several key economic events influenced market sentiment and price action during the week of April 27 – May 1, 2026.
- U.S. ISM Manufacturing Prices: The actual reading of 84.6 significantly exceeded the forecast of 80, indicating higher-than-expected input costs for manufacturers. This surprise contributed to a hawkish lean for the USD, potentially signaling inflationary pressures.
- U.S. ISM Manufacturing Purchasing Managers Index (PMI): The actual figure of 52.7 was slightly below the forecast of 53.1. This indicated a modest slowdown in manufacturing sector expansion, which may have contributed to the USD's weakness later in the week.
- U.S. Manufacturing Purchasing Managers Index (PMI): The actual reading of 54.5 surpassed the forecast of 54, suggesting a slightly stronger manufacturing output than anticipated. This provided some support for the USD.
- U.S. Chicago Purchasing Managers Index (PMI): This index came in notably below expectations at 49.2 against a forecast of 54.8. This contraction in Chicago-area manufacturing activity was a significant negative surprise for the USD.
- U.S. Core PCE Price Index (MoM & YoY): Both the month-on-month and year-on-year core PCE price index figures were reported in line with forecasts at 0.3% and 3.2% respectively. This lack of surprise provided stability for the USD, offering no strong directional impetus.
- U.S. Gross Domestic Product (GDP) QoQ: The Q1 GDP growth rate was reported at 2.0%, which was below the forecast of 2.2%. This deceleration in economic growth was a key factor contributing to the weakening of the USD during the week.
- U.S. Initial Jobless Claims: The number of initial jobless claims came in at 189, significantly below the forecast of 213. This strong labor market reading indicated resilience in employment, offering some support to the USD.
- Euro Zone Deposit Facility Rate & Interest Rate Decision: Both the deposit facility rate and the main interest rate decision were held in line with forecasts at 2.00% and 2.15% respectively. This meeting did not provide any major surprises for the EUR.
- Eurozone Consumer Price Index (CPI) YoY: Inflation in the Eurozone remained steady at 3.0% year-on-year, matching the forecast. This consistent inflation level suggested a stable price environment in the Eurozone.
- Germany Gross Domestic Product (GDP) QoQ: Germany's Q1 GDP growth exceeded expectations, coming in at 0.3% against a forecast of 0.1%. This positive surprise for the German economy provided some underlying support for the EUR.
- U.S. Federal Open Market Committee (FOMC) Interest Rate Decision: The Fed maintained its interest rate at 3.75%, as widely expected. The accompanying statement and press conference offered no significant surprises, leading to a muted reaction in the USD.
- U.S. Crude Oil Inventories: Crude oil inventories fell by a substantial 6.53 million barrels, far exceeding the forecast of a 0.3 million barrel build. This significant drop in stockpiles indicated strong demand or supply disruptions, potentially supporting oil prices.
- U.S. Durable Goods Orders MoM: Durable goods orders increased by 0.8% in March, surpassing the forecast of 0.4%. This stronger-than-expected rise in orders for long-lasting manufactured goods signaled robust business investment and supported the USD.
- Germany Consumer Price Index (CPI) MoM: German CPI for April was slightly lower than expected at 0.6% month-on-month, compared to a forecast of 0.7%. This minor miss suggested a slight cooling in German inflation.
- U.S. CB Consumer Confidence: The Consumer Confidence index reading of 92.8 was notably higher than the forecast of 89. This indicated a stronger consumer sentiment than anticipated, which is generally positive for the USD.
- Japan Interest Rate Decision: The Bank of Japan held its key interest rate steady at 0.75%, in line with expectations. This decision did not introduce any major shifts in JPY dynamics.
Week in Summary
The week of April 27 to May 1, 2026, was marked by a retreat in the U.S. Dollar, driven by weaker-than-expected GDP figures and mixed manufacturing data. This provided a tailwind for riskier assets. Gold prices exhibited stability, largely trading sideways as investors navigated the shifting dollar sentiment and global economic uncertainties. Equity markets, particularly in the U.S., experienced a strong rally, fueled by robust corporate earnings reports, especially from technology firms leveraging AI advancements. The Nasdaq 100 and S&P 500 closed at new highs, reflecting a speculative surge in AI-related stocks. The energy sector faced downward pressure, with Brent and WTI crude oil prices declining due to concerns over global manufacturing output and fluctuating geopolitical factors. Cryptocurrencies continued their upward trend, with Bitcoin and Ethereum reaching new milestones, supported by ongoing institutional adoption and the pervasive AI narrative. The Japanese Yen saw intervention from the Ministry of Finance on April 30 and May 1, as USD/JPY breached critical levels, highlighting concerns over currency volatility. Overall, the week was characterized by a risk-on sentiment in equities and cryptos, a weaker dollar, and consolidation in gold, with energy markets facing headwinds.
Track markets in real-time
AI-powered analysis, technical indicators and real-time price data.
Join Our Telegram Channel
Breaking market news, AI analysis and trading signals instantly.
Join Channel