Weekly Market Review - Week 20 (May 11, 2026 – May 15, 2026): Dollar Strengthens, Gold Dips, Oil Surges
This Week 20 (May 11-15, 2026) market review covers a period of dollar strength, gold's decline to $4,538, and a surge in oil prices towards $111. Analysis of key forex, metals, energy, crypto, and stock indices.
Weekly Market Review: May 11, 2026 – May 15, 2026 (Week 20)
Executive Summary
The trading week of May 11 to May 15, 2026, saw a notable strengthening of the US Dollar, reflected in the DXY index's rise. Gold experienced a significant downturn, with XAUUSD closing the week down 2.45% and testing lower support levels. Conversely, energy markets demonstrated robust performance, with WTIcrude oil surging 3.2% and Brent crude gaining 2.28%, driven by geopolitical tensions and supply concerns. Major forex pairs like EUR/USD and GBP/USD weakened against the dollar, while USD/JPY saw gains. Stock indices experienced mixed signals, with the S&P 500 and Dow Jones showing some resilience despite intraday volatility, while the Nasdaq 100 faced selling pressure.
The US Dollar Index (DXY) concluded the week with a gain of 0.45%, reflecting broad-based dollar strength across major currency pairs. On the daily timeframe, the DXY's RSI stood at 59.9, indicating a bullish momentum moving away from overbought territory (72.0 on 1H, 81.4 on 4H). The MACD histogram on the daily chart was positive at +0.11, supporting the upward trend. ADX on all observed timeframes was nominal at 1.0, suggesting a lack of strong directional trend strength across all periods, but the overall sentiment favored buying. The DXY closed the week at 99.036, testing resistance.
Resistance
Price
R3
99.250
R2
98.940
R1
98.760
Pivot
98.450
Support
Price
S1
98.270
S2
97.960
S3
97.780
Fib 61.8%
98.480
Forex Majors Review
EUR/USD experienced a decline of 0.37% for the week, closing at 1.16237. The daily RSI at 41.2 indicated a bearish sentiment, while the 1H and 4H RSI were deeply oversold at 29.6 and 22.1, respectively. The MACD histogram was flat across all timeframes, suggesting consolidation. The pair tested lower support levels.
XAGUSD 4H Chart
Resistance
Price
R3
1.17591
R2
1.17399
R1
1.17034
Pivot
1.16842
Support
Price
S1
1.16477
S2
1.16285
S3
1.15920
Fib 61.8%
1.17000
GBP/USD also faced downward pressure, closing the week down 0.63% at 1.33169. Similar to EUR/USD, the daily RSI was at 39.0, with 1H (29.0) and 4H (19.9) showing oversold conditions. The MACD histogram was neutral. The pair traded near its lower Bollinger Band on the 1H chart.
Resistance
Price
R3
1.36277
R2
1.35795
R1
1.34901
Pivot
1.34419
Support
Price
S1
1.33525
S2
1.33043
S3
1.32149
Fib 61.8%
1.35000
USD/JPY exhibited strength, gaining 0.28% to close at 158.80. The daily RSI was at 54.3, indicating a mild bullish sentiment, while the 1H RSI was approaching overbought at 69.3 and the 4H RSI was firmly overbought at 83.7. The MACD histogram was positive across daily timeframes. The pair traded above its 20-day SMA.
Resistance
Price
R3
159.82
R2
159.12
R1
158.73
Pivot
158.03
Support
Price
S1
157.64
S2
156.94
S3
156.55
Fib 61.8%
157.20
AUD/USD depreciated by 1.02% for the week, closing at 0.71458. The daily RSI was 48.6, with 1H (31.2) and 4H (27.1) RSI in the lower range. The MACD histogram was neutral. The pair traded below its 20-day SMA.
Resistance
Price
R3
0.72986
R2
0.72810
R1
0.72501
Pivot
0.72325
Support
Price
S1
0.72016
S2
0.71840
S3
0.71531
Fib 61.8%
1.17000
NZD/USD saw a significant drop of 1.22%, finishing the week at 0.58374. The daily RSI was 43.7, with 1H (22.7) and 4H (23.2) RSI in oversold territory. The MACD histogram was flat. The pair traded at the lower boundary of its daily Bollinger Bands.
Resistance
Price
R3
0.59637
R2
0.59523
R1
0.59309
Pivot
0.59195
Support
Price
S1
0.58981
S2
0.58867
S3
0.58653
Fib 61.8%
1.17000
Precious Metals
Gold (XAUUSD) experienced a sharp decline of 2.45% for the week, closing at 4,538.38. The daily RSI at 39.3 indicated bearish momentum, while the 1H (25.8) and 4H (25.3) RSI were deeply oversold. The Stochastic %K on the 1H was at 22.4, also suggesting oversold conditions. The MACD histogram on the daily chart showed a slight positive reading (+0.42), but the overall signal across all timeframes was SELL. Gold traded below its 20-day SMA (4,609.19) and tested the S1 support level of 4,624.79.
Resistance
Price
R3
4,773.03
R2
4,745.69
R1
4,698.91
Pivot
4,671.57
Support
Price
S1
4,624.79
S2
4,597.45
S3
4,550.67
Fib 61.8%
4,803.16
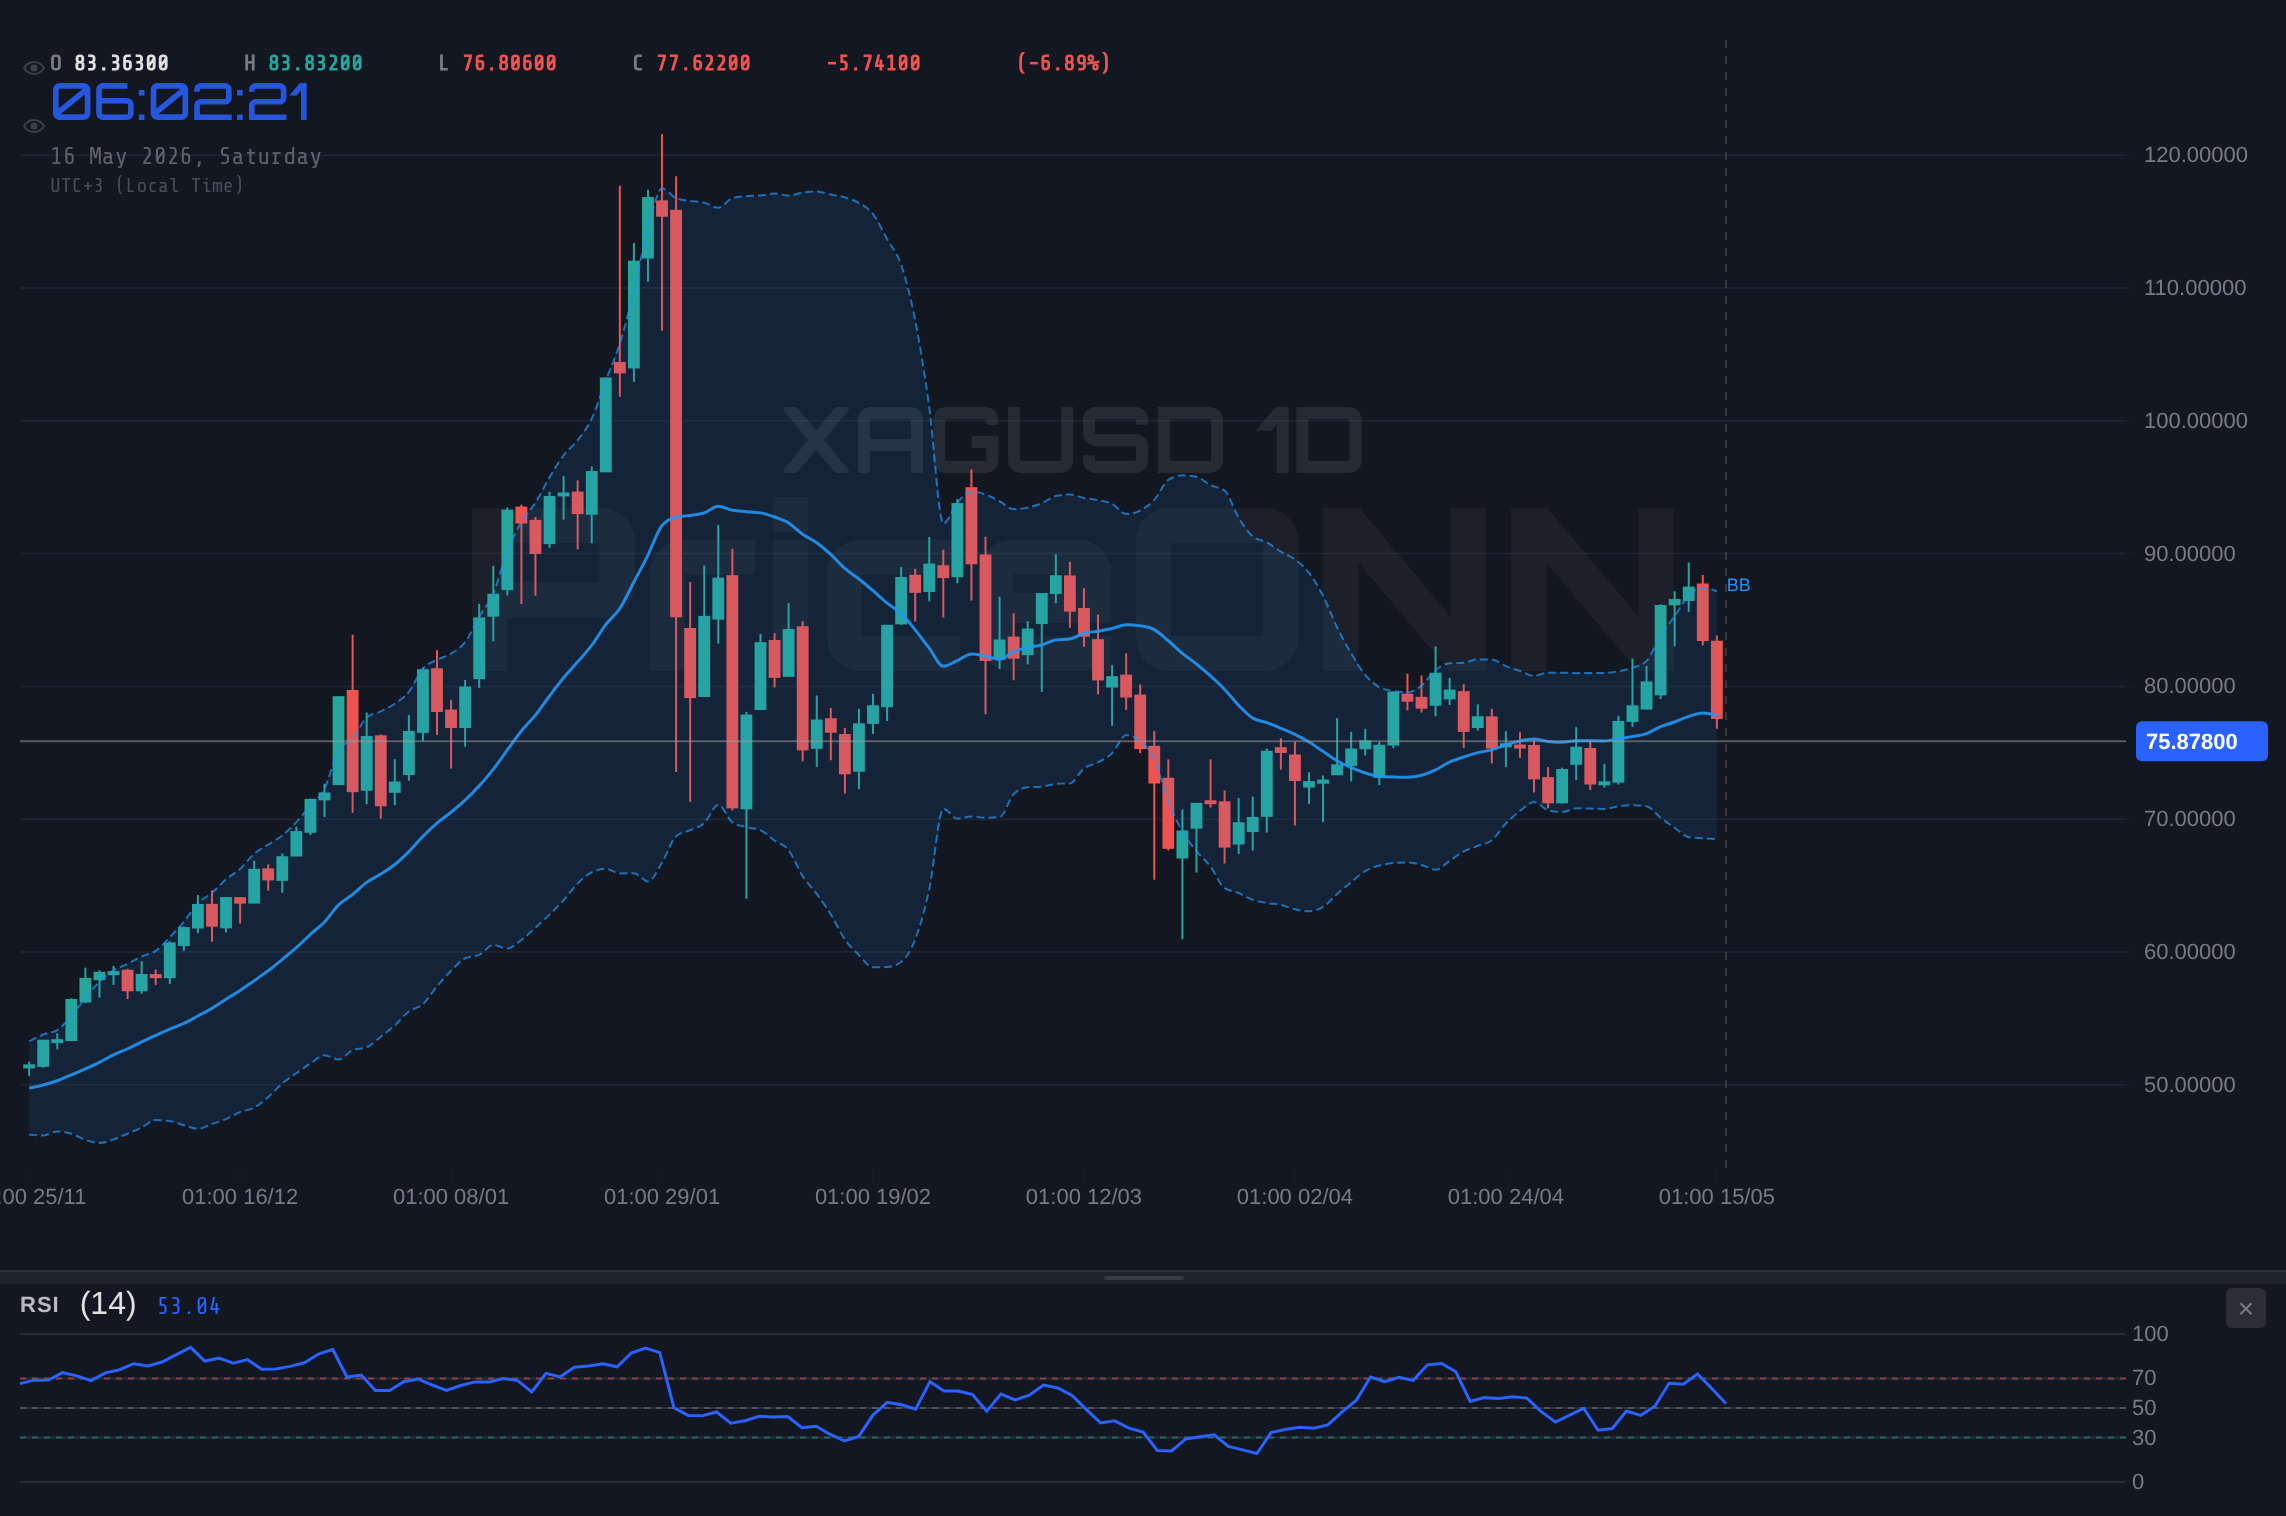
Silver (XAGUSD) also suffered, with a weekly loss of 9.07% to close at 75.915. The daily RSI was 46.1, while the 1H (24.7) and 4H (26.1) RSI were in oversold territory. The Stochastic %K on the 1H was 24.6. The MACD histogram on the daily chart was positive (+0.61), contrasting with the sell signals on shorter timeframes. Silver traded below its 20-day SMA (80.937) and tested the S2 support level of 79.680.
Resistance
Price
R3
92.210
R2
90.300
R1
86.900
Pivot
84.990
Support
Price
S1
81.580
S2
79.680
S3
76.270
Fib 61.8%
78.880
Energy Markets
Brent crude oil finished the week up 2.28% at 111.90. The daily RSI was 56.0, indicating a bullish bias, and the 1H (63.9) and 4H (61.7) RSI were in the upper range. The MACD histogram on the daily chart was negative (-0.47), but other timeframes showed positive momentum. Brent traded above its 20-day SMA (109.75) and approached its R1 resistance level of 110.69.
Resistance
Price
R3
114.01
R2
111.97
R1
110.69
Pivot
108.65
Support
Price
S1
107.37
S2
105.33
S3
104.05
Fib 61.8%
96.21
WTI crude oil posted a stronger gain of 3.2%, closing at 105.24. The daily RSI at 57.3 suggested a bullish trend, with 1H (67.8) and 4H (67.1) RSI in the strong bullish zone. The MACD histogram on the daily chart was slightly negative (-0.07), but overall sentiment was bullish. WTI traded above its 20-day SMA (102.66) and tested its R1 resistance level of 103.04.
Resistance
Price
R3
105.98
R2
104.10
R1
103.04
Pivot
101.16
Support
Price
S1
100.10
S2
98.22
S3
97.16
Fib 61.8%
92.99
Cryptocurrency Update
Bitcoin (BTC/USD) closed the week down 2.78% at 79,155. The daily RSI was 52.4, indicating a neutral to slightly bullish bias, but the 1H (33.3) and 4H (40.1) RSI were in the lower range, suggesting potential selling pressure. The MACD histogram on the daily chart was significantly negative at -265.06, pointing to bearish momentum, although shorter timeframes showed mixed signals. BTCUSD traded below its 20-day SMA (80,711).
Resistance
Price
R3
85,792
R2
83,922
R1
82,668
Pivot
80,798
Support
Price
S1
79,544
S2
77,674
S3
76,420
Fib 61.8%
71,820
Ethereum (ETH/USD) also saw a decline of 2.93%, closing at 2,229.00. The daily RSI was 43.3, indicating a bearish sentiment. The 1H (36.2) and 4H (37.1) RSI were in the lower range. The MACD histogram on the daily chart was negative at -12.89. ETHUSD traded below its 20-day SMA (2,264.74) and tested the S1 support level of 2,249.14.
Resistance
Price
R3
2,411.32
R2
2,364.25
R1
2,330.23
Pivot
2,283.16
Support
Price
S1
2,249.14
S2
2,202.07
S3
2,168.05
Fib 61.8%
2,136.62
Stock Indices
S&P 500 (SPX) closed the week with a gain of 0.74%, finishing at 6,573. The daily RSI was 45.4, suggesting a neutral to slightly bearish bias, while the 1H (71.0) and 4H (62.8) RSI were in bullish territory. The MACD histogram on the daily chart was negative (-6.48), indicating bearish momentum. The index traded below its 20-day SMA (6,527).
Resistance
Price
R3
6,833
R2
6,686
R1
6,605
Pivot
6,458
Support
Price
S1
6,377
S2
6,231
S3
6,150
Fib 61.8%
6,744
Nasdaq 100 (NDX) experienced a significant decline of 1.72%, closing at 29,076. The daily RSI was 70.3, approaching overbought conditions, while the 1H (34.2) and 4H (46.0) RSI were in the lower range. The MACD histogram on the daily chart was strongly positive (+64.87), suggesting upward momentum, which contrasted with the price action.
Resistance
Price
R3
30,062
R2
29,869
R1
29,726
Pivot
29,534
Support
Price
S1
29,391
S2
29,199
S3
29,056
Fib 61.8%
25,417
Dow Jones Industrial Average (DJI) closed the week down 1.31% at 49,408. The daily RSI was 54.0, indicating a neutral bias. The 1H (28.2) and 4H (38.2) RSI were in the lower range. The MACD histogram on the daily chart was negative (-41.20). The index traded below its 20-day SMA (49,892).
Resistance
Price
R3
50,665
R2
50,431
R1
50,248
Pivot
50,014
Support
Price
S1
49,831
S2
49,597
S3
49,414
Fib 61.8%
46,866
Economic Calendar Impact
The economic calendar for the week of May 11-15, 2026, featured several key releases that influenced market sentiment. While specific forecast vs. actual data was not provided for all events, the general trend indicated a mixed economic picture.
U.K. GDP Releases (GDP QoQ, MoM, YoY): Robust Q1 GDP growth was reported, yet the British Pound struggled, suggesting that other factors like inflation or global sentiment outweighed the positive domestic data.
U.S. Inflation Data (CPI, PPI): Persistent inflation in the US was a recurring theme. Stronger-than-expected inflation prints typically bolstered the US Dollar and put pressure on risk assets like gold and cryptocurrencies, as they increased the likelihood of higher-for-longer interest rates.
U.S. Retail Sales: The data on retail sales provided insights into consumer spending. A weaker-than-expected report could have weighed on the Dollar, while strong figures would have supported it.
The market reaction to these events was largely dictated by their implications for monetary policy. Stronger economic data, particularly inflation, tended to support the US Dollar, while weaker data or signs of economic slowdown could have led to dollar weakness and a potential flight to safety in assets like gold.
Week in Summary
The week of May 11-15, 2026, was characterized by a strong showing from the US Dollar, which appreciated against most major currencies. This dollar strength contributed to the significant decline observed in Gold and Silver, pushing XAUUSD towards the 4,500 level. Energy markets, however, defied the broader risk-off sentiment, with both Brent and WTI crude oil prices surging due to escalating geopolitical tensions and supply concerns. Stock indices presented a mixed picture; while the S&P 500 and Dow Jones showed some resilience, the Nasdaq 100 faced considerable selling pressure. Cryptocurrencies like Bitcoin and Ethereum also ended the week lower, reflecting a cautious market environment. The underlying theme was the persistent inflation data from the US, which continued to drive expectations around Federal Reserve policy, favoring a stronger dollar.
Disclaimer: This content is for informational and educational purposes only and does not constitute investment advice, financial recommendation, or an offer to buy or sell any financial instrument. Past performance does not guarantee future results. Always do your own research and consult a licensed financial advisor before making investment decisions.
Track markets in real-time
AI-powered analysis, technical indicators and real-time price data.
We are looking for writers who produce market analysis, macro commentary, and data-driven content. Reach readers in 10 languages through our multilingual publishing platform.