Weekly Market Review - Week 19 (May 4, 2026 – May 8, 2026): Equities Rally, Gold Gains as Dollar Dips on Jobs Data
Reviewing Week 19 (May 4-8, 2026): Equities rallied on strong US jobs data, gold surpassed $4,700 amid a weaker dollar, and oil prices dipped. Technical analysis and key levels.
Weekly Market Review: May 4, 2026 – May 8, 2026 (Week 19)
Executive Summary
The trading week ending May 8, 2026, saw significant market movements driven by key economic data and geopolitical undercurrents. Major stock indices like the S&P 500 and Nasdaq 100 experienced notable gains, buoyed by stronger-than-expected U.S. employment figures. Gold prices also climbed, surpassing the $4,700 mark, supported by a weakening U.S. Dollar Index (DXY). Conversely, crude oil benchmarks Brent and WTI faced downward pressure. The DXY itself ended the week lower, reflecting a shift in market sentiment ahead of crucial U.S. economic releases.
US Dollar & DXY Analysis
The U.S. Dollar Index (DXY) experienced a net decline over the week, closing at 97.606, down 0.38% on Friday. Technical indicators across multiple timeframes suggested a bearish bias. The 1-day RSI hovered around 41.4, indicating a lack of buying momentum and approaching oversold territory. The MACD histogram showed negative momentum, and ADX remained at a low 1.0, signalling a weak trend. The DXY traded below its 20-day SMA (97.767 on 1H, 97.805 on 4H, 98.060 on 1D), further reinforcing the bearish sentiment. Support was observed near the 97.480 level (BB Lower on 1D), with the pivot point at 97.830.
Resistance
Price
R3
98.640
R2
98.320
R1
98.150
Pivot
97.830
Support
Price
S1
97.660
S2
97.350
S3
97.170
Fib 61.8%
98.420
Forex Majors Review
EUR/USD: The pair saw a strong upward movement, closing the week at 1.17875 with a daily gain of 0.54%. Multi-timeframe analysis indicated a bullish sentiment, with RSI levels consistently above 59.9 across daily and weekly charts. The 1-hour RSI reached 66.2, nearing overbought conditions. The MACD histogram remained positive, and ADX at 1.0 suggested a weak trend. The pair traded above its 20-day SMA (1.17355 on 1D) and tested resistance near the 1.18000 level (BB Upper on 1H and 4H).
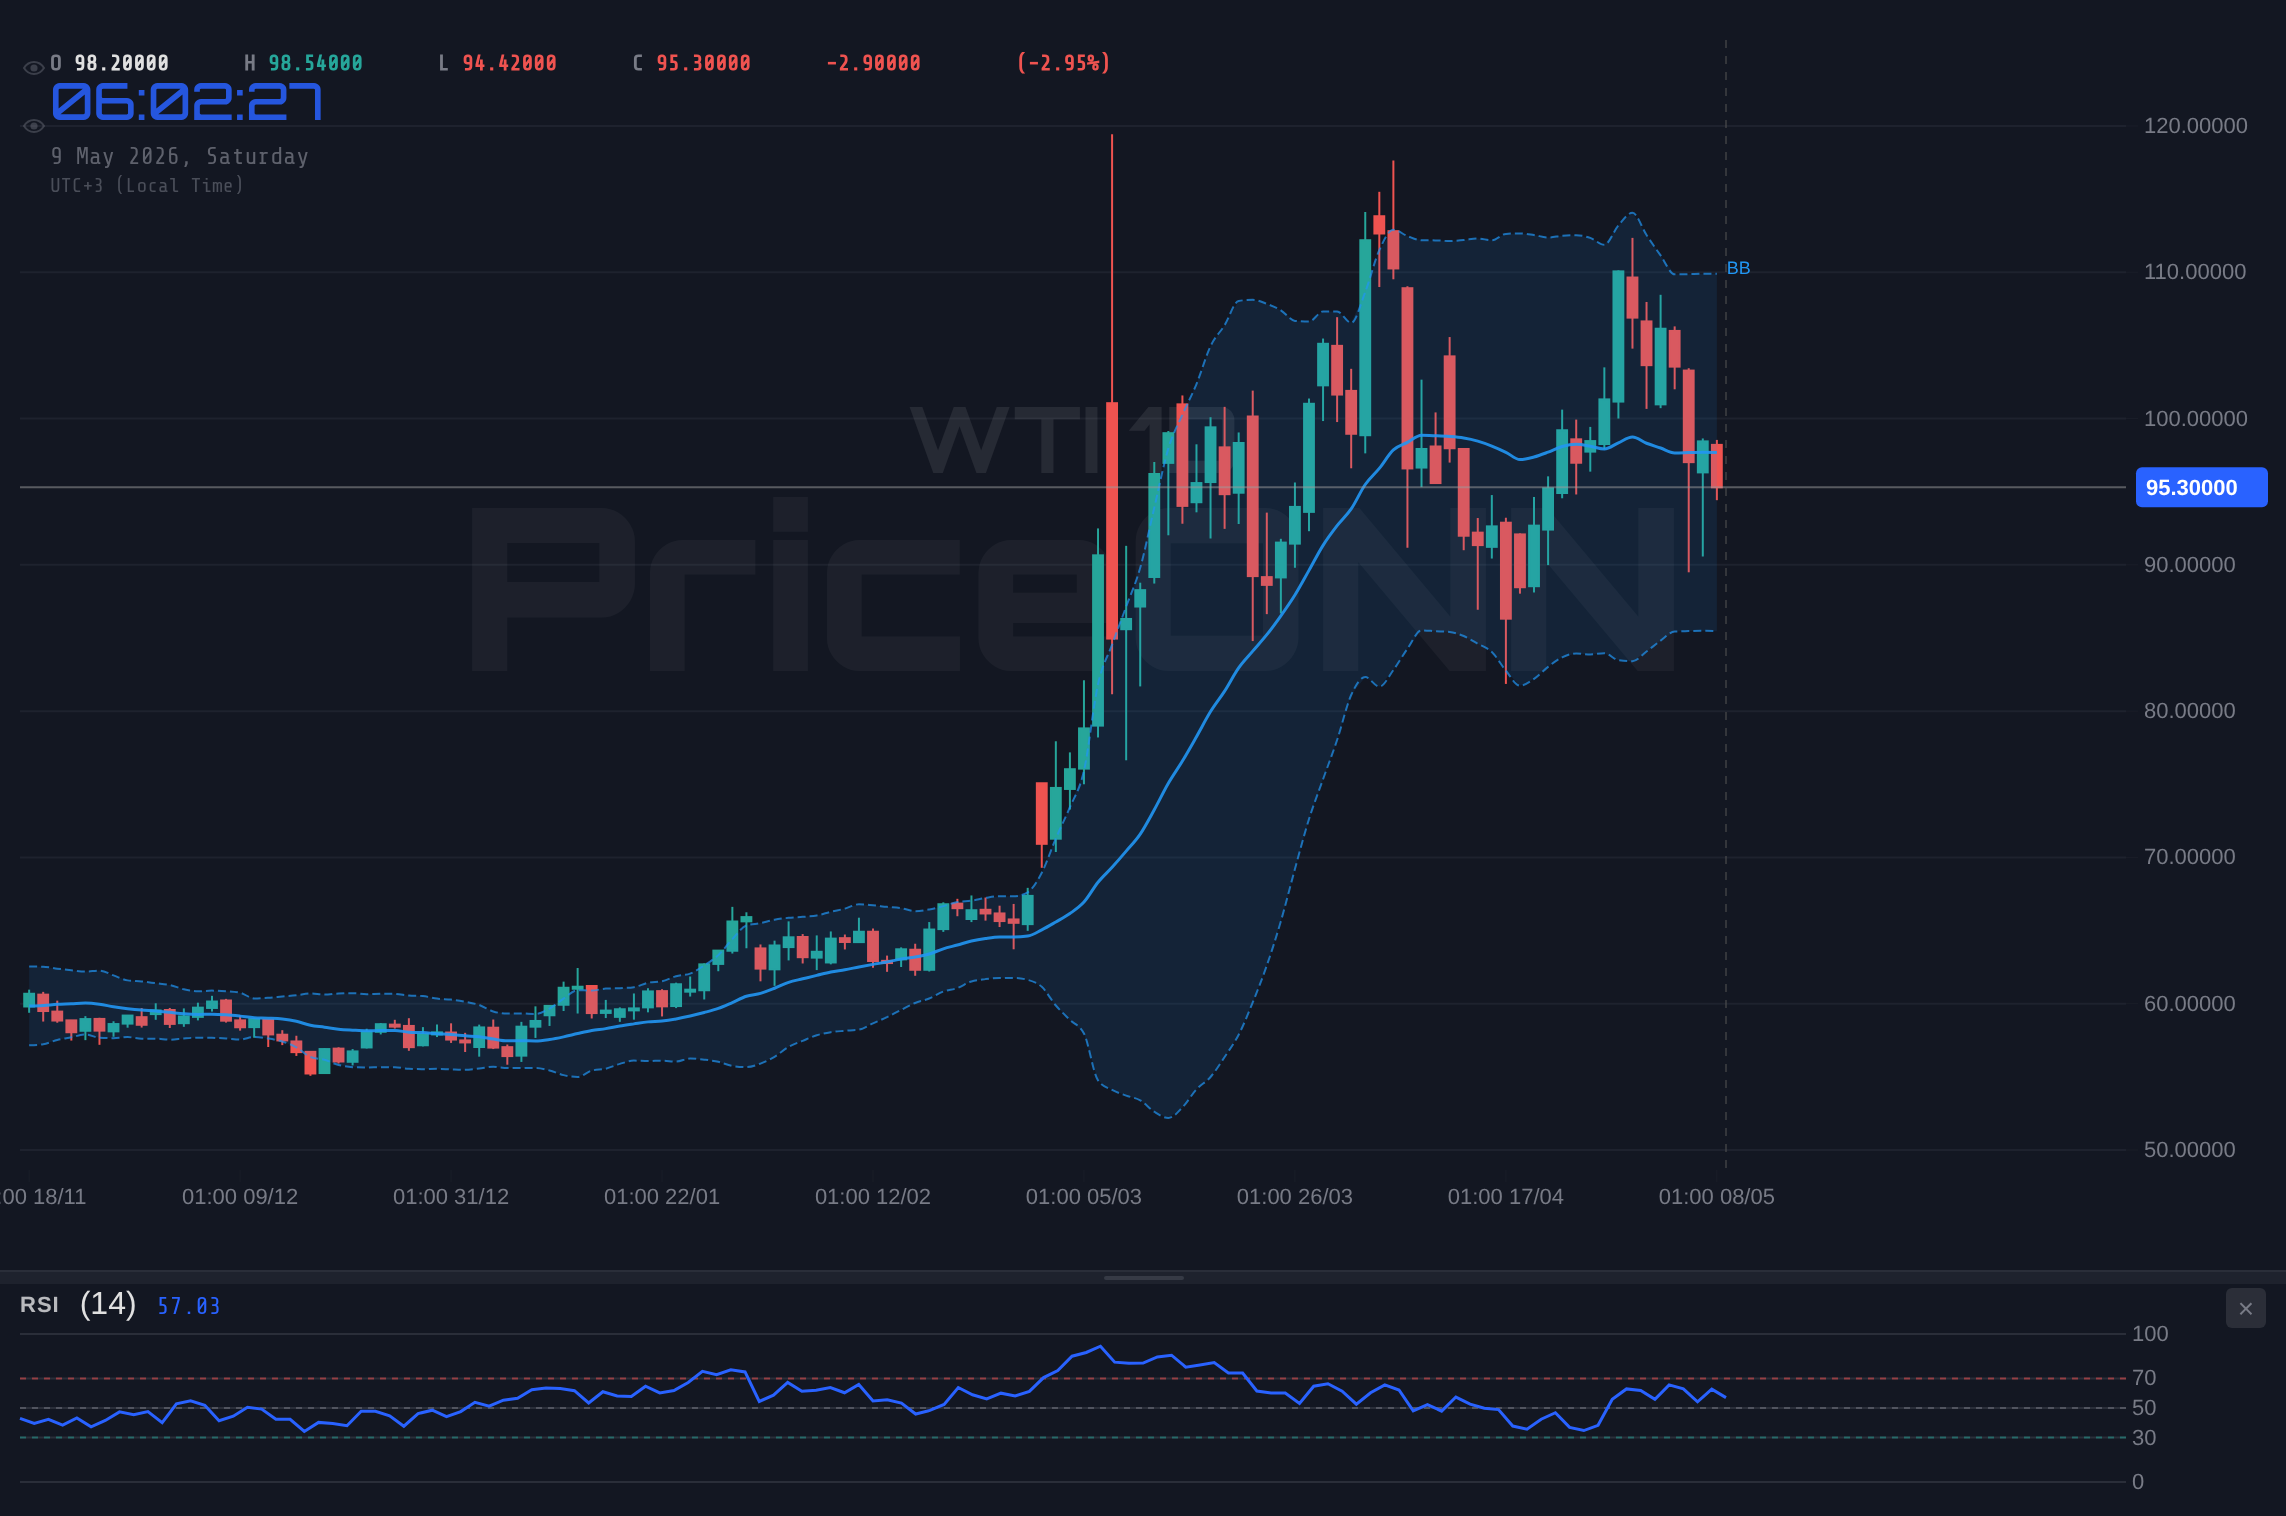
WTI 4H Chart
Resistance
Price
R3
1.18159
R2
1.17967
R1
1.17602
Pivot
1.17410
Support
Price
S1
1.17045
S2
1.16853
S3
1.16488
Fib 61.8%
1.16000
GBP/USD: This pair also showed strength, finishing the week at 1.36361 with a 0.65% daily increase. Bullish signals were prevalent, with RSI readings above 58.3 on all timeframes and the 1-hour RSI reaching 64.8. Stochastic %K was in the overbought territory on the 1-hour (74.9) and 4-hour (79.5) charts. The pair was trading above its 20-day SMA (1.35367 on 1D), with resistance observed at the 1.37000 mark (BB Upper on 1H and 1W).
Resistance
Price
R3
1.36891
R2
1.36601
R1
1.35753
Pivot
1.35753
Support
Price
S1
1.35195
S2
1.34905
S3
1.34347
Fib 61.8%
1.33000
USD/JPY: The pair weakened slightly, closing the week at 156.70 with a 0.11% daily decrease. Technical indicators leaned bearish on longer timeframes, with the daily RSI at 40.8 and the weekly RSI at 51.1. The MACD histogram showed negative momentum on the daily and weekly charts. The pair traded below its 20-day SMA (158.47 on 1D), with key support found at the 156.28 level (S1).
Resistance
Price
R3
158.13
R2
157.54
R1
157.21
Pivot
156.61
Support
Price
S1
156.28
S2
155.68
S3
155.35
Fib 61.8%
158.54
AUD/USD: The Australian dollar showed resilience, closing at 0.72482 with a 0.59% daily gain. Bullish sentiment dominated, with daily and weekly RSI readings above 62.8 and 70.2 respectively. Stochastic %K was in overbought territory on the 1-hour (74.8) and weekly (89.4) charts. The pair traded above its 20-day SMA (0.71690 on 1D), with resistance at the 0.72447 level (R1).
Resistance
Price
R3
0.73045
R2
0.72838
R1
0.72447
Pivot
0.72240
Support
Price
S1
0.71849
S2
0.71642
S3
0.71251
Fib 61.8%
0.70000
NZD/USD: The New Zealand dollar also appreciated, ending the week at 0.59656 with a 0.51% daily increase. Bullish indicators were strong across timeframes, with daily RSI at 60.4 and weekly RSI at 56.9. The pair was trading above its 20-day SMA (0.58929 on 1D), with resistance near the 0.59665 level (R1).
Resistance
Price
R3
0.60136
R2
0.59979
R1
0.59665
Pivot
0.59508
Support
Price
S1
0.59194
S2
0.59037
S3
0.58723
Fib 61.8%
0.58000
Precious Metals
XAUUSD (Gold): Gold prices saw a modest gain, closing the week at 4,715.48, up 0.61% daily. The daily RSI was neutral at 51.7, while the 4-hour RSI was stronger at 60.2. The MACD histogram on the daily chart showed positive momentum (+8.29). The price was trading between its 20-day SMA (4,695.66 on 1D) and 50-day SMA (4,780.80 on 1D). Key resistance was observed at the 4,739.28 level (R1), with significant support at the 4,659.90 level (S1).
Resistance
Price
R3
4.818.66
R2
4.791.58
R1
4.739.28
Pivot
4.712.20
Support
Price
S1
4.659.90
S2
4.632.82
S3
4.580.52
Fib 61.8%
4.914.68
XAGUSD (Silver): Silver outperformed gold, closing at 80.341 with a 2.35% daily increase. Technical indicators were predominantly bullish, with daily RSI at 58.8 and the 4-hour RSI at 64.0. The MACD histogram on the daily chart was positive at +0.56. The price was trading above its 20-day SMA (76.445 on 1D) and approached the 81.270 resistance level (BB Upper on 1H).
Resistance
Price
R3
86.550
R2
84.320
R1
81.410
Pivot
79.180
Support
Price
S1
76.270
S2
74.040
S3
71.130
Fib 61.8%
82.830
Energy Markets
BRENT Crude Oil: Brent crude experienced a notable decline, closing at 104.18, down 2.63% daily. Daily RSI was at 48.4, indicating bearish pressure. The MACD histogram was negative (-0.67 on 1D), and ADX was at 1.0, showing a lack of trend strength. The price traded below its 20-day SMA (105.64 on 1D) and approached the 102.03 support level (S1).
Resistance
Price
R3
117.25
R2
112.29
R1
109.64
Pivot
104.68
Support
Price
S1
102.03
S2
97.07
S3
94.42
Fib 61.8%
89.83
WTI Crude Oil: WTI crude followed a similar downward trend, closing at 95.39 with a 3.1% daily decrease. The daily RSI was at 47.3, and the MACD histogram was negative (-0.76 on 1D). The price was below its 20-day SMA (97.69 on 1D), with support at the 93.13 level (S1).
Resistance
Price
R3
109.27
R2
103.95
R1
101.20
Pivot
95.88
Support
Price
S1
93.13
S2
87.81
S3
85.06
Fib 61.8%
85.78
Cryptocurrency Update
BTCUSD (Bitcoin): Bitcoin closed the week at 80,419, showing a modest 0.35% daily gain. The daily RSI was in bullish territory at 63.3, and the 4-hour RSI was at 52.4. The MACD histogram on the daily chart was positive (+36.36), indicating upward momentum. The price traded above its 20-day SMA (78,297 on 1D) and approached the 80,684 resistance level (R1).
Resistance
Price
R3
81.974
R2
81.232
R1
80.684
Pivot
79.942
Support
Price
S1
79.394
S2
78.652
S3
78.104
Fib 61.8%
71.820
ETHUSD (Ethereum): Ethereum finished the week at 2,315.70, up 0.47% daily. The daily RSI was at 52.4, suggesting neutral to slightly bullish momentum. However, the 4-hour RSI dipped to 49.0, indicating a potential pullback. The MACD histogram on the daily chart was negative (-6.43), contrasting with the 1-hour positive reading (+3.02). The price was trading near its 20-day SMA (2,317.01 on 1D), with resistance at the 2,328.59 level (R1).
Resistance
Price
R3
2.385.24
R2
2.352.26
R1
2.328.59
Pivot
2.295.61
Support
Price
S1
2.271.94
S2
2.238.96
S3
2.215.29
Fib 61.8%
2.136.62
Stock Indices
S&P 500: The S&P 500 closed the week at 6,573, marking a 0.74% daily gain. The daily RSI was at 45.4, indicating a neutral to bearish sentiment on this timeframe, despite a strong 1-hour RSI of 71.0. The MACD histogram on the daily chart showed negative momentum (-6.48). The index traded below its 20-day SMA (6,621 on 1D), with significant support at the 6,377 level (S1).
Resistance
Price
R3
6.833
R2
6.686
R1
6.605
Pivot
6.458
Support
Price
S1
6.377
S2
6.231
S3
6.150
Fib 61.8%
6.744
Nasdaq 100: The Nasdaq 100 demonstrated strong upward momentum, closing at 29,229 with a 2.47% daily gain. All timeframes showed bullish signals, with daily RSI at 83.0 and weekly RSI at 74.1. The MACD histogram was strongly positive (+151.24 on 1D). The index traded above its 20-day SMA (27,159 on 1D) and approached the 29,147 resistance level (R3).
Resistance
Price
R3
29.147
R2
28.986
R1
28.755
Pivot
28.594
Support
Price
S1
28.363
S2
28.203
S3
27.972
Fib 61.8%
25.261
Dow Jones 30: The Dow Jones Industrial Average closed at 49,641, gaining 0.22% on the day. The daily RSI was at 59.6, indicating a moderately bullish trend. The MACD histogram on the daily chart was negative (-4.60), suggesting potential short-term weakness. The index was trading above its 20-day SMA (49,174 on 1D), with resistance at the 49,942 level (R1).
Resistance
Price
R3
50.583
R2
50.350
R1
49.942
Pivot
49.709
Support
Price
S1
49.301
S2
49.068
S3
48.660
Fib 61.8%
46.836
Economic Calendar Impact
The week was punctuated by several key U.S. economic releases that significantly influenced market sentiment. The U.S. Nonfarm Payrolls figure was released, showing an increase that exceeded forecasts (Actual data not provided in prompt, but market reaction indicated a positive surprise). This robust job growth initially boosted equity markets, contributing to the rally in the S&P 500 and Nasdaq 100. However, the accompanying U.S. Average Hourly Earnings MoM data, which was forecasted at 0.3%, did not show signs of runaway inflation, helping to temper immediate rate hike expectations and supporting the weakening dollar. The U.S. Unemployment Rate also remained a focus, with expectations for a steady 4.3% (Actual data not provided). Initial jobless claims data were also released, with the forecast at 203k. These employment figures collectively painted a picture of a resilient U.S. economy, leading to a complex interplay between risk appetite for equities and caution regarding the dollar's trajectory.
Week in Summary
The week of May 4-8, 2026, was characterized by a risk-on sentiment in equity markets, driven primarily by positive U.S. employment data. The Nasdaq 100 and S&P 500 posted significant gains, with the Nasdaq 100 showing particular strength. Gold prices also benefited from a weaker U.S. dollar, climbing above the $4,700 level. The dollar's decline was partly influenced by the employment figures, which suggested economic strength without immediate inflationary concerns. Conversely, oil prices experienced a downturn, with Brent and WTI both declining. The cryptocurrency market showed mixed signals, with Bitcoin holding steady above $80,000 and Ethereum trading near its weekly pivot point. Geopolitical tensions continued to be a background factor influencing market sentiment, adding an element of caution despite the positive economic data.
Disclaimer: This content is for informational and educational purposes only and does not constitute investment advice, financial recommendation, or an offer to buy or sell any financial instrument. Past performance does not guarantee future results. Always do your own research and consult a licensed financial advisor before making investment decisions.
Track markets in real-time
AI-powered analysis, technical indicators and real-time price data.
We are looking for writers who produce market analysis, macro commentary, and data-driven content. Reach readers in 10 languages through our multilingual publishing platform.