Weekly Market Outlook - Week 21 (May 18, 2026 – May 22, 2026): Inflation Data, Fed Minutes, and Commodity Strength
Week 21 (May 18, 2026 – May 22, 2026) market outlook: Focus on US inflation data and FOMC minutes. Commodity strength continues, while the US Dollar faces key resistance. Technical analysis and scenario planning for major assets.
Weekly Market Outlook: May 18, 2026 – May 22, 2026 (Week 21)
Executive Summary: This upcoming trading week, May 18-22, 2026, will be heavily influenced by key inflation data releases and the Federal Reserve's April FOMC minutes. Traders will be scrutinizing these events for directional cues. Commodity markets, particularly oil, are showing sustained strength, potentially supporting risk appetite. The US Dollar faces a critical juncture as it tests key resistance levels, with its trajectory likely determined by incoming economic data and Fed sentiment.
The US Dollar Index (DXY) is currently positioned at 99.034, exhibiting a strong upward momentum across multiple timeframes. The daily RSI at 59.8 indicates a bullish bias, supported by a positive MACD histogram and Stochastic %K above 90 on the 4H chart. However, the DXY is approaching significant resistance. Traders will be closely watching the
Resistance
Price
R3
99.250
R2
98.940
R1
98.760
Pivot
98.450
Support
Price
S1
98.270
S2
97.960
S3
97.780
Fib 61.8%
98.480
levels. A sustained break above the R1 of 98.760 could signal further upside, potentially testing R2 at 98.940 and R3 at 99.250. Conversely, a rejection from these levels might lead to a retracement towards the pivot point at 98.450 and subsequently S1 at 98.270. The sentiment is currently BUY, with an 80% strength, but short-term signals are mixed (1H: Buy, 4H: Buy, 1D: Buy).
EUR/USD is trading at 1.16238, showing weakness across all analyzed timeframes. The daily RSI at 41.2 is in bearish territory, and Stochastic %K at 11.5 on the daily chart suggests oversold conditions, though it has not yet crossed bullishly. The MACD histogram is flat, indicating a lack of strong momentum. Key levels to watch are the
XAGUSD 4H Chart
Resistance
Price
R3
1.17591
R2
1.17399
R1
1.17034
Pivot
1.16842
Support
Price
S1
1.16477
S2
1.16285
S3
1.15920
Fib 61.8%
1.17000
. A break below S1 at 1.16477 could target S2 at 1.16285, with S3 at 1.15920 as a significant support. Resistance will be encountered at the pivot (1.16842) and R1 (1.17034). The overall SELL signal, despite a Buy sentiment strength of 90%, highlights a divergence that traders should monitor. Expect potential consolidation around the 1.16000 level.
GBP/USD is currently priced at 1.33156, mirroring the bearish sentiment seen in EUR/USD. The daily RSI at 39.0 is approaching oversold territory. Stochastic %K at 10.7 on the daily chart also indicates potential for a bounce, but the immediate 1H and 4H charts show strong SELL signals with RSI values below 30. The key levels to monitor are
Resistance
Price
R3
1.36277
R2
1.35795
R1
1.34901
Pivot
1.34419
Support
Price
S1
1.33525
S2
1.33043
S3
1.32149
Fib 61.8%
1.35000
. A decisive move below S1 at 1.33525 could expose S2 at 1.33043 and S3 at 1.32149. Resistance will be found at the pivot (1.34419) and R1 (1.34901). The prevailing SELL signal, coupled with an 80% Buy sentiment strength, suggests that any rallies might be sold into, but a deeper dive into oversold conditions could lead to a short-covering bounce. Traders should watch for a potential test of the 1.33000 psychological level.
USD/JPY is trading at 158.78, showing a strong bullish bias across all timeframes. The daily RSI at 54.2 is in positive territory, and the 4H RSI at 83.5 indicates overbought conditions, suggesting caution for further immediate upside without consolidation. Stochastic %K is above 95 on the 4H chart, reinforcing the overbought signal. The key levels to watch are
Resistance
Price
R3
159.82
R2
159.12
R1
158.73
Pivot
158.03
Support
Price
S1
157.64
S2
156.94
S3
156.55
Fib 61.8%
157.20
. A breakout above R1 at 158.73 could lead to a test of R2 at 159.12 and R3 at 159.82. Support will be found at the pivot (158.03) and S1 (157.64). The consistent BUY signals across timeframes and a 90% Buy sentiment strength indicate that upside remains the favored direction. However, the overbought indicators on the 4H chart suggest a potential for a short-term pullback or consolidation before any further ascent.
AUD/USD is currently at 0.71440, displaying mixed signals. While the 1W RSI at 62.8 is bullish, the daily RSI at 48.6 is neutral, and the 1H and 4H RSIs are below 30, indicating bearish short-term pressure. Stochastic %K on the 1W chart at 85.9 suggests overbought conditions, while the 4H Stochastic is deeply oversold. The key levels for AUD/USD are
Resistance
Price
R3
0.72986
R2
0.72810
R1
0.72501
Pivot
0.72325
Support
Price
S1
0.72016
S2
0.71840
S3
0.71531
Fib 61.8%
1.35000
. A failure to hold S1 at 0.72016 could see a decline towards S2 (0.71840) and S3 (0.71531). Resistance is capped by the pivot (0.72325) and R1 (0.72501). The mixed signals and a 90% Buy sentiment strength suggest that the pair may be poised for a potential reversal or a significant move based on upcoming economic data. Traders should watch for a clear break of the 0.72000 to 0.72500 range.
NZD/USD is trading at 0.58364, exhibiting clear bearish momentum on shorter timeframes. The daily RSI at 43.7 is in bearish territory, and the 1H and 4H RSIs are below 25, indicating oversold conditions on these frames. Stochastic %K on the 4H chart at 3.3 is deeply oversold. The key levels to monitor are
Resistance
Price
R3
0.59637
R2
0.59523
R1
0.59309
Pivot
0.59195
Support
Price
S1
0.58981
S2
0.58867
S3
0.58653
Fib 61.8%
0.59000
. A breach of S1 at 0.58981 could target S2 at 0.58867 and S3 at 0.58653. Resistance lies at the pivot (0.59195) and R1 (0.59309). The predominantly SELL signal, despite an 80% Buy sentiment strength, suggests that short-term weakness might persist. A bounce from oversold conditions is possible if key support levels hold, but any upside may face immediate headwinds near the pivot.
Gold is currently trading at 4,538.03, showing significant bearish pressure across shorter timeframes, with RSI values below 30 on the 1H and 4H charts (25.8 and 25.3, respectively). Daily RSI at 39.3 also indicates weakness. Stochastic %K at 5.4 on the 4H chart suggests extreme oversold conditions, hinting at a potential for a bounce. The key levels to watch are
Resistance
Price
R3
4,773.03
R2
4,745.69
R1
4,698.91
Pivot
4,671.57
Support
Price
S1
4,624.79
S2
4,597.45
S3
4,550.67
Fib 61.8%
4,803.16
. A failure to hold the S2 support at 4,597.45 could lead to a test of S3 at 4,550.67. Resistance will be faced at the pivot (4,671.57) and R1 (4,698.91). The consistent SELL signal across timeframes, despite an 83% Buy sentiment strength, points to a significant disconnect. A technical bounce from oversold levels is plausible, but a sustained recovery will likely require a shift in macro sentiment or a weaker US Dollar. Traders should monitor the 4,600 level closely.
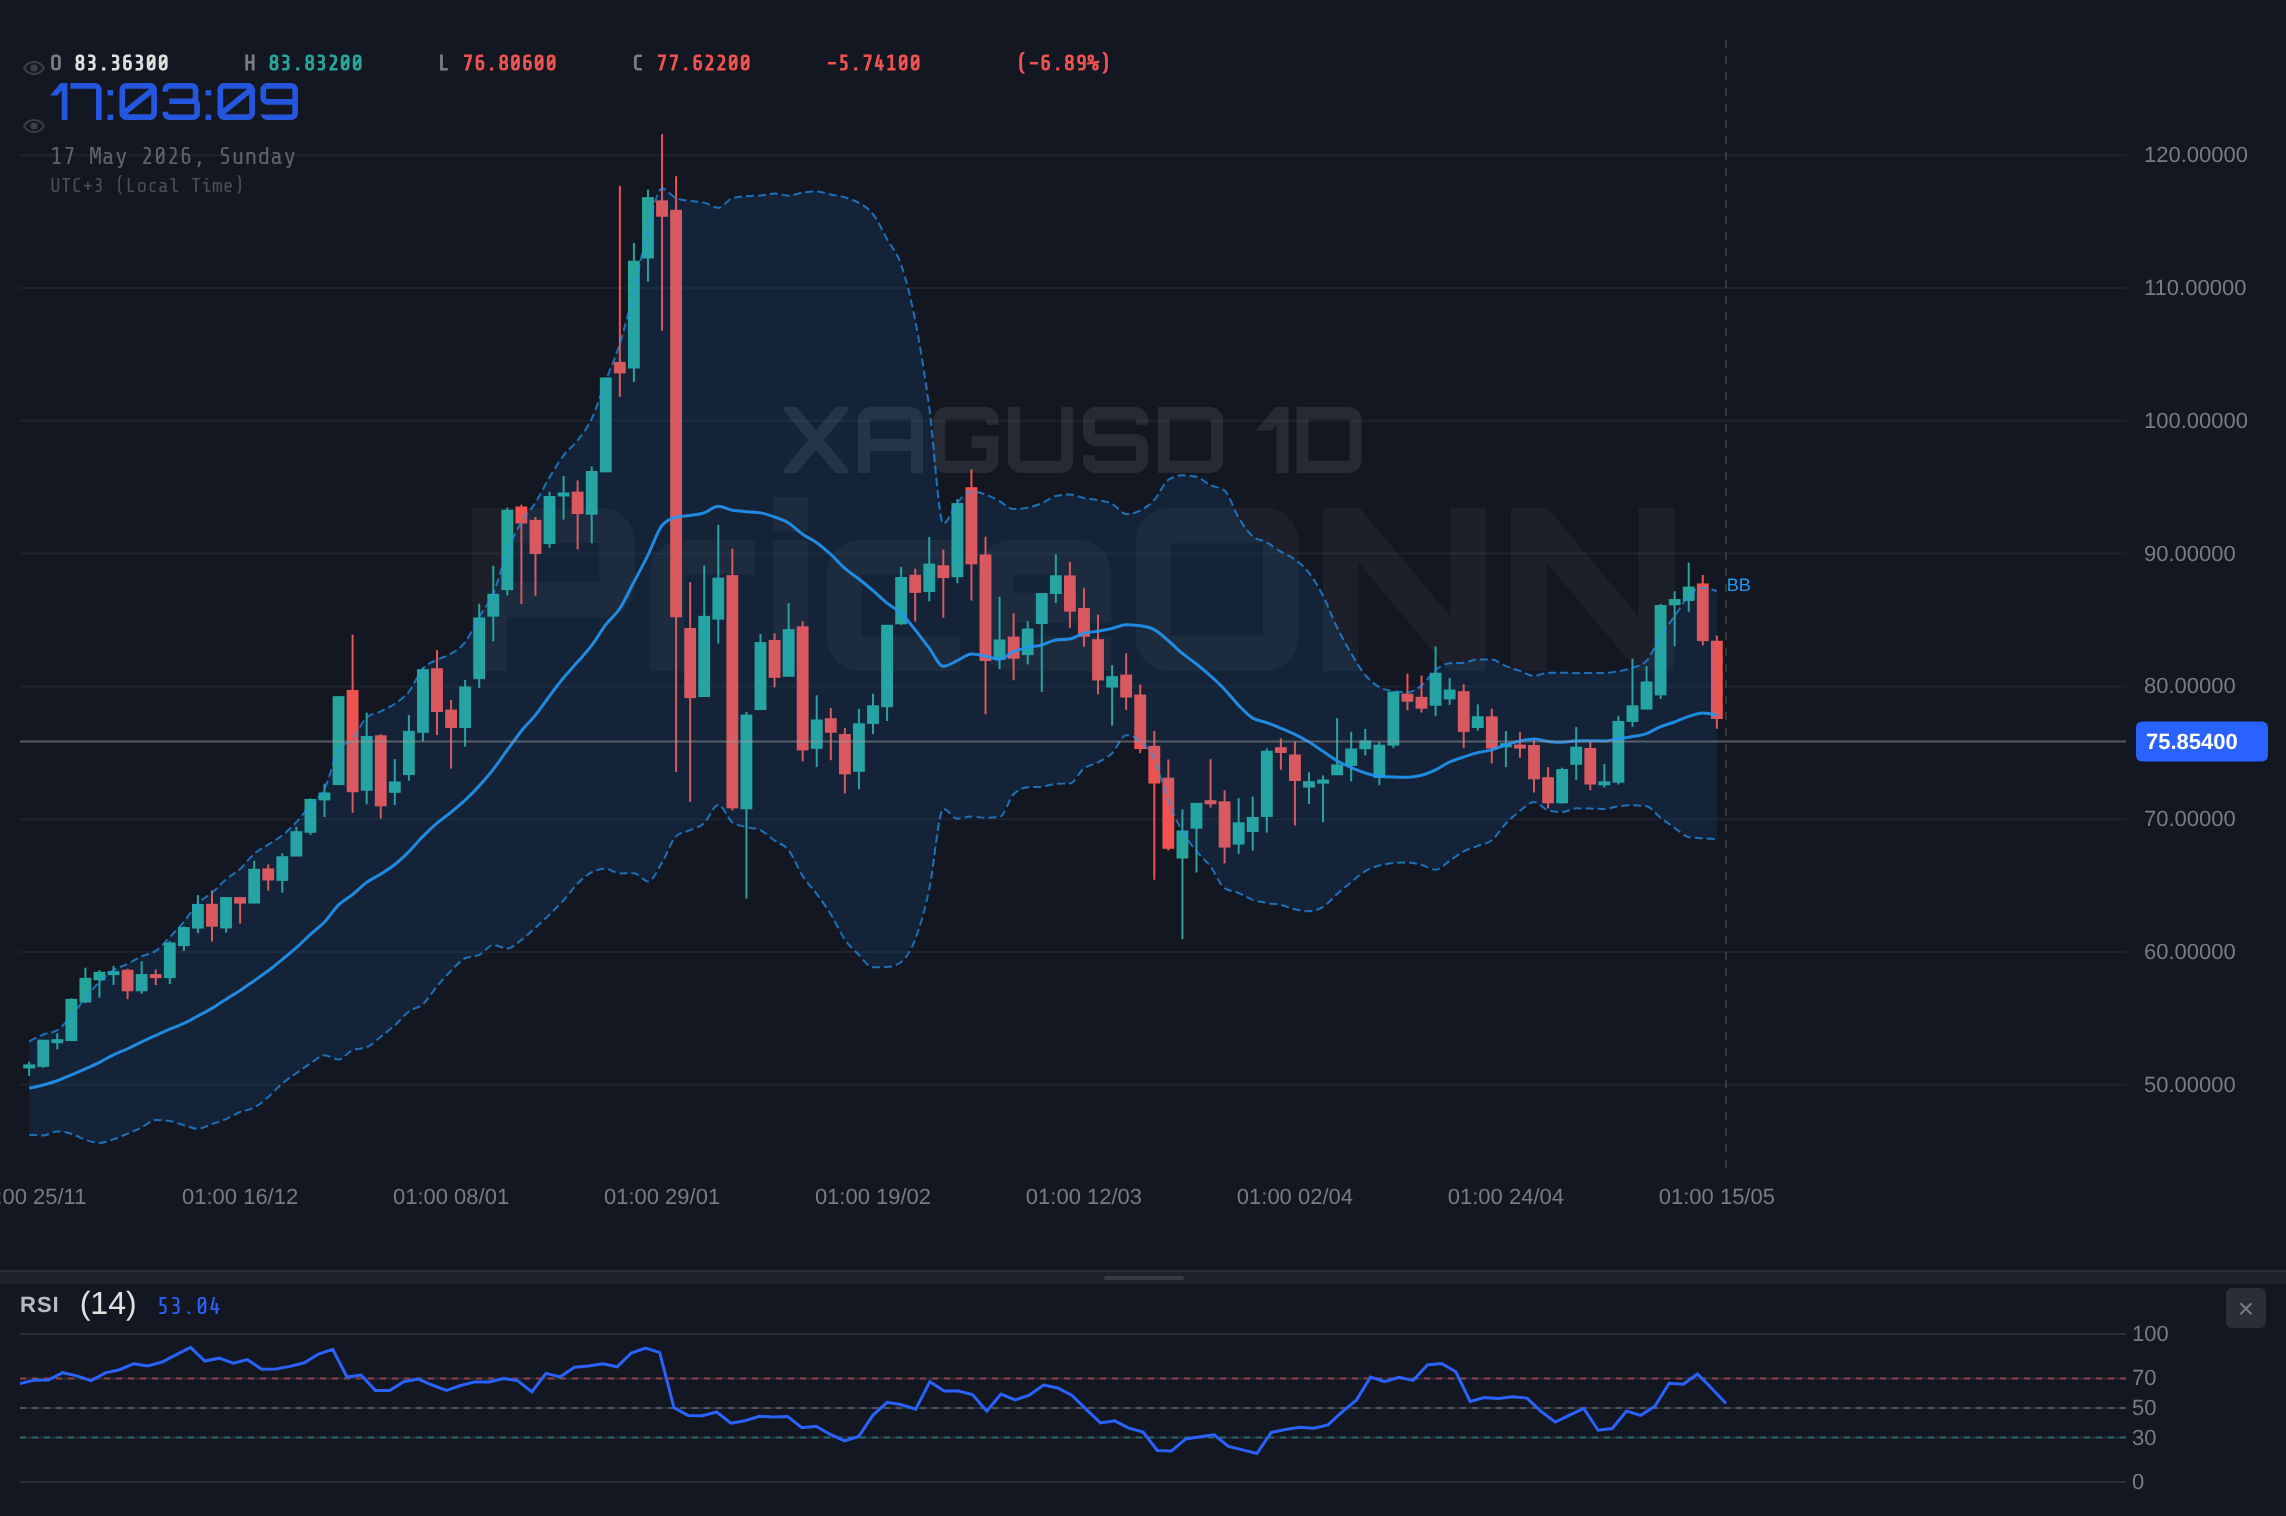
Silver is trading at 75.858, exhibiting strong bearish sentiment on shorter timeframes, with 1H and 4H RSI values at 24.6 and 26.0, respectively. The daily RSI at 46.0 is neutral but leaning bearish. Stochastic %K on the 4H chart at 3.5 is extremely oversold. The key levels for Silver are
Resistance
Price
R3
92.210
R2
90.300
R1
86.900
Pivot
84.990
Support
Price
S1
81.580
S2
79.680
S3
76.270
Fib 61.8%
78.880
. A break below S2 at 79.680 could see a test of S3 at 76.270. Immediate resistance will be found at the pivot (84.990) and R1 (86.900). The prevailing SELL signal, with a 91% Buy sentiment strength, indicates a significant divergence. Similar to gold, a technical rebound is possible from oversold conditions, but a sustained upward move will depend on broader market sentiment and a potential weakening of the US Dollar. Watch for price action around the 76.00 level.
BRENT crude is trading at 111.85, showing strong bullish momentum across all analyzed timeframes. The daily RSI at 56.0 is in positive territory, and the 4H RSI at 61.6 indicates solid buying pressure. Stochastic %K on the 4H chart at 88.7 is nearing overbought conditions, suggesting a potential for consolidation or a minor pullback. The key levels are
Resistance
Price
R3
114.01
R2
111.97
R1
110.69
Pivot
108.65
Support
Price
S1
107.37
S2
105.33
S3
104.05
Fib 61.8%
96.21
. A push above R2 at 111.97 could target R3 at 114.01. Support can be found at the pivot (108.65) and S1 (107.37). The consistent BUY signals and 80% Buy sentiment strength confirm the bullish outlook. Any pullbacks are likely to be viewed as buying opportunities, especially if geopolitical tensions or supply concerns persist. Traders will be watching for continued strength above the 110.00 mark.
WTI crude is trading at 105.22, exhibiting strong bullish momentum similar to BRENT. The daily RSI at 57.3 is positive, and the 4H RSI at 67.1 indicates robust buying interest. Stochastic %K on the 4H chart at 93.0 is in overbought territory, suggesting a pause or minor correction is possible. The key levels for WTI are
Resistance
Price
R3
105.98
R2
104.10
R1
103.04
Pivot
101.16
Support
Price
S1
100.10
S2
98.22
S3
97.16
Fib 61.8%
92.99
. A move above R3 at 105.98 could extend the rally. Support levels are at the pivot (101.16) and S1 (100.10). The prevailing BUY signals and 80% Buy sentiment strength reinforce the bullish view. Given the strong upward trend, dips are likely to be shallow and attract buyers. The market will remain sensitive to supply disruptions and geopolitical events that could further support prices.
Bitcoin is trading at 78,220, showing a mixed technical picture. The daily RSI at 49.1 is neutral, while the 1H and 4H RSIs are leaning bearish (44.8 and 38.0, respectively). Stochastic %K on the 4H chart at 26.8 suggests it is approaching oversold territory. The key levels to watch are
Resistance
Price
R3
83,973
R2
82,820
R1
80,974
Pivot
79,821
Support
Price
S1
77,975
S2
76,822
S3
74,976
Fib 61.8%
71,820
. A failure to hold S1 at 77,975 could lead to a test of S2 at 76,822. Resistance is seen at the pivot (79,821) and R1 (80,974). The predominant SELL signal, coupled with an 83% Sell sentiment strength, indicates short-term bearish pressure. However, the neutral daily RSI and approaching oversold conditions on the 4H chart suggest a potential for stabilization or a bounce if key support levels hold. Traders will be watching for any catalyst that could shift sentiment, such as regulatory news or broader market risk appetite.
Ethereum is trading at 2,191.50, displaying a predominantly bearish technical setup on medium to longer timeframes. The daily RSI at 40.1 is bearish, and the 4H RSI at 36.6 also indicates weakness. Stochastic %K on the daily chart at 18.9 is approaching oversold territory. The key levels are
Resistance
Price
R3
2,373.89
R2
2,336.61
R1
2,277.17
Pivot
2,239.89
Support
Price
S1
2,180.45
S2
2,143.17
S3
2,083.73
Fib 61.8%
2,136.62
. A break below S1 at 2,180.45 could target S2 at 2,143.17. Resistance will be encountered at the pivot (2,239.89) and R1 (2,277.17). The consistent SELL signals and 100% Sell sentiment strength suggest that downside risks remain elevated. A bounce from oversold conditions is possible, but a sustained recovery will likely require a significant shift in market sentiment or positive developments in the Ethereum ecosystem.
The S&P 500 is trading at 6,573, showing a mixed technical picture. The daily RSI at 45.4 is neutral, leaning bearish, while the 4H RSI at 62.8 indicates some buying interest. Stochastic %K on the 4H chart at 97.9 is extremely overbought, suggesting a potential for a pullback. The key levels to watch are
Resistance
Price
R3
6,833
R2
6,686
R1
6,605
Pivot
6,458
Support
Price
S1
6,377
S2
6,231
S3
6,150
Fib 61.8%
6,744
. A rejection from R1 at 6,605 could lead to a test of the pivot at 6,458. Support levels are at S1 (6,377) and S2 (6,231). The mixed signals and 80% Buy sentiment strength suggest that the index might be consolidating. Upcoming economic data and Fed commentary will be crucial in determining the next direction. Traders should watch for a potential test of the 6,600 level.
The Nasdaq 100 is trading at 29,073, showing significant bearish pressure on shorter timeframes. The daily RSI at 70.2 is in overbought territory, but the 1H and 4H RSIs (34.1 and 45.9) indicate a pullback. Stochastic %K on the 4H chart at 10.8 is deeply oversold. The key levels are
Resistance
Price
R3
30,062
R2
29,869
R1
29,726
Pivot
29,534
Support
Price
S1
29,391
S2
29,199
S3
29,056
Fib 61.8%
25,417
. A break below S1 at 29,391 could target S2 at 29,199. Resistance will be faced at the pivot (29,534) and R1 (29,726). The predominant SELL signal, despite a 5/2/0 Buy/Sell/N reading on the daily, indicates that while the longer-term trend may still be bullish, short-term weakness is evident. The 80% Sell sentiment strength reinforces this. Traders will be monitoring the 29,000 level for potential support.
The Dow Jones 30 is trading at 49,402, showing a mixed technical picture with bearish undertones on shorter timeframes. The daily RSI at 54.0 is neutral, but the 1H and 4H RSIs (28.1 and 38.1) suggest weakness. Stochastic %K on the 4H chart at 24.9 is approaching oversold territory. The key levels are
Resistance
Price
R3
50,665
R2
50,431
R1
50,248
Pivot
50,014
Support
Price
S1
49,831
S2
49,597
S3
49,414
Fib 61.8%
46,866
. A break below S2 at 49,597 could expose S3 at 49,414. Resistance will be encountered at the pivot (50,014) and R1 (50,248). The predominantly SELL signal on shorter timeframes, despite a 90% Buy sentiment strength, suggests that the index might be vulnerable to further declines. Traders will be watching for a hold of the 49,500 level as crucial support.
Economic Calendar Preview
US CPI (Wednesday, May 20, 2026 12:30 UTC)
Forecast: 0.3% | Previous: 0.2%
Scenario
Condition
Expected Impact
Better than expected
Actual > 0.3%
USD strengthens - Higher inflation could pressure the Fed to maintain a hawkish stance or delay rate cuts.
In line with forecast
Actual ≈ 0.3%
Neutral reaction
Worse than expected
Actual < 0.3%
USD weakens - Lower inflation might reinforce expectations for Fed rate cuts, potentially weakening the dollar.
US FOMC Meeting Minutes (Wednesday, May 20, 2026 18:00 UTC)
Forecast: N/A | Previous: N/A
Scenario
Condition
Expected Impact
Hawkish Tone
Minutes reveal concerns about inflation and a reluctance to cut rates
USD strengthens - Markets will price in delayed or fewer rate cuts.
Dovish Tone
Minutes suggest concerns about economic slowdown and openness to rate cuts
USD weakens - Markets will price in faster or more significant rate cuts.
Neutral/Mixed Tone
Minutes show divided opinions or focus on data dependence
Neutral reaction, volatility may increase as traders dissect the details.
Canadian CPI (Tuesday, May 19, 2026 12:30 UTC)
Forecast: 3.1% | Previous: 2.9%
Scenario
Condition
Expected Impact
Better than expected
Actual > 3.1%
CAD strengthens - Higher inflation could lead the Bank of Canada to maintain a hawkish stance on rates.
In line with forecast
Actual ≈ 3.1%
Neutral reaction
Worse than expected
Actual < 3.1%
CAD weakens - Lower inflation may prompt the Bank of Canada to consider a more dovish monetary policy.
Weekly Trading Bias
The upcoming week presents a complex trading environment, heavily influenced by inflation data and central bank signals. Risk Appetite: Mixed to Cautious. Commodities, particularly oil, are showing strength, which could support riskier assets if sustained. However, persistent inflation concerns and uncertainty around Fed policy could temper broad risk appetite.
US Dollar: Neutral to Slightly Bullish. The DXY is at a critical resistance level. Incoming US inflation data and FOMC minutes will be key determinants. A hawkish surprise could see the dollar push higher, while a dovish outcome might lead to a correction.
Forex Majors: Bearish bias on EUR/USD and GBP/USD, Bullish on USD/JPY. The weakness in EUR and GBP, coupled with USD strength, suggests a continued bearish trend for these pairs, barring significant data surprises. USD/JPY's bullish momentum is expected to persist, though overbought conditions warrant caution.
Precious Metals: Potential for short-term bounce, but underlying bearish pressure. Gold and Silver are deeply oversold on shorter timeframes, increasing the probability of a technical rebound. However, the prevailing SELL signals and strong US Dollar suggest that any rallies may face headwinds unless macro sentiment shifts significantly.
Energy Markets: Bullish bias. Brent and WTI crude oil continue to show strong upward momentum, supported by supply concerns and geopolitical factors. Pullbacks are likely to be temporary, with upside potential remaining if current trends hold.
Cryptocurrencies: Cautious/Neutral. BTC and ETH are showing mixed to bearish signals on shorter timeframes, with approaching oversold conditions in some instances. Sentiment remains largely bearish. A catalyst is needed for a sustained recovery.
Stock Indices: Mixed. S&P 500 and Dow Jones show mixed signals, while Nasdaq 100 exhibits short-term bearish pressure despite longer-term bullish indications. Inflation data and Fed outlook will heavily influence sentiment towards equities.
Disclaimer: This content is for informational and educational purposes only and does not constitute investment advice, financial recommendation, or an offer to buy or sell any financial instrument. Past performance does not guarantee future results. Always do your own research and consult a licensed financial advisor before making investment decisions.
Track markets in real-time
AI-powered analysis, technical indicators and real-time price data.
We are looking for writers who produce market analysis, macro commentary, and data-driven content. Reach readers in 10 languages through our multilingual publishing platform.