
WTI Crude Oil Tests $107.01 Amid Renewed Stagflation Fears and Geopolitical Tensions
WTI crude oil hovers around $107.01 as traders weigh renewed geopolitical risks and stagflationary concerns, with key support at $105.77 and resistance at $111.36.
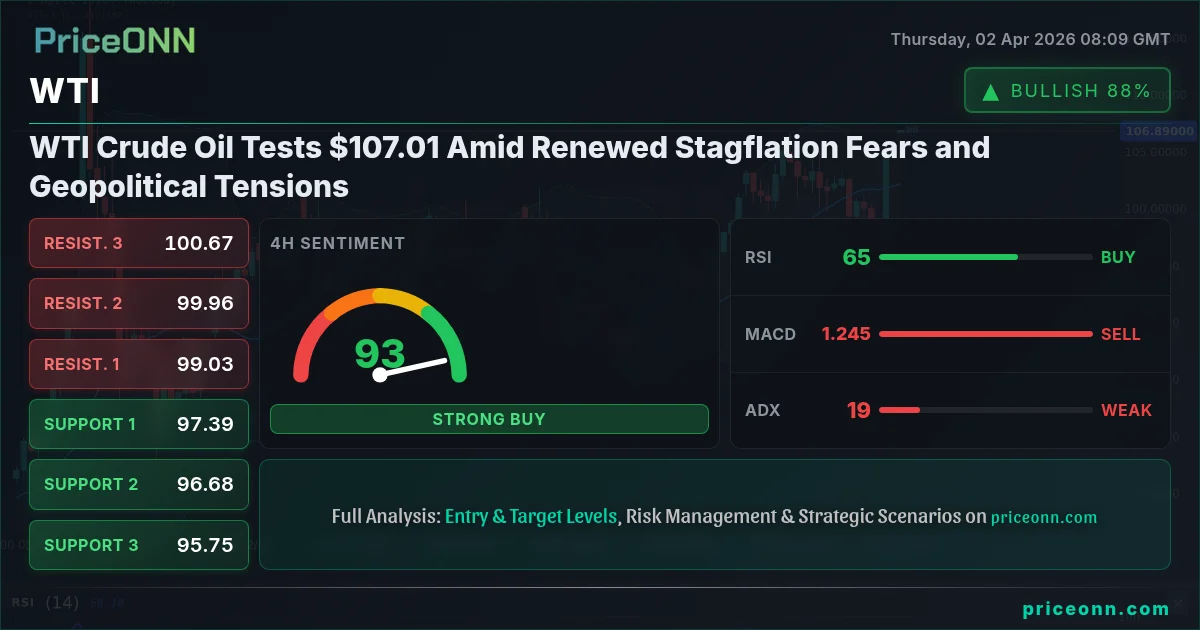
The relentless surge in WTI crude oil prices, now testing the critical $107.01 mark, paints a vivid picture of a market grappling with a potent cocktail of escalating geopolitical tensions and persistent stagflationary fears. This dramatic ascent, which saw WTI gain a staggering 8.13% on the day to reach $107.01, is not merely a reaction to immediate headlines but a reflection of deeper, systemic pressures building across the global economic landscape. The energy sector's outperformance against the S&P 500, widening to historic margins, underscores the seismic shifts occurring, driven by factors that threaten to reshape economic outlooks and investment strategies for months to come. As traders digest President Trump's latest rhetoric and the implications for oil supply chains, the question on everyone's mind is whether this rally has legs or if it's a precursor to a broader market recalibration.
- WTI crude oil is trading at $107.01, up 8.13% today, driven by geopolitical escalation and stagflation fears.
- Critical support for WTI is identified at $105.77, while resistance looms at $111.36 according to current data.
- The ADX at 26.48 on the 1H chart indicates a strong uptrend, but the Stochastic Oscillator in the overbought zone suggests caution.
- Correlations are key: A rising DXY (currently at 99.89) typically pressures oil, but geopolitical events are currently overriding this dynamic.
Navigating the Storm: Geopolitical Drivers Fueling the WTI Rally
The immediate catalyst for WTI's impressive surge appears to be a renewed escalation in geopolitical tensions, particularly concerning the Middle East. Reports indicate that President Trump's recent address has dashed hopes of de-escalation, reigniting fears of potential supply disruptions. This heightened risk premium is palpable in the energy markets, with Brent crude also experiencing a significant rally, nearing $110 per barrel. The energy sector's remarkable outperformance, widening its lead over the S&P 500 to historic levels, is a direct consequence of these geopolitical anxieties. It signifies a market environment where energy security and supply stability are paramount, overshadowing broader economic concerns. This isn't just about oil prices; it's about the potential for wider conflict and its ripple effects on global trade, inflation, and economic growth. The market is pricing in a scenario where energy supply could become even more constrained, pushing prices higher irrespective of typical demand-side indicators.
This geopolitical backdrop is particularly potent because it directly impacts the supply side of the oil equation. Any perceived threat to major oil-producing regions, especially the Middle East, immediately translates into a risk premium added to crude prices. Traders are quick to price in the possibility of production cuts, transit disruptions, or outright conflict. The current situation, fueled by hawkish rhetoric, suggests that the market is anticipating a prolonged period of elevated risk. This contrasts sharply with periods where oil prices might be more sensitive to global demand forecasts or economic slowdowns. Here, the fear of scarcity is the dominant driver, creating a powerful upward momentum that technical indicators are now struggling to keep pace with, as evidenced by the strong uptrend signals across multiple timeframes.
The Stagflation Specter: Inflationary Pressures Meet Slowing Growth
Beyond the immediate geopolitical flares, the persistent specter of stagflation looms large over the global economy, and oil prices are a critical component of this narrative. Stagflation, a pernicious combination of stagnant economic growth and high inflation, creates a challenging environment for policymakers and investors alike. High energy prices are a primary driver of inflation, eroding purchasing power and increasing operational costs for businesses across all sectors. While the energy sector itself is thriving, the broader economy faces headwinds. The energy sector's historic outperformance is a symptom of this imbalance; it's booming precisely because energy is becoming more expensive, a factor that simultaneously chokes off growth in other areas. This dynamic creates a complex feedback loop: higher oil prices fuel inflation, which in turn could dampen economic activity, yet the very fear of supply shortages keeps pushing oil prices higher.
The data from the economic calendar, though sparse on high-impact releases in the immediate aftermath, consistently points towards underlying inflationary pressures. While specific figures for key economic indicators like PMI or inflation rates are not yet fully updated for the current period in the provided data, the historical context suggests that supply chain disruptions and geopolitical events have been keeping inflation elevated. This persistent inflation, coupled with signs of slowing global growth, forms the basis of stagflation concerns. For oil, this means that even if global demand were to weaken due to economic stagnation, the supply-side constraints and the inflationary impact of energy costs could still support higher prices. It's a scenario where traditional economic relationships, like the inverse correlation between oil prices and risk appetite, might break down, creating a more volatile and unpredictable market.
The confluence of rising energy prices and potential economic slowdown presents a significant risk. If stagflation takes hold, central banks face a difficult dilemma: fighting inflation with higher rates could further depress growth, while easing policy could exacerbate inflationary pressures. This uncertainty adds a layer of volatility to all risk assets, including WTI.
Intermarket Dynamics: DXY, Equities, and the Shifting Correlation Landscape
Understanding WTI's price action requires a keen eye on its correlations with other major markets. The US Dollar Index (DXY), currently trading around 99.89 and showing a strong upward trend on the daily timeframe, typically exerts downward pressure on oil prices. A stronger dollar makes dollar-denominated commodities like WTI more expensive for holders of other currencies, potentially dampening demand. However, the current market narrative appears to be overriding this conventional relationship. Despite the dollar's strength, WTI is surging, a testament to the overwhelming influence of geopolitical risk and inflation fears. This divergence highlights how exceptional circumstances can temporarily decouple assets from their usual correlations.
Similarly, the performance of equity indices like the S&P 500 and Nasdaq 100 provides crucial context. The S&P 500, currently showing a mixed picture with a daily gain but a strong downward trend on the daily chart, and the Nasdaq 100, experiencing a notable drop on the day, reflect a cautious risk sentiment. Historically, a decline in equities signals a 'risk-off' environment, which would typically benefit safe-haven assets and potentially weigh on riskier commodities like oil. Yet, WTI is exhibiting strength even as equities show weakness. This is further evidence of the exceptional drivers at play. The energy sector's record outperformance against the S&P 500 is a clear indicator that capital is flowing towards perceived inflation hedges and assets benefiting from supply-side shocks, rather than growth-oriented equities. This intermarket analysis suggests that while traditional risk sentiment indicators are flashing warning signs, the specific dynamics within the energy complex are creating a powerful, albeit potentially fragile, upward trend for WTI.
The current divergence between WTI's rally and a strengthening DXY, alongside weak equity performance, is unusual. This suggests that the market is prioritizing inflation hedges and geopolitical risk over traditional risk-on/risk-off sentiment or currency strength dynamics. Keep a close eye on DXY movements around 99.50 and the S&P 500's ability to hold above 6522.1 for clues.
Technical Picture: Bulls at the Helm, but Caution Advised
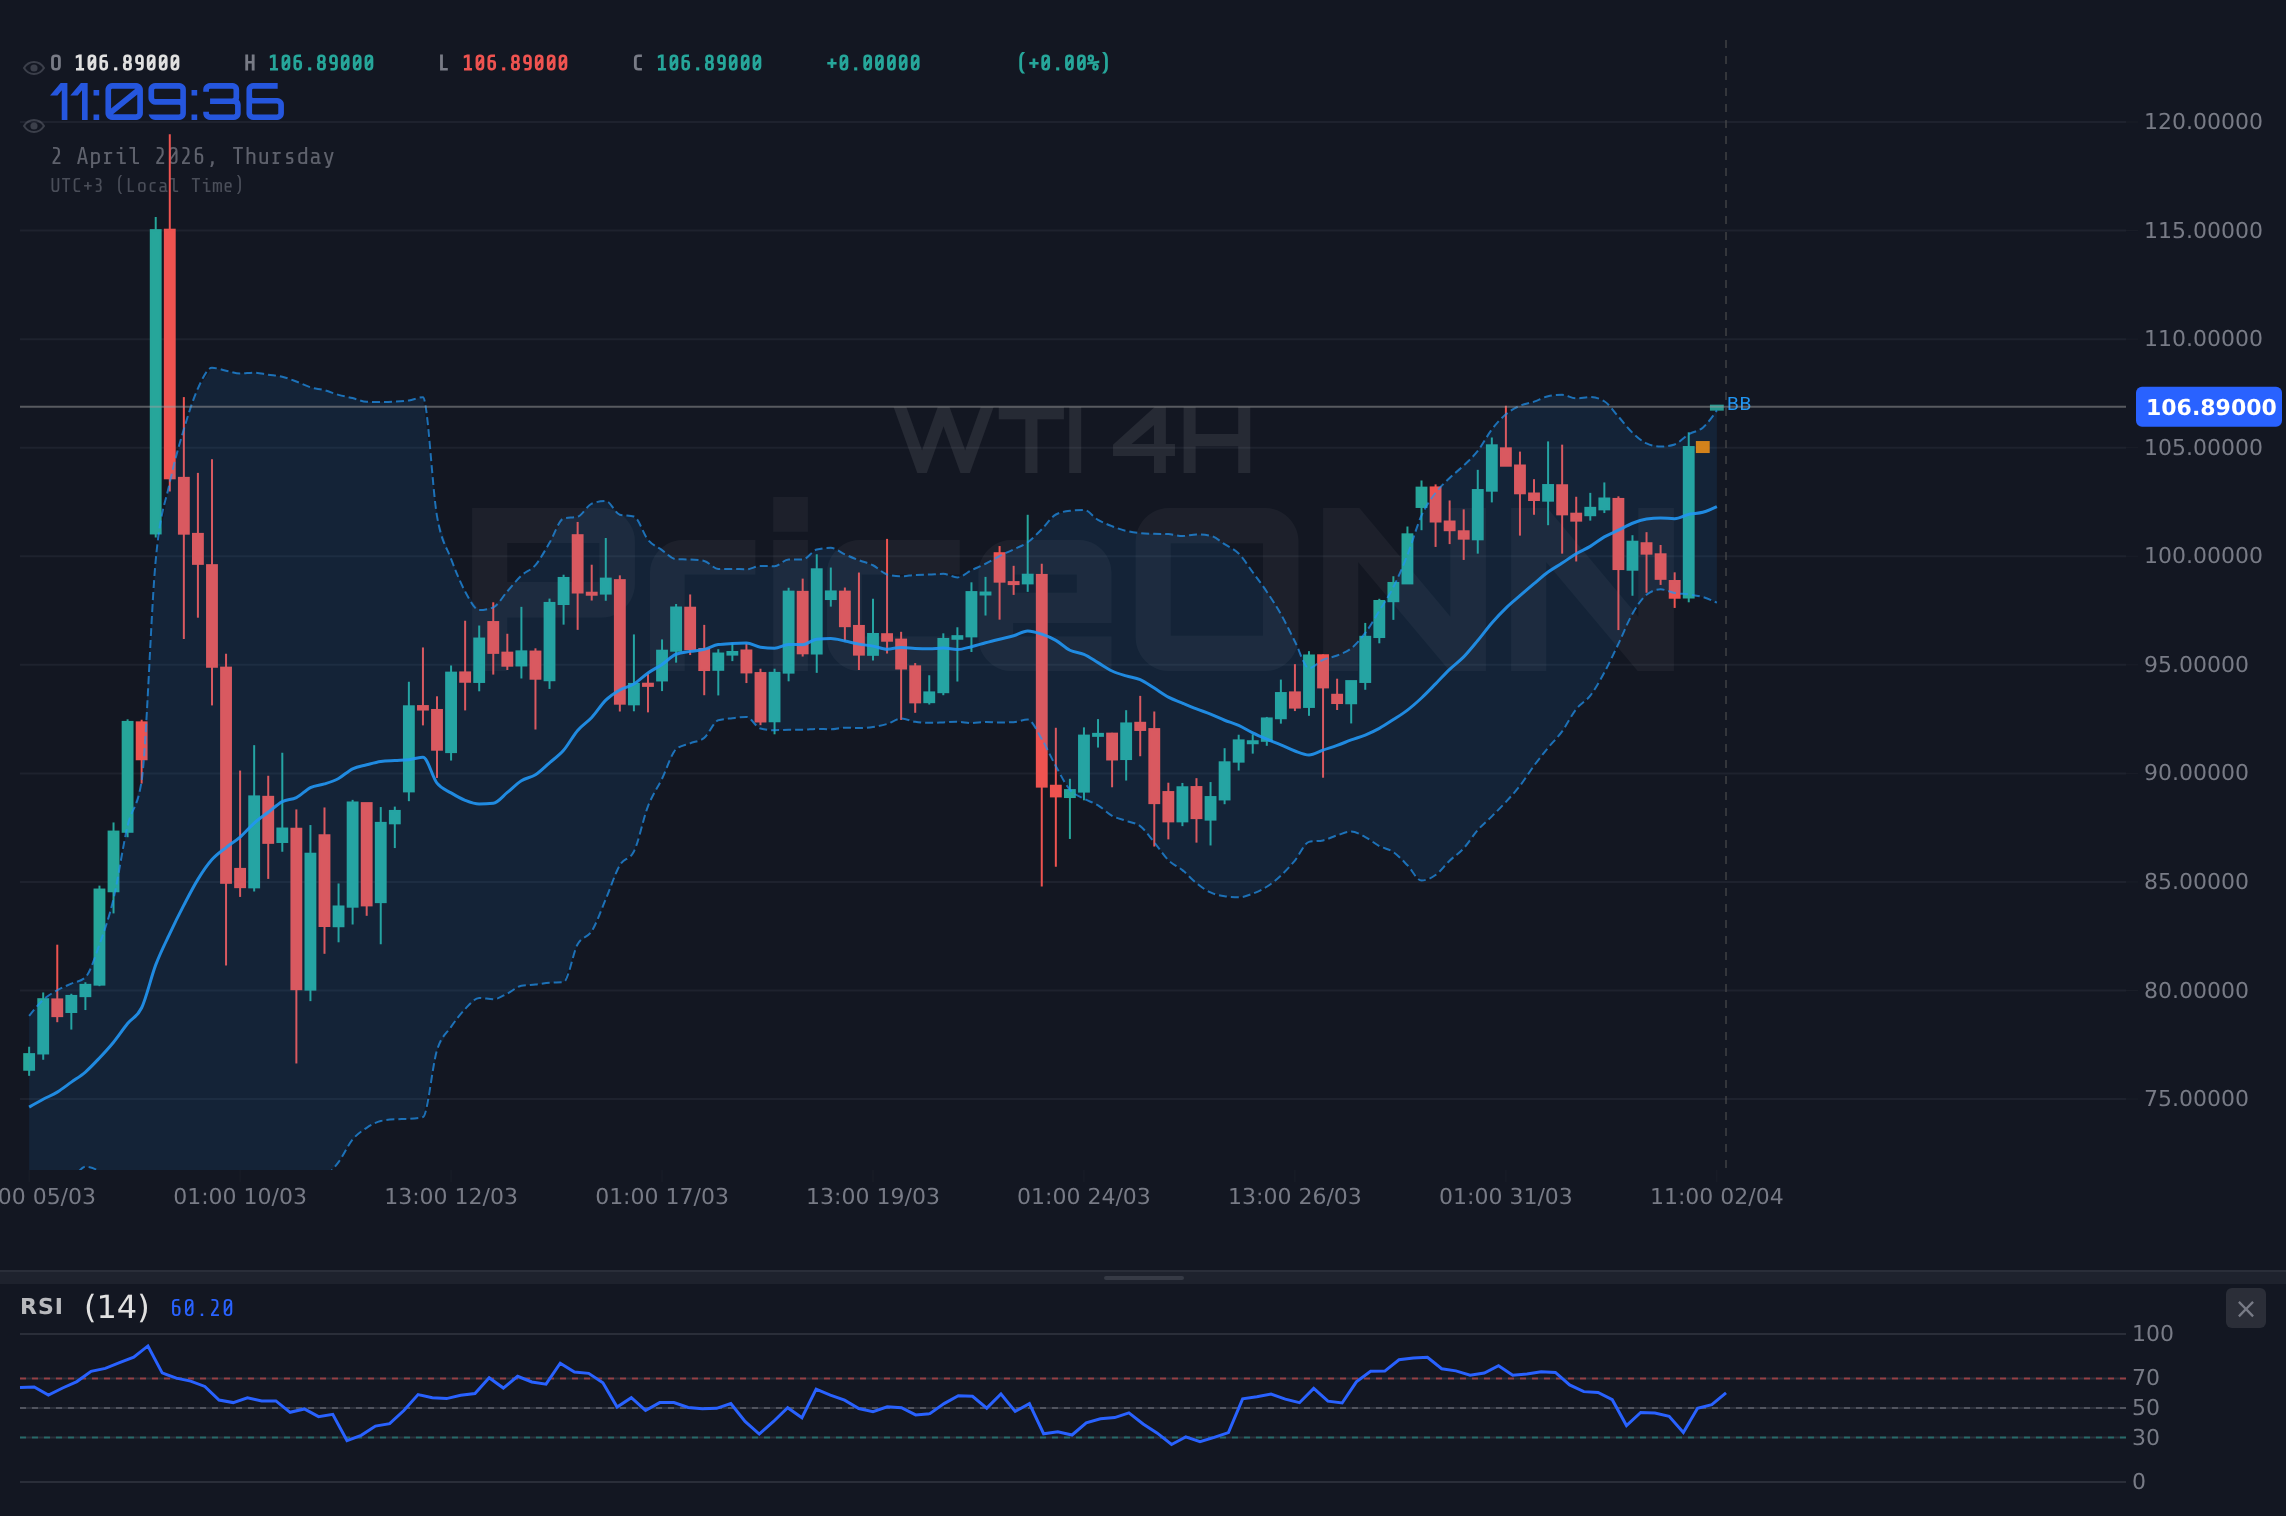
The technical indicators for WTI present a somewhat mixed, yet predominantly bullish, short-to-medium term picture, underscored by a strong daily trend. On the 1-hour chart, the ADX at 26.48 confirms a strong uptrend, and the RSI at 69.53 is in bullish territory, nearing overbought conditions. The Stochastic Oscillator, with K at 97.53 and D at 90.34, is firmly in the overbought zone, signaling that the current momentum might be unsustainable in the very short term and a pullback could be imminent. Bollinger Bands on this timeframe are also showing the price pushing above the middle band, supporting the bullish sentiment.
Diving into the 4-hour timeframe, the picture remains bullish, though with some conflicting signals. The ADX at 18.87 suggests a weaker trend, indicating that the momentum might not be as committed as on the 1-hour chart. However, the RSI at 65.34 is still in bullish territory, and the Stochastic Oscillator (K=48.2, D=37.52) shows a bullish crossover, indicating potential for further upside. The price is trading above the middle Bollinger Band, reinforcing the upward bias. On the daily chart, the trend is unequivocally bullish with a power of 100%, and the ADX at 58.52 signals a very strong trend. The RSI at 64.5 is comfortably in bullish territory, and the Stochastic Oscillator (K=56.27, D=47.58) shows a bullish crossover. The price is above the middle Bollinger Band, indicating sustained upward momentum. The confluence of strong daily trend strength and bullish signals across multiple indicators suggests that the path of least resistance, technically speaking, is upwards, despite the overbought readings on shorter timeframes.
Scenario Analysis: Charting the Path Forward for WTI
Bullish Scenario: The Supply Shock Narrative Intensifies
60% ProbabilityBearish Scenario: Geopolitical Fears Subside, Demand Concerns Re-emerge
25% ProbabilityNeutral Scenario: The Waiting Game Amidst Uncertainty
15% ProbabilityWhat I'm Watching This Week: Key Triggers for WTI
As we navigate this volatile energy market, several key factors will dictate the trajectory of WTI prices. Firstly, the geopolitical narrative remains paramount. Any further escalation or de-escalation in the Middle East will directly influence the risk premium embedded in oil prices. Market participants will be scrutinizing statements from major global powers and observing any shifts in military postures. Secondly, the upcoming economic data releases, particularly those related to inflation and growth, will be crucial. Persistent high inflation, coupled with sluggish economic activity, could reinforce stagflation fears, potentially supporting oil prices as an inflation hedge. Conversely, signs of a significant economic slowdown could eventually dampen demand expectations, even amidst supply concerns.
Technically, the $107.01 level itself is a focal point. A failure to hold this price, especially with a decisive break below the 1H support at $105.77, would signal a potential reversal. Conversely, a strong hold above $107.01, followed by a clear push above the 1H resistance at $111.36, would confirm the continuation of the bullish trend. The Stochastic Oscillator on the 1H chart currently sits in overbought territory, suggesting that a short-term pullback is possible, even within a broader uptrend. Therefore, traders should watch for consolidation or a minor dip as a potential entry opportunity if the fundamental drivers remain supportive, rather than chasing the price higher in the immediate term. The strength of the daily trend, however, suggests that any pullbacks might be shallow and short-lived if geopolitical risks persist.
Frequently Asked Questions: WTI Analysis
What happens if WTI breaks decisively below the $105.77 support level?
A sustained break below $105.77 on the 1-hour chart would invalidate the immediate bullish scenario, suggesting that demand concerns or a reduction in geopolitical risk premium are beginning to dominate. This could trigger a move towards the next support at $104.87, as traders reassess the market's risk appetite.
Should I buy WTI at current levels around $107.01 given the overbought Stochastic signal?
Entering at current levels carries risk due to the overbought Stochastic on the 1H chart. A more prudent approach might be to wait for a slight pullback towards the $105.77 support, or confirmation of a break above the $111.36 resistance, to ensure better risk-reward.
Is the RSI at 69.53 on the 1H chart a sell signal for WTI right now?
An RSI of 69.53 is approaching overbought territory but is not yet an outright sell signal, especially given the strong daily uptrend. It indicates bullish momentum is strong but potentially unsustainable in the immediate short term, suggesting caution rather than an immediate reversal trade.
How will continued geopolitical tensions in the Middle East affect WTI prices this week?
Continued or escalating tensions will likely keep the risk premium elevated for WTI, supporting prices above $107.01 and potentially driving them towards the $111.36 resistance. Any signs of de-escalation, however, could lead to a sharp sell-off as the risk premium is unwound.
| Indicator | Value | Signal | Interpretation |
|---|---|---|---|
| RSI (14) | 69.53 | Bullish | Approaching overbought, but strong uptrend intact. |
| MACD Histogram | +0.65 | Bullish | Positive momentum continues. |
| Stochastic | K:97.53, D:90.34 | Overbought | Short-term pullback risk high. |
| ADX | 26.48 | Strong Trend | Uptrend is well-established. |
| Bollinger Bands | Price above Middle Band | Bullish | Confirms upward momentum. |
Track markets in real-time
AI-powered analysis, technical indicators and real-time price data.
Join Our Telegram Channel
Breaking market news, AI analysis and trading signals instantly.
Join Channel