
WTI Crude Oil Tests $114.64 Resistance Amid Escalating Iran Tensions
WTI Crude Oil is trading at $114.64, facing resistance as geopolitical tensions in Iran escalate. Analysis suggests potential volatility ahead.
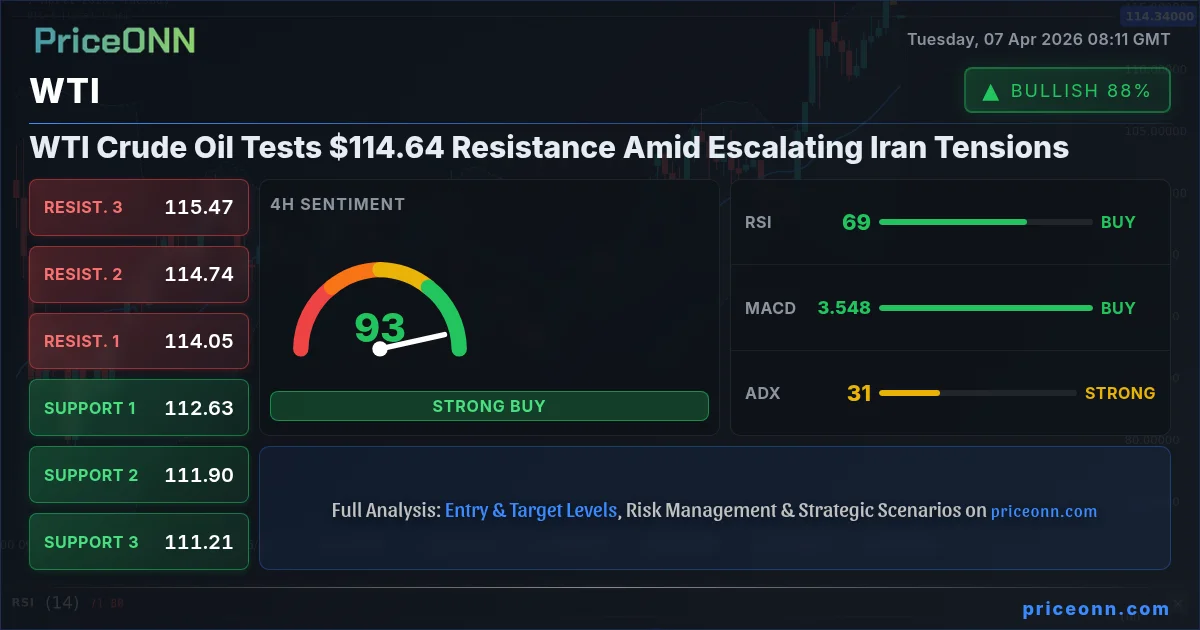
WTI Crude Oil is currently navigating a critical juncture, trading at $114.64 as geopolitical tensions surrounding Iran intensify. This price point represents a significant resistance level that traders are closely watching. The delicate balance between supply concerns, driven by escalating international friction, and broader market sentiment is creating a volatile environment for energy markets. Understanding the interplay between these fundamental factors and the technical indicators is key to navigating the potential price action in the coming days.
- WTI Crude Oil is trading at $114.64, testing key resistance levels.
- Geopolitical tensions in Iran are escalating, increasing supply risk premium.
- The ADX at 34.18 on the 1H chart indicates a strong upward trend, while the daily RSI at 71.54 suggests nearing overbought conditions.
- Key support for WTI is seen at $113.49, with resistance above $114.82.
- Market sentiment is influenced by the DXY's current level of 99.71 and broader risk appetite indicators.
Navigating the $114.64 Resistance Level
The current price of WTI Crude Oil at $114.64 is more than just a number; it's a battleground where bulls and bears are vying for control. This level is closely monitored by traders and analysts alike, as its breach or rejection could signal the next significant move. On the 1-hour chart, WTI is showing a robust uptrend with an ADX reading of 34.18, indicating strong momentum behind the current price action. However, the daily chart presents a slightly different picture. The RSI(14) is hovering at 71.54, a level often associated with overbought conditions. This divergence between the short-term trend strength and the longer-term overbought signal warrants caution. While the immediate pressure might be upwards, the potential for a pullback or consolidation increases as the market digests these conflicting signals.
The intraday price action on the 1-hour timeframe shows support levels at $114.52, $114.12, and $113.49. These are the zones where buyers have previously shown interest, and their ability to defend these levels will be crucial if the price faces downward pressure. Conversely, resistance looms above at $114.82, $115.18, and $115.55. A decisive break above $114.82, especially with strong volume, could open the door for further upside, potentially targeting the $115.55 mark. The Stochastic Oscillator on the 1-hour chart is currently in overbought territory, with %K at 82.41 and %D at 84.26, suggesting that a short-term pullback is plausible, even if the broader trend remains bullish. This interplay of indicators highlights the complexity of the current market environment for WTI.
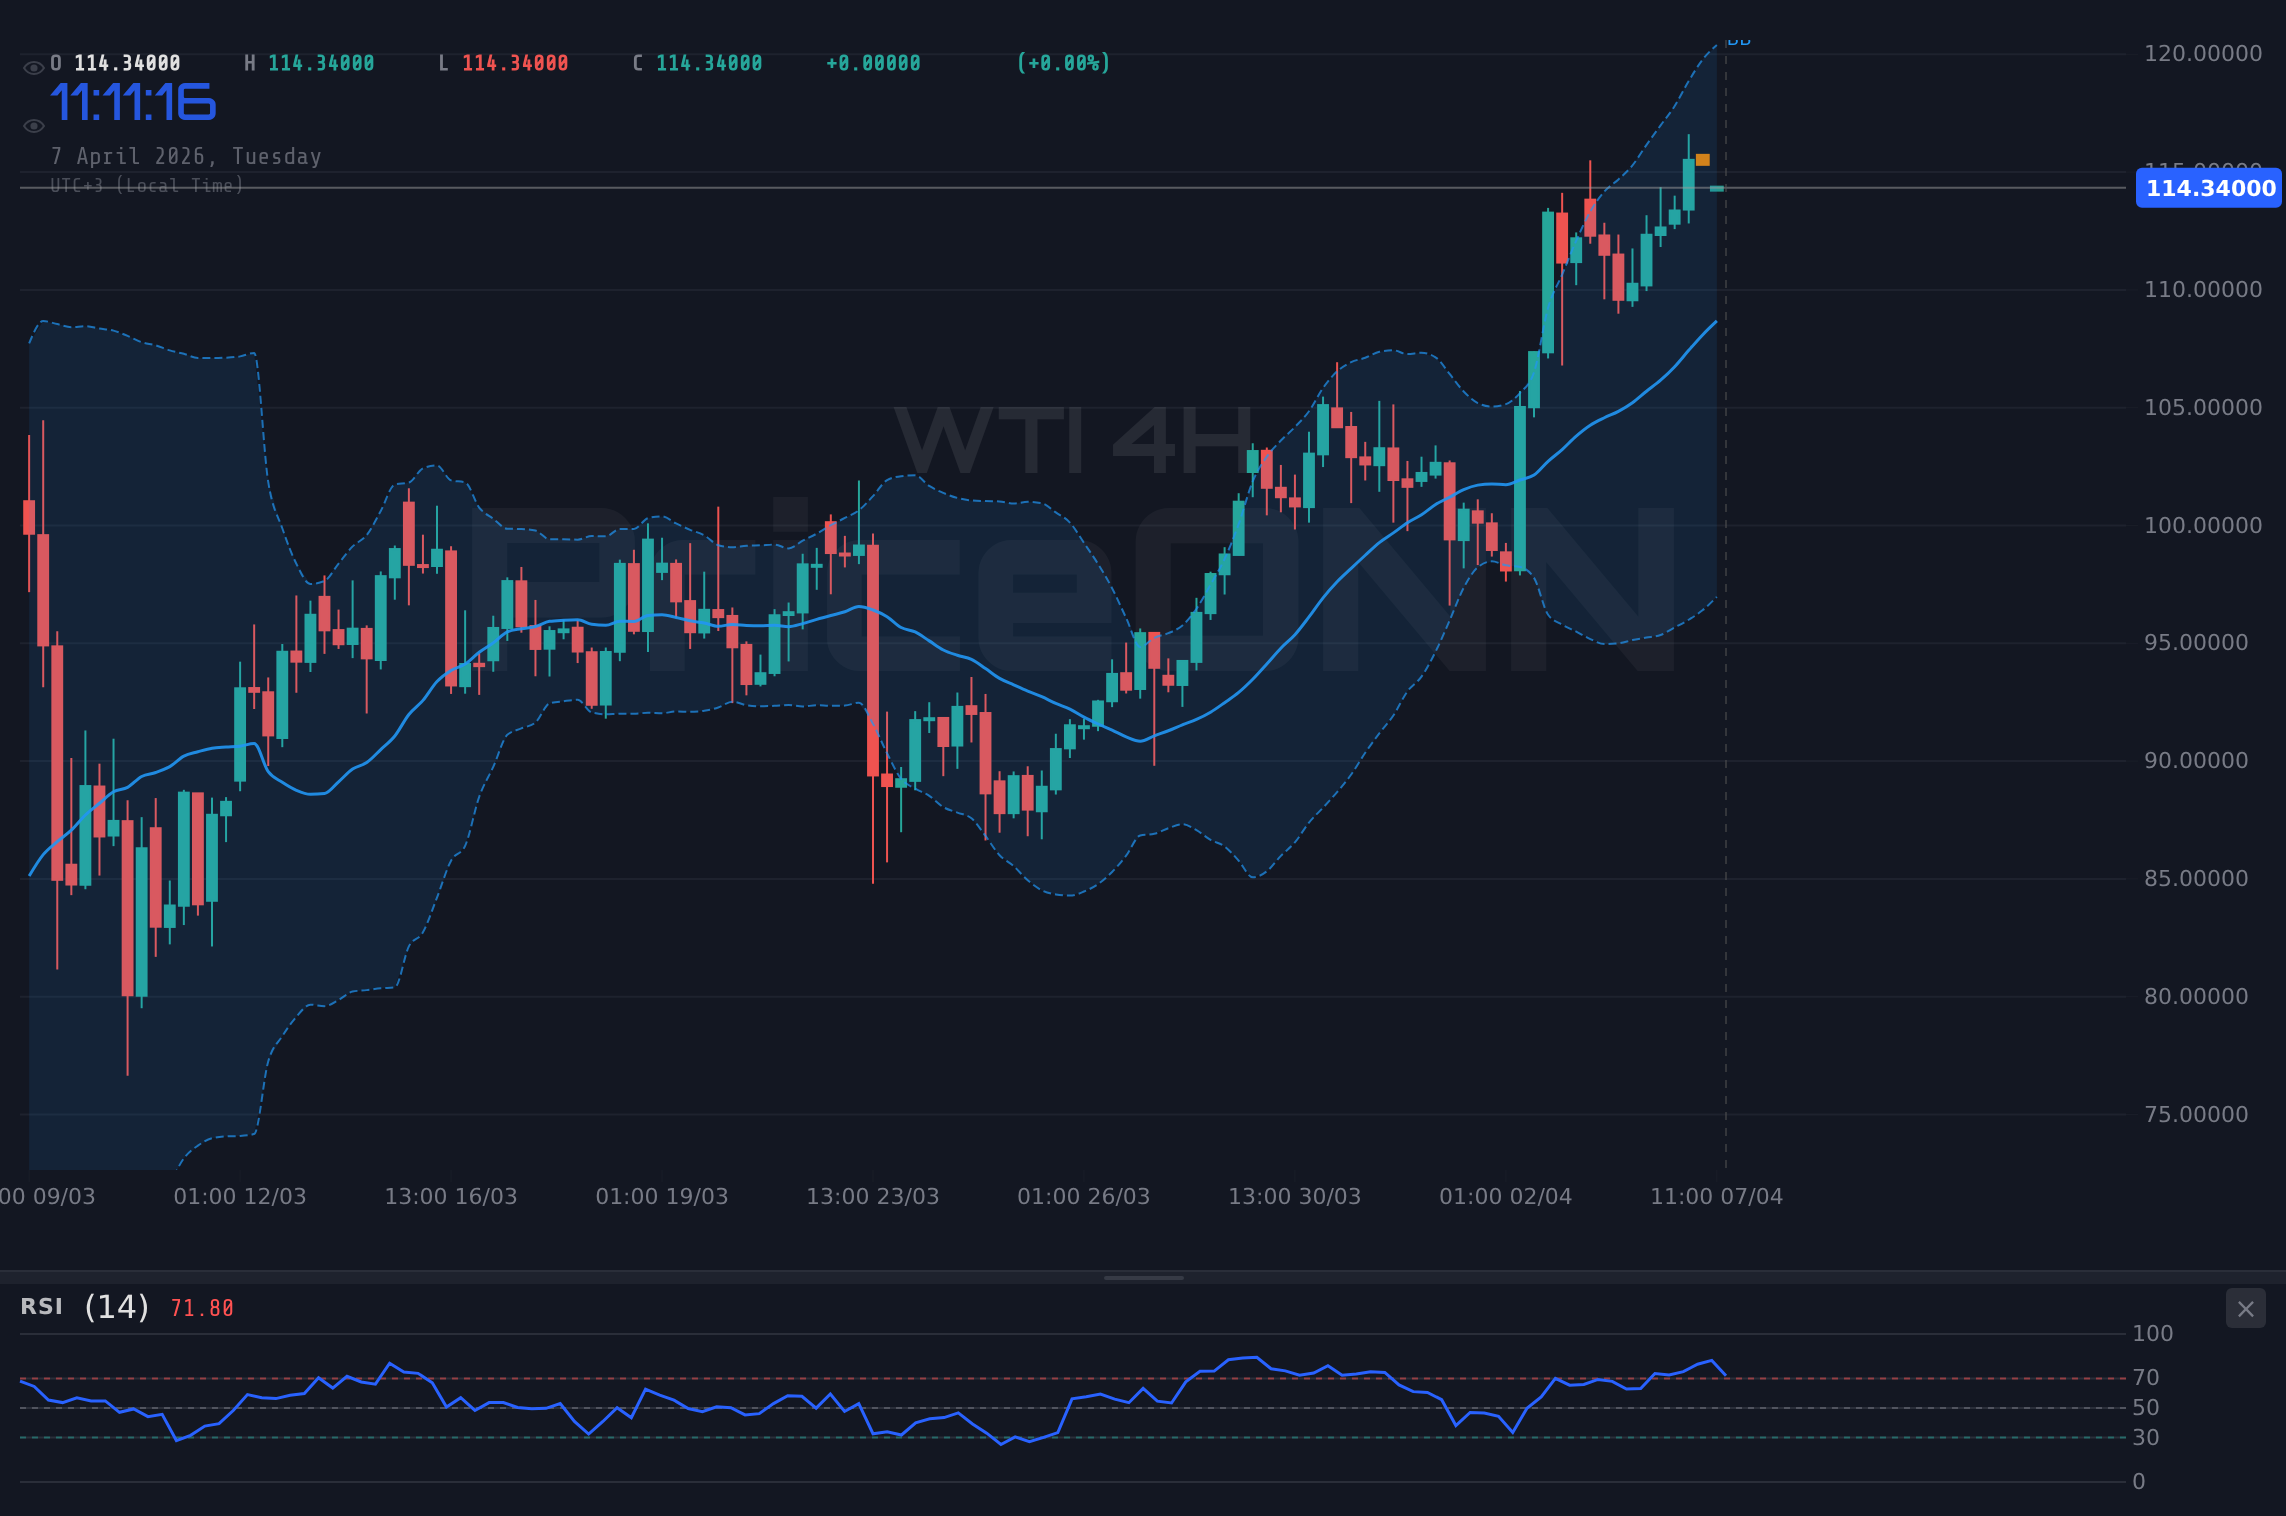
The 4-hour timeframe offers a slightly more consolidated view, with the ADX at 30.95 suggesting a strong trend is in play, albeit less aggressive than the 1-hour signal. The RSI here is at 69.52, still within the bullish zone but closer to the overbought threshold than the 1-hour chart. The Stochastic on this timeframe shows %K at 72.3 and %D at 71.6, also indicating a strong upward move with potential for a pause. The Bollinger Bands on both the 1-hour and 4-hour charts are above the middle band, reinforcing the prevailing bullish sentiment. However, the extremely high readings on the Stochastic and RSI on the daily chart cannot be ignored. This suggests that while the trend is undeniably bullish, the market might be due for a period of consolidation or a minor correction before the next significant leg higher, if one materializes.
Geopolitical Storm Clouds Gathering: The Iran Factor
The current rally in WTI Crude Oil is undeniably being fueled by escalating geopolitical tensions, particularly concerning Iran. Recent news reports highlight unusual trading activity in oil futures just before key geopolitical announcements and growing concerns about potential disruptions related to the Strait of Hormuz. This has injected a significant risk premium into oil prices, pushing WTI past the $105 resistance level and now testing the $114.64 mark. The market is pricing in the possibility of supply disruptions, which historically leads to sharp price increases. The uncertainty surrounding diplomatic efforts and potential military responses creates an environment where oil prices can react sharply to headlines.
Reuters has reported on the Fed's stance regarding inflation, noting that it remains 'stubbornly high'. This macro backdrop is crucial. Higher oil prices directly contribute to inflation, potentially complicating the Federal Reserve's monetary policy decisions. If the Fed is forced to maintain a more hawkish stance or delay interest rate cuts due to rising energy costs, it could dampen economic growth expectations. This, in turn, could eventually curb oil demand, creating a complex feedback loop. The current strength of the US Dollar Index (DXY), standing at 99.71, also plays a role. A stronger dollar generally makes dollar-denominated commodities like WTI more expensive for holders of other currencies, potentially acting as a headwind. However, the immediate fear-driven buying in oil seems to be overriding these typical correlations for now.
The correlation between oil prices and currency pairs like USD/JPY and EUR/USD is also noteworthy. As reported by forex news outlets, USD/JPY has surged past 160.00, partly fueled by rising oil prices and robust US employment data. This suggests that the inflationary impact of higher oil is contributing to a stronger dollar narrative against the Yen, especially with the Bank of Japan maintaining its accommodative stance. Conversely, EUR/USD is holding near 1.1530, with tensions around the Strait of Hormuz and anticipation of Fed minutes creating a mixed picture for the pair. The market is watching closely to see if the persistent rise in oil prices will force central banks to adjust their policy outlooks, which could have far-reaching implications across all asset classes.
The current price action in WTI is heavily influenced by a geopolitical risk premium. While this can lead to rapid price increases, it also means prices are vulnerable to sudden shifts if tensions de-escalate. Traders should be aware that the premium can evaporate quickly, leading to sharp reversals.
Technical Indicators: A Mixed Signal at the Peak?
Delving deeper into the technical indicators, we see a confluence of signals that, while largely bullish in the short-to-medium term, hint at potential caution. On the 1-hour chart, the MACD is showing negative momentum with the MACD line below its signal line, suggesting a potential slowdown in the bullish surge. However, the Stochastic Oscillator is exhibiting a bullish signal with %K (82.41) above %D (84.26), which seems contradictory. This can often occur in strong uptrends where oscillators can remain in overbought territory for extended periods. The Bollinger Bands are trading above the middle band, further supporting the bullish bias on this timeframe.
The situation on the 4-hour chart presents a similar dynamic. The MACD is still in positive momentum territory, but the Stochastic is showing a bearish crossover with %K (72.3) below %D (71.6), signaling a potential dip. The RSI at 69.52 remains strong but is nearing the overbought zone. The ADX on this timeframe is 30.95, indicating a strong trend. The daily chart, however, is where the most significant cautionary signals emerge. The RSI(14) stands at 71.54, clearly in overbought territory. This reading suggests that the recent rally may have extended too far, too fast, and a period of consolidation or a pullback is increasingly likely. The MACD on the daily chart is positive, and the Stochastic is showing a bullish signal (%K 91.71 > %D 64.42), but the extremely high RSI cannot be ignored. This suggests that while the long-term trend might still be upwards, the immediate risk of a correction is elevated.
The divergence between short-term bullish signals and longer-term overbought conditions on WTI is a classic sign of a market that might be due for a pause. While the geopolitical narrative provides a strong fundamental tailwind, technical exhaustion can still trigger a reversal. Traders looking to enter long positions might seek confirmation signals, such as a clear break above the $114.82 resistance with sustained volume, or a pullback to a key support level like $113.49 where buying interest might re-emerge. Conversely, those looking for shorting opportunities might wait for a definitive break below the $113.49 support, or a bearish divergence on shorter timeframes accompanied by weakening momentum.
When faced with conflicting signals across different timeframes, it's often prudent to adopt a risk-management-first approach. Consider scaling into positions or waiting for clearer confirmation from price action and volume. The ADX readings suggest a strong trend is present, but the RSI on longer timeframes warns of potential exhaustion.
The Broader Economic Landscape and WTI's Path Forward
Beyond the immediate geopolitical drivers, the broader economic landscape provides critical context for WTI's future trajectory. The Federal Reserve's stance on inflation and interest rates remains a paramount concern. With inflation proving 'stubborn,' as highlighted by recent reports, the Fed faces a dilemma. If oil prices continue to climb, it will exert further upward pressure on inflation, potentially forcing the Fed to maintain higher interest rates for longer. This scenario could dampen economic growth, which, in turn, would negatively impact oil demand and, consequently, WTI prices. The CME FedWatch tool, while not explicitly provided here, is likely reflecting increased pricing for delayed rate cuts, a factor that could eventually weigh on risk assets, including oil.
Upcoming economic data releases will be crucial in shaping this narrative. Key US releases such as Non-Farm Payrolls (NFP), Consumer Price Index (CPI), and Purchasing Managers' Index (PMI) reports will provide critical insights into the health of the world's largest economy. Stronger-than-expected data might reinforce the Fed's hawkish leanings or signal underlying economic resilience, potentially supporting oil prices through demand expectations. Conversely, weaker data could prompt a reassessment of economic growth prospects, potentially leading to a risk-off sentiment that weighs on commodities. The market's reaction to these data points will be telling, especially in how they influence the DXY and overall risk appetite.
The correlation between WTI and major currency pairs like EUR/USD and USD/JPY cannot be overstated. As the USD/JPY pair hovers near the critical 160.00 level, influenced by both oil prices and Japanese economic data (like the recent weak household spending figures), it underscores the global interconnectedness of these markets. A sustained climb in oil prices, coupled with a hawkish Fed, could see the dollar strengthen further against the Yen and potentially other currencies. However, the current geopolitical risk premium adds a layer of complexity, as safe-haven flows can sometimes override typical correlation patterns. The market's ability to digest these competing forces will dictate WTI's path in the short to medium term. For now, the immediate focus remains on the $114.64 resistance and the unfolding geopolitical situation.
"Patience is a virtue in volatile markets. Wait for clear setups and robust confirmation, especially when geopolitical risks are high."
- Burak AydınBearish Scenario: Consolidation or Reversal?
60% ProbabilityBullish Scenario: Geopolitical Tailwind Continues
30% ProbabilityNeutral Scenario: Range-Bound Action
10% ProbabilityFrequently Asked Questions: WTI Analysis
What happens if WTI breaks decisively above the $114.82 resistance level?
A sustained move above $114.82, confirmed by strong volume, could trigger a bullish scenario targeting $115.18 and potentially $115.55. This would likely be driven by continued escalation of geopolitical tensions and strong risk appetite.
Is the RSI at 71.54 a strong sell signal for WTI right now?
An RSI reading of 71.54 on the daily chart indicates overbought conditions, suggesting caution. While not an immediate sell signal in a strong uptrend like the current one (ADX 34.18), it increases the probability of a consolidation or pullback, especially if short-term oscillators also turn bearish.
How will ongoing Fed rate expectations affect WTI prices around $114.64?
Stubborn inflation concerns may lead the Fed to maintain higher rates. If this outlook solidifies, it could dampen economic growth expectations, potentially reducing oil demand and capping WTI's upside around $114.64, despite geopolitical support.
Should traders consider shorting WTI if it fails to hold above $113.49 support?
A close below the $113.49 support level would invalidate the immediate bullish setup and could trigger a bearish scenario targeting $113.49 and then $112.87. This would be more likely if geopolitical tensions ease or broader market risk appetite declines.
| Indicator | Value | Signal | Interpretation |
|---|---|---|---|
| RSI (14) | 71.54 | Neutral | Nearing Overbought |
| MACD Histogram | +0.75 | Bullish | Positive Momentum |
| Stochastic %K | 91.71 | Bullish | Overbought Territory |
| ADX (14) | 59.16 | Strong Trend | Very Strong Uptrend |
| Bollinger Bands | Upper Band | Bullish | Price Above Middle Band |
Track markets in real-time
AI-powered analysis, technical indicators and real-time price data.
Join Our Telegram Channel
Breaking market news, AI analysis and trading signals instantly.
Join Channel