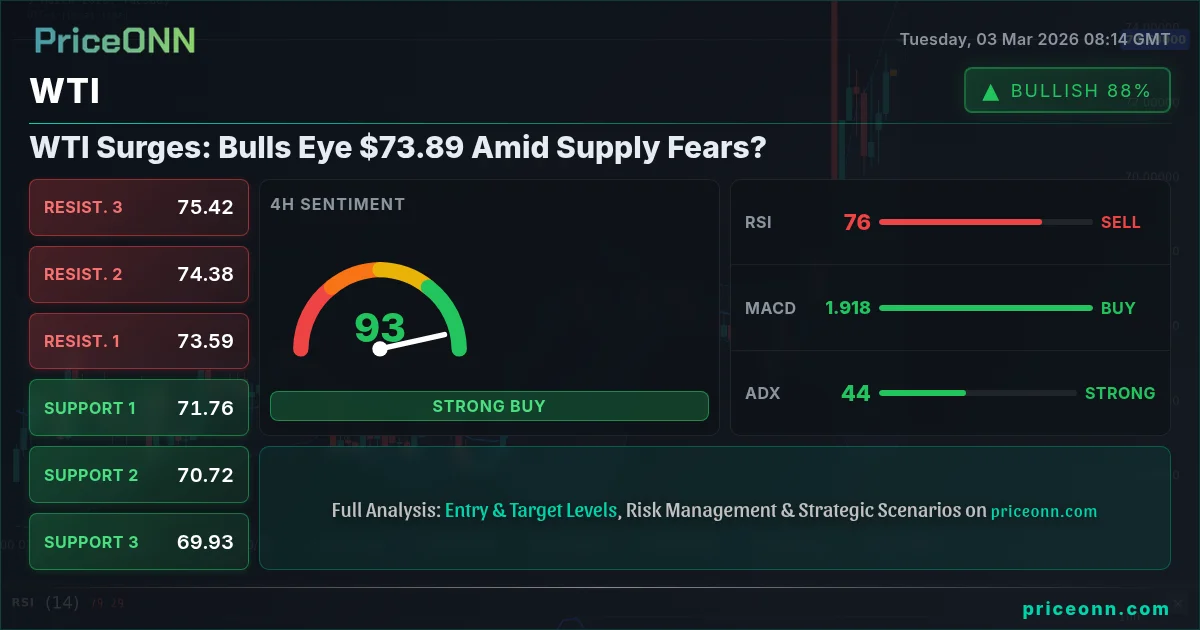
WTI Surges: Bulls Eye $73.89 Amid Supply Fears?
WTI crude oil is trading at $73.89 amid escalating Middle East tensions disrupting tanker traffic. Will this rally push prices to new highs, or is a correction on the horizon?
WTI crude oil's current price of $73.89 has traders wondering if the bulls have enough momentum to target $75, especially amid escalating supply fears stemming from Middle East tensions. The market is a complex interplay of technical signals and geopolitical risks, with the potential for significant volatility ahead.
- RSI at 71 on the 1H chart signals overbought conditions, suggesting a potential pullback in the short term.
- Key support sits at $72.52 on the 1H chart, tested multiple times today. A break below could trigger further downside.
- MACD on the 1H chart shows positive momentum, but the histogram is narrowing, indicating bullish momentum may be fading.
- Geopolitical tensions in the Middle East, particularly disruptions in tanker traffic, are a major driver of WTI's current price action.
WTI today analysis reveals a market at a critical juncture. The initial surge was driven by news of refinery shutdowns and tanker disruptions in the Middle East, as reported by major news outlets. According to Reuters, the drone strike on Saudi Arabia’s largest refinery sent shockwaves through the energy market, immediately impacting crude oil prices. The bullish trend is further supported by the 1D timeframe data, which shows a 94% trend strength. However, the short-term technical indicators paint a more nuanced picture.
The 1H chart presents a mixed bag. While the trend is bullish at 95% strength, the RSI at 71 indicates overbought conditions. This suggests that the bulls may be losing steam, and a pullback is possible. The MACD, while still showing positive momentum, has a narrowing histogram, further hinting at fading bullishness. The Stochastic oscillator, with K=88.61 and D=83.18, confirms the overbought state, increasing the likelihood of a short-term correction. The ADX, however, at 35.21, indicates a strong uptrend, meaning any pullback may be short-lived. This is exactly where you need to pay attention.
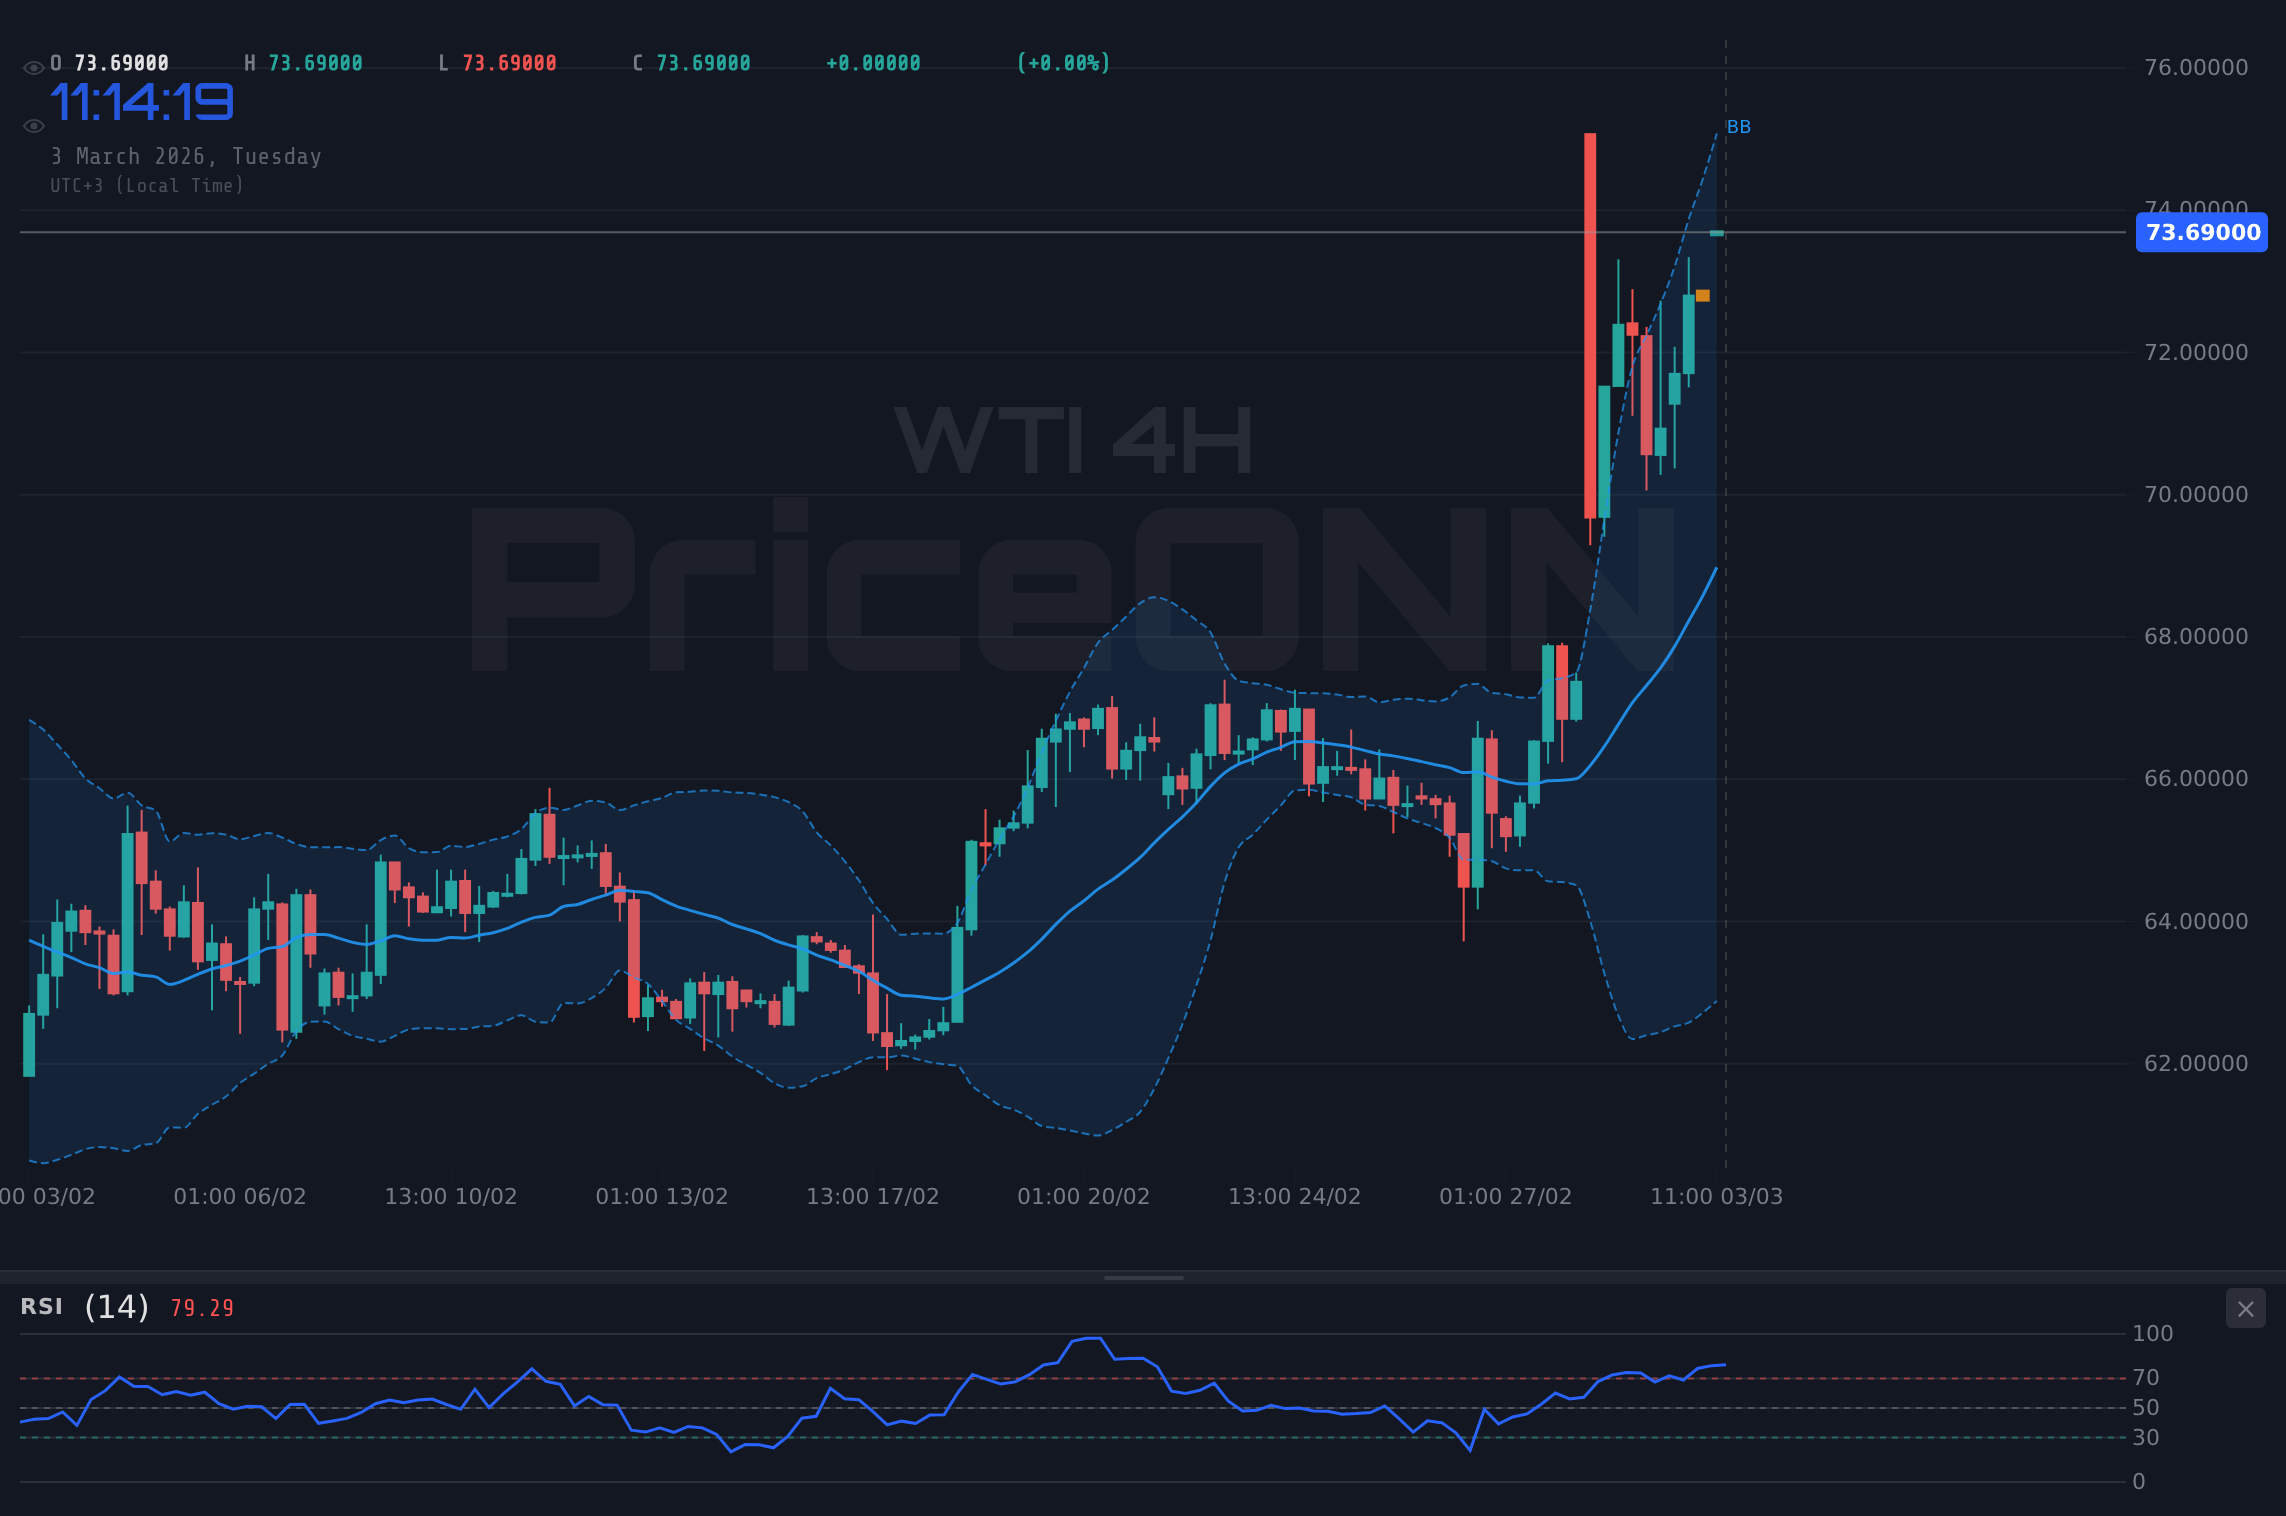
Zooming out to the 4H chart, the trend remains bullish at 91% strength. The RSI at 72.89 is also in overbought territory, reinforcing the potential for a correction. However, the MACD shows positive momentum, and the Stochastic oscillator, with K=66.92 and D=63.48, is giving a bullish signal. The ADX, at a robust 41.7, confirms a strong uptrend, suggesting that any dip could be a buying opportunity. This is where patience looks like it will be rewarded here.
On the daily chart, the overall trend is still bullish, with a 94% trend strength. The RSI at 76.18 is firmly in overbought territory, signaling caution. The MACD shows positive momentum, and the Stochastic oscillator, with K=82.76 and D=76.88, is also giving a bullish signal. The ADX at 28.69 reinforces the strong uptrend. However, the overbought RSI suggests that the market may be due for a breather, and any further gains could be limited in the short term.
Key levels to watch include the immediate resistance at $74.24 on the daily chart. A break above this level could pave the way for further gains towards $77.54 and $80.02. On the downside, immediate support lies at $72.52 on the 1H chart, followed by $70.69 on the 4H chart. A break below these levels could signal a deeper correction towards $68.46 on the daily chart.
Why WTI volatility analysis points to a breakout: The convergence of bullish and bearish signals across different timeframes suggests that WTI is poised for a significant move. The short-term overbought conditions indicate a potential pullback, while the longer-term bullish trends suggest that any dip could be a buying opportunity. The escalating geopolitical tensions in the Middle East further add to the uncertainty, increasing the potential for volatility.
Having tracked WTI through multiple cycles, I've found that these conflicting signals often precede sharp price movements. Understanding the interplay of technical indicators and fundamental drivers is crucial for navigating this market. Manage your risk, wait for your setup- the market always gives a second chance.
The upcoming U.S. Crude Oil Inventories data on Wednesday will be critical. The previous reading showed a significant increase of 15.989 million barrels. A further increase could weigh on prices, while a decrease could provide further fuel for the rally. Also, keep an eye on the U.S. Initial Jobless Claims data on Thursday. Any unexpected increase could raise concerns about economic growth and potentially dampen demand for oil.
The USD/JPY rallies on US data, but eyes are on BoJ’s Ueda. The DXY at 98.6 is showing strength. This typically puts pressure on commodities like WTI, as a stronger dollar makes oil more expensive for international buyers. However, the geopolitical risks and supply concerns seem to be overriding this inverse correlation for now.
The correlation with the SP500 is also noteworthy. The SP500 is down -1.03% today, indicating a risk-off environment. In such scenarios, safe-haven assets typically outperform, but WTI is bucking this trend, suggesting that the supply concerns are dominating market sentiment. This pattern last appeared in January 2025, when a similar geopolitical event caused WTI to decouple from its usual inverse relationship with the SP500.
WTI Trade Plan: Bullish Breakout
Considering the overall bullish trend and the potential for further gains, a long position is favored. However, given the short-term overbought conditions, it's prudent to wait for a pullback before entering. This is exactly where you need to pay attention…
Enter long if price retraces to $73.28 and holds. Initial target is $74.24, with a secondary target of $77.54. This scenario plays out if the market continues to price in supply disruptions and geopolitical risks.
If price breaks below $72.52, consider a short position with a target of $70.69. This scenario becomes likely if the U.S. Crude Oil Inventories data shows a significant increase in supply, easing concerns about potential disruptions.
Technical Outlook Summary
| Indicator | Value | Signal |
|---|---|---|
| RSI (14) | 71 | Overbought |
| MACD Histogram | Positive | Bullish |
| Stochastic | 88.61/83.18 | Overbought |
| ADX | 35.21 | Strong Trend |
| Bollinger | Upper Band | Watch |
Key Levels
Support Levels
Resistance Levels
Frequently Asked Questions: WTI Analysis
Is WTI a good buy right now?
WTI is showing mixed signals. While the overall trend is bullish, the RSI is in overbought territory, suggesting a potential pullback. Wait for a retracement to $73.28 before considering a long position.
What is the WTI price forecast for this week?
The WTI price forecast for this week is bullish, with a primary target of $74.24 and a secondary target of $77.54. However, be mindful of potential pullbacks due to overbought conditions.
What are the key support and resistance levels for WTI?
Key support levels for WTI are $72.52, $70.69, and $68.46. Key resistance levels are $74.24, $77.54, and $80.02. These levels are based on a multi-timeframe analysis of technical indicators.
Why is WTI moving today?
WTI is moving today due to escalating geopolitical tensions in the Middle East, which are disrupting tanker traffic and raising concerns about potential supply shortages. The drone strike on Saudi Arabia's largest refinery is a key catalyst.
Track markets in real-time
AI-powered analysis, technical indicators and real-time price data.
Join Our Telegram Channel
Breaking market news, AI analysis and trading signals instantly.
Join Channel