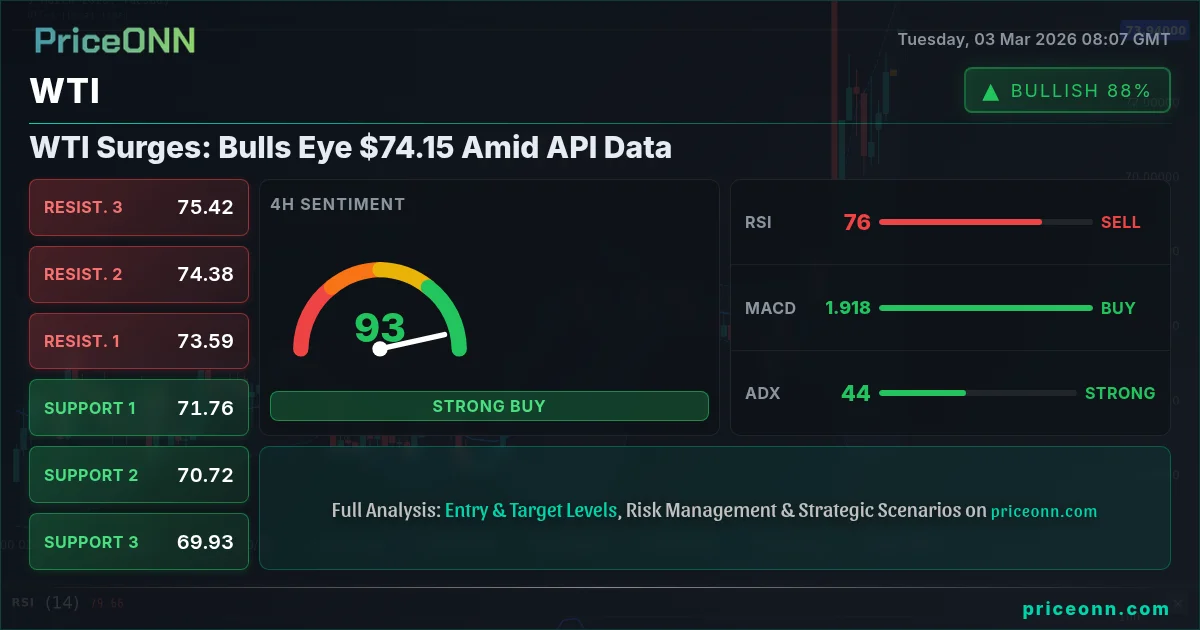
WTI Surges: Bulls Eye $74.15 Amid API Data
WTI crude oil jumps to $74.15 as Middle East tensions and positive API data fuel bullish sentiment. Will the rally continue or face resistance?
Crude oil prices are on the rise again, with WTI crude oil technical analysis today pointing to continued bullish momentum. Escalating geopolitical tensions in the Middle East, combined with supportive API data, are pushing WTI towards the $75 mark. But can this rally sustain itself, or are we looking at a temporary spike before a correction?
- WTI crude oil surges to $74.15, driven by geopolitical risks and positive API data.
- Key resistance lies at $74.24, a break above which could trigger further upside.
- RSI at 72.17 signals overbought conditions on the 1-hour chart, suggesting caution.
- Strong correlation between WTI and Middle East tensions: escalating conflict = higher oil prices.
Geopolitical Tensions Fuel Bullish Momentum
Escalating tensions in the Middle East are a primary driver behind the recent surge in WTI crude oil prices. According to recent reports, drone strikes on Saudi Arabian refineries and disruptions in tanker traffic through the Strait of Hormuz have created significant supply concerns. As a major chokepoint for global oil supplies, any disruption in the Strait of Hormuz has an immediate impact on crude oil prices. The market is pricing in the risk of further disruptions, leading to increased demand and higher prices. The announcement of production capacity rising in Brazil, following their acceptance into OPEC+, could potentially offset some of the disruption. However, this is a longer-term factor, and the immediate impact of geopolitical instability is dominating the market.
API Data Confirms Demand Strength
Adding to the bullish sentiment, recent API (American Petroleum Institute) data has indicated a significant drawdown in crude oil inventories. This suggests strong demand and reinforces the narrative of a tightening oil market. While the official EIA (Energy Information Administration) data is still pending, the API figures often provide an early indication of the trend. If the EIA data confirms the API numbers, we could see further upside in WTI prices. The market is also closely watching the upcoming U.S. Crude Oil Inventories data release on Wednesday, expecting to see if the API trend continues. The previous reading showed a substantial increase of 15.989 million barrels, so a significant reversal would be a strong bullish catalyst.
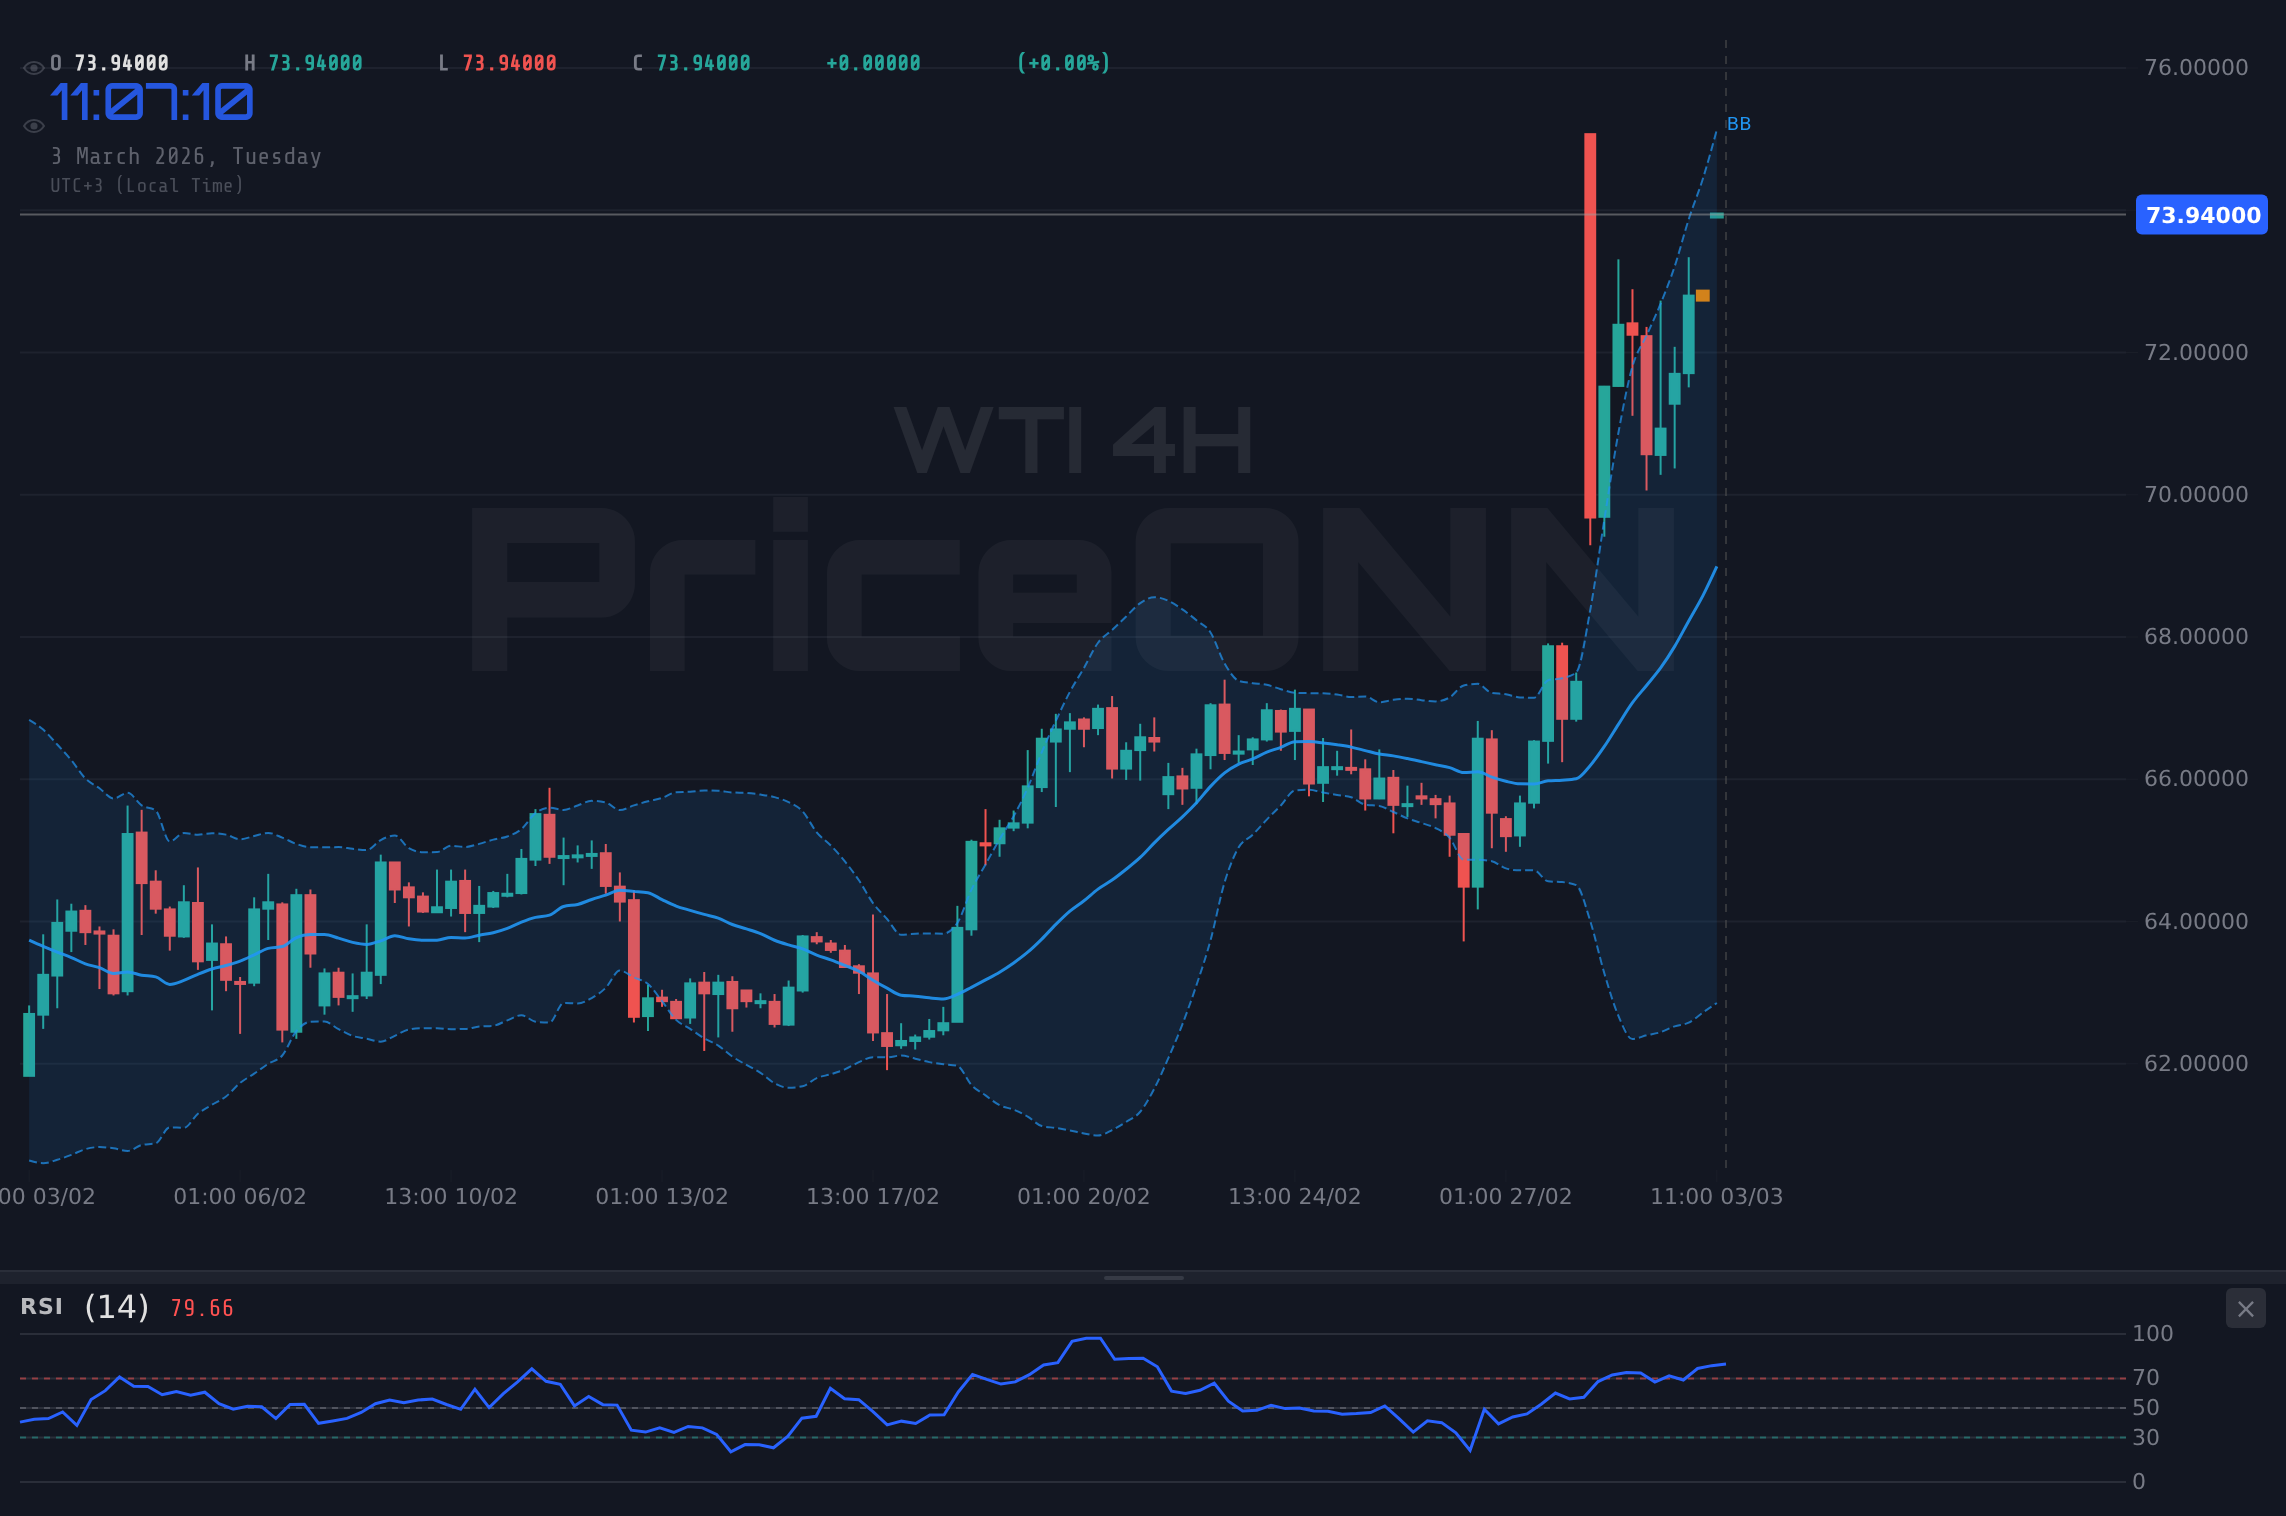
WTI Crude Oil Technical Analysis Today
From a technical perspective, WTI crude oil is exhibiting strong bullish signals across multiple timeframes. On the daily chart, the trend is up with 94% strength, according to our AI technical analysis. WTI today analysis reveals that the price is currently trading near the upper Bollinger Band, suggesting that the commodity is overbought and due for a pullback. However, the MACD histogram remains positive, indicating that bullish momentum is still in play. The ADX (Average Directional Index) is at 28.69, confirming the strength of the current uptrend. The stochastic oscillator is in overbought territory, with K=83.53 and D=77.01, which could signal a potential reversal in the near term.
Key Levels to Watch
Key levels to watch are the resistance around $74.24, which is the near term resistance. If the bulls manage to break above this level, we could see a further rally towards $77.54. On the downside, immediate support lies at $72.52 on the 1H chart, followed by $70.69 on the 4H chart. A break below $72.52 could signal a short-term correction. Given the current market conditions, traders should be prepared for increased volatility and potential whipsaws. The fact that the DXY (Dollar Index) is currently at 98.58 shows how the strength of the dollar is not impacting the price of crude. This is a significant divergence that could lead to a sharp correction if the DXY reverses its trend.
Trade Plan: Riding the Bullish Wave with Caution
Given the strong uptrend and supportive fundamental factors, a bullish trading strategy appears to be the most prudent approach. However, traders should be mindful of the overbought conditions and potential for a pullback. The 1-hour RSI indicates that WTI is overbought at 72.17, suggesting some caution is warranted. With the ADX at 41.75 on the 4-hour chart, the trend is strong, but the Stochastic oscillator is signaling overbought conditions, which means there is some uncertainty to entry timing.
A decisive break above $74.24 could trigger a continuation of the uptrend, targeting $77.54 and potentially $80.02 in the longer term. This scenario is contingent on continued geopolitical tensions and supportive inventory data.
Failure to break above $74.24 and a subsequent close below $72.52 could signal a correction towards $70.69 and potentially $68.46. This scenario would likely be driven by easing geopolitical tensions or a surprise build in inventories.
A potential trade plan could involve entering long positions on a breakout above $74.24, with a stop-loss placed below $72.52 to manage risk. Profit targets could be set at $77.54 and $80.02, reflecting the potential upside in a bullish scenario.
Risk Factors
Several risk factors could derail the bullish outlook for WTI crude oil. Easing geopolitical tensions in the Middle East could lead to a sharp correction in prices. A surprise build in crude oil inventories could also dampen bullish sentiment. Furthermore, a stronger dollar could put downward pressure on WTI prices. The upcoming United Kingdom Spring Forecast Statement and Eurozone Consumer Price Index (CPI) data could have an impact on overall market sentiment, potentially influencing crude oil prices. The United States ADP Nonfarm Employment Change and Services PMI data expected on Wednesday will also be important indicators to watch.
Frequently Asked Questions: WTI Analysis
Is WTI a good buy right now?
Given the current price of $74.15 and strong bullish trend, WTI presents a buying opportunity if it breaks above resistance at $74.24. However, traders should be cautious due to overbought conditions and place stop-loss orders below $72.52.
What is the WTI price forecast for this week?
The WTI price forecast for this week is bullish, with potential targets at $77.54 and $80.02. However, a break below $72.52 could lead to a correction towards $70.69.
What are the key support and resistance levels for WTI?
Key support levels for WTI are $72.52 and $70.69, while key resistance levels are $74.24, $77.54 and $80.02.
Why is WTI moving today?
WTI is moving today due to escalating geopolitical tensions in the Middle East, supportive API data, and strong technical momentum.
Technical Outlook Summary
| Indicator | Value | Signal |
|---|---|---|
| RSI (14) | 72.17 | Watch |
| MACD Histogram | Positive | Bullish |
| Stochastic | 90.24/83.45 | Overbought |
| ADX | 41.75 | Strong Trend |
| Bollinger | Upper Band | Watch |
Key Levels
Support Levels
Resistance Levels
Track markets in real-time
AI-powered analysis, technical indicators and real-time price data.
Join Our Telegram Channel
Breaking market news, AI analysis and trading signals instantly.
Join Channel