
WTI Tests Resistance at $115.71: Bullish Oil Eyes Further Gains
WTI crude oil hovers near $115.71, testing key resistance levels amid strong bullish momentum and geopolitical undertones. A sustained break could signal further upside.
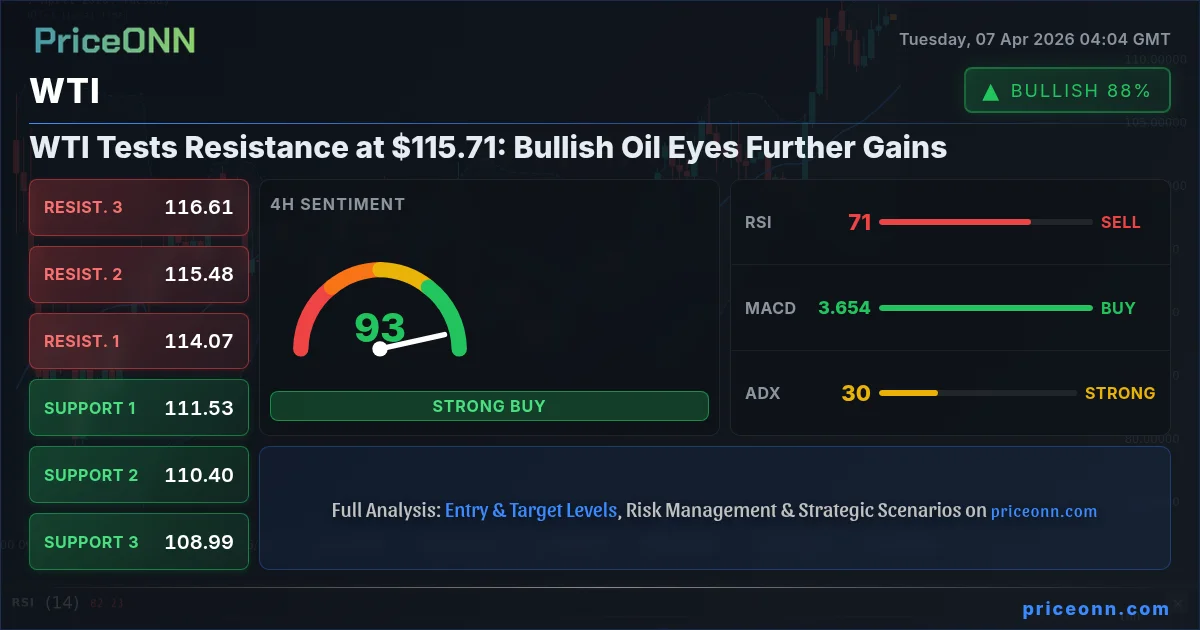
Alright traders, let's cut to the chase. The WTI crude oil chart is telling a compelling story right now, and it's one that bulls have been eager to hear. Trading at precisely $115.71, WTI isn't just inching higher; it's challenging significant resistance zones that, if overcome, could unlock a new leg of its rally. This isn't just about a few dollars per barrel; it's about understanding the confluence of technical strength, supply-side pressures, and the ever-present geopolitical undercurrents that are currently painting a bullish picture for oil. The question on everyone's mind is whether this upward momentum has the legs to push past current hurdles or if we're due for a pullback. Let's dive deep into the data and see what the charts and global dynamics are truly signaling.
- WTI crude oil is currently trading at $115.71, testing key resistance levels.
- The 1-day ADX reading of 59.11 indicates a very strong uptrend, suggesting momentum is firmly with the buyers.
- RSI at 72.11 on the daily chart signals overbought conditions, suggesting caution or a potential for a short-term pullback before further gains.
- Geopolitical tensions in the Middle East remain a significant underlying factor supporting oil prices, with WTI showing a strong correlation with Brent trading at $114.25.
Navigating the Bullish Momentum
The energy markets are certainly not for the faint of heart, and WTI's recent price action is a testament to that. Currently hovering around $115.71, WTI has demonstrated remarkable resilience and upward force. This isn't a speculative blip; the daily chart paints a picture of a robust uptrend, underscored by an exceptionally strong ADX reading of 59.11. This indicator, which measures trend strength, suggests that the current move is not a fleeting one but rather a firmly established trend. When we see ADX values this high, it signals that the market is committed to a direction, and in this case, it's decidedly upward. The question isn't *if* there's a trend, but rather *how far* it can extend and what the immediate obstacles are.
Looking at the broader technical landscape, the 1-hour and 4-hour charts show strong bullish signals, with MACD indicators favoring buyers and Stochastic oscillators pushing into overbought territory on the hourly timeframe. However, the daily chart presents a more nuanced picture. While the trend is undeniably bullish (strength 100%), the RSI is sitting at a lofty 72.11. This reading, while not an immediate sell signal, certainly warrants attention. It suggests that the market might be getting a bit extended in the short term and could be ripe for some profit-taking or consolidation. Traders who are already in positions might be looking to tighten their stop-losses, while those looking to enter might be waiting for a more attractive entry point, perhaps a dip towards a support level.
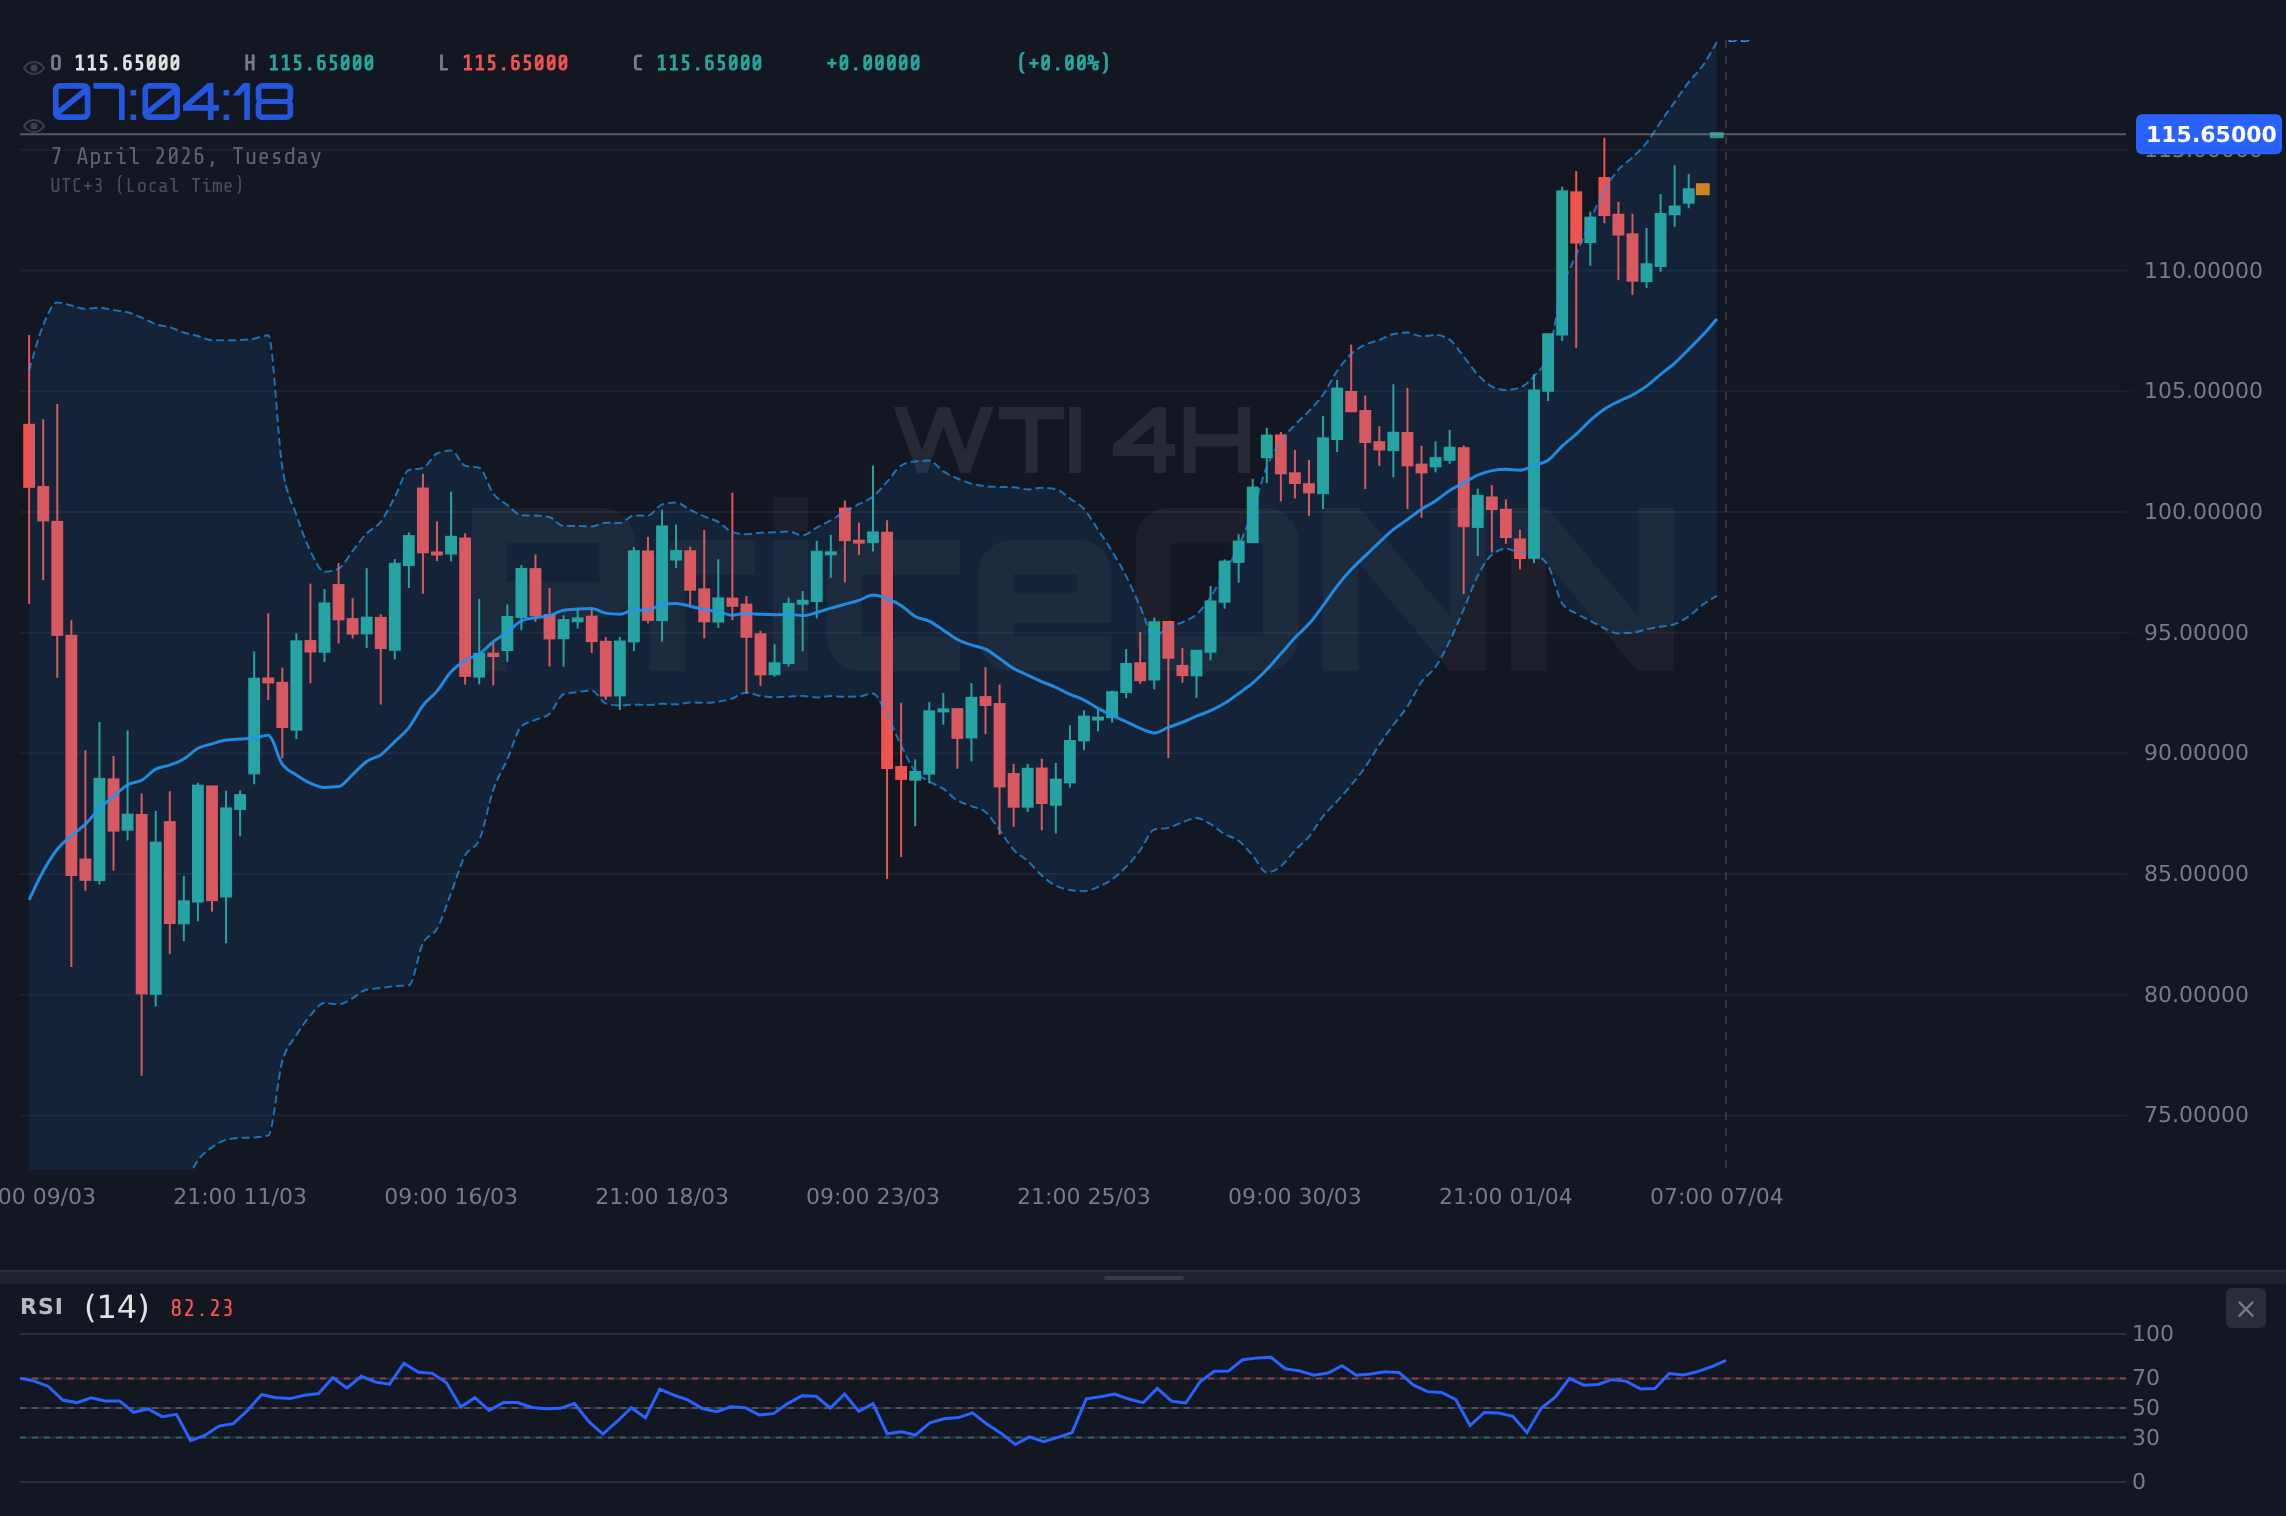
The interplay between different timeframes is crucial here. The short-term charts scream 'buy,' driven by immediate momentum. The daily chart, however, provides a dose of reality, indicating that the pace might be unsustainable without a pause. This divergence in signals across timeframes is exactly where skillful trading comes into play. It’s not about blindly following the strongest signal but about understanding the context and potential implications of each reading. For instance, a short-term trader might see the hourly bullish signals as an opportunity for an intraday trade, aiming for quick profits before potential resistance kicks in. A swing trader, however, would likely pay more attention to the daily RSI and the approaching resistance levels, perhaps waiting for a confirmation of a breakout or a pullback to a more strategic entry point.
The ADX reading on the daily chart, at 59.11, is particularly noteworthy. Values above 40 typically indicate a very strong trend. This reinforces the idea that while overbought conditions might lead to minor retracements, the underlying trend's power is significant. It suggests that any dips might be shallow and short-lived, quickly met by renewed buying interest as the overall bullish sentiment continues to dominate.
Fundamental Drivers: Supply, Demand, and Geopolitics
While the technicals provide a roadmap, the fundamental drivers are the engine powering WTI's ascent. The persistent strength in crude oil prices, with WTI at $115.71 and Brent hovering around $114.25, is deeply rooted in supply-side constraints and robust demand expectations. Geopolitical tensions in the Middle East continue to be a primary catalyst, creating a risk premium that is baked into the current price. Any escalation or even the mere threat of supply disruptions in this critical region acts as a powerful tailwind for oil prices. We've seen this play out repeatedly, where news headlines from the region can cause sharp price spikes, demonstrating the market's sensitivity to any perceived threat to global oil flow.
Adding to the supply-side narrative are the ongoing production cuts by OPEC+. While the group has shown some flexibility in the past, the current market conditions, characterized by strong demand and geopolitical risks, likely encourage adherence to existing quotas or even further voluntary cuts if deemed necessary. Saudi Arabia's role, as a key player in managing global oil supply, remains pivotal. Any indication of their willingness to adjust production levels in response to market dynamics or geopolitical events will be closely watched and immediately reflected in price action.
On the demand side, global economic indicators, particularly from major consumers like the United States and China, are painting a picture of sustained, albeit perhaps uneven, growth. While inflation concerns persist, leading central banks to maintain a cautious stance on monetary policy, the underlying economic activity remains strong enough to support robust oil consumption. Reopening economies and increased industrial activity contribute to this demand picture. The correlation between oil prices and global economic health is well-established; as economies expand, so does their need for energy, creating a foundational support for crude prices.
The interplay between these factors is what makes the oil market so dynamic. It's a constant push and pull between supply management, geopolitical events, and macroeconomic demand. Currently, the supply and geopolitical factors appear to be outweighing any demand-side concerns, creating the bullish environment we are witnessing. This balance, however, is delicate and can shift rapidly with new information or events, making continuous monitoring essential for any trader navigating this complex landscape.
Cross-Market Correlations: DXY, Equities, and the Bigger Picture
Understanding WTI's price action requires looking beyond the oil market itself and examining its correlations with other major financial instruments. The Dollar Index (DXY), currently trading around 99.85, plays a crucial role. Typically, a strengthening dollar exerts downward pressure on dollar-denominated commodities like oil, as they become more expensive for holders of other currencies. However, in the current environment, the relationship is more complex. While the DXY shows a strong daily uptrend (ADX 29.17), WTI has also been rising. This suggests that other factors, primarily supply concerns and geopolitical risk, are currently overriding the typical inverse correlation.
The strength of the dollar itself is influenced by various factors, including US monetary policy expectations and global risk sentiment. If the Federal Reserve signals a more hawkish stance, or if global risk aversion increases, the dollar tends to strengthen. This could eventually put a lid on oil prices, but for now, the bullish narrative in oil appears to be dominant. The fact that WTI is climbing despite a strengthening dollar highlights the potency of the supply-side and geopolitical drivers.
Equities, represented by the SP500 (6572.87) and Nasdaq (24057.99), also offer valuable context. A rising stock market generally indicates increased risk appetite, which can translate into higher demand for commodities as investors feel more confident. Conversely, a falling stock market often signals risk aversion, leading investors to seek safe-haven assets and potentially reducing demand for riskier commodities like oil. Currently, the SP500 shows a strong daily uptrend, while the Nasdaq is showing a mixed picture with a strong 4H uptrend but a daily downtrend. This mixed equity signal suggests that while there's some appetite for risk, it's not universally strong, adding another layer of complexity to the demand outlook.
The correlation between oil and equities is not always direct but provides a general sense of market sentiment. When both are rising, it suggests a broad-based economic expansion. When oil rises and equities fall, it can indicate a scenario where inflation fears or supply shocks are driving commodity prices, potentially acting as a drag on economic growth and corporate earnings. Understanding these cross-market dynamics is vital for a holistic market view. It helps traders identify potential divergences or confirmations that can refine their trading strategies.
Key Levels and Potential Scenarios
Focusing back on WTI, the current price of $115.71 places it squarely against significant resistance. The daily data highlights the first resistance level at $115.77. A clear break and sustained hold above this level would be a powerful bullish signal, potentially opening the door for further upside. The next resistance levels are at $118.89 and $122.28. These are not just arbitrary numbers; they represent historical price points where selling pressure has previously emerged, or where significant trading activity has occurred.
On the downside, support levels are crucial for gauging potential pullbacks. The immediate support sits at $114.75, followed by $112.77 (note: using the closest support from data, $112.58 from daily range) and then $109.85 on the daily chart. A break below $114.75 would suggest that the immediate bullish momentum is faltering, and a move towards $112.77 could be on the cards. A more significant breakdown below $109.85 would indicate a more substantial shift in market sentiment.
Given the strong bullish trend (ADX 59.11) but also the overbought daily RSI (72.11), we need to consider multiple scenarios. The bullish scenario hinges on a decisive breakout above $115.77. If this occurs, we could see a rapid move towards $118.89, fueled by momentum traders and potentially stop-loss triggers for those betting against the trend. The invalidation for this bullish move would be a close back below the $114.75 support level.
A bearish scenario would play out if WTI fails to decisively break $115.77 and instead pulls back. The first target would be the support at $114.75. If this level gives way, the next logical target becomes $112.77. This scenario gains credibility if the daily RSI continues to pressure lower or if broader market sentiment shifts towards risk aversion.
A neutral scenario, or consolidation, is also possible. This would involve WTI trading within a defined range, likely between the immediate support of $114.75 and resistance at $115.77, for a period. This would allow the RSI to cool off from its overbought levels, potentially setting the stage for a more sustained move in either direction later on. The ADX reading suggests that any consolidation might be short-lived, as the trend strength is currently very high.
Bearish Scenario: Resistance Holds Firm
35% ProbabilityNeutral Scenario: Consolidation Phase
20% ProbabilityBullish Scenario: Breakout Confirmation
45% ProbabilityThe Path Forward: What Traders Should Watch
As we look ahead, the immediate focus for WTI traders will be the price action around the $115.77 resistance level. A decisive breakout, confirmed by strong volume and followed by holding above this level, would validate the bullish scenario. Keep an eye on the daily RSI; if it starts to pull back from its overbought territory while price continues to climb, it could signal weakening momentum that might precede a correction. Conversely, if the RSI remains elevated but price pushes higher, it indicates significant underlying strength, potentially driven by factors like further geopolitical escalation or unexpected supply disruptions.
The correlation with the DXY is also critical. If the dollar index shows signs of weakening from its current levels around 99.85, it could provide an additional tailwind for WTI. Conversely, a renewed surge in the dollar could cap oil's upside. Similarly, the performance of equity markets, especially the SP500 and Nasdaq, will offer clues about overall risk sentiment. A broad equity rally could support oil prices, while a sell-off might indicate a shift towards safer assets, putting pressure on crude.
From a fundamental perspective, any news regarding OPEC+ production decisions, inventory reports (especially US crude inventories, which have recently seen significant spikes), or developments in the Middle East will be paramount. These factors have the potential to quickly override technical signals and create significant price volatility. For instance, a surprising announcement of unexpected supply cuts could easily propel WTI past current resistance, while news of a de-escalation in geopolitical tensions might trigger a sharp sell-off.
For short-term traders, the $115.77 to $114.75 range is key. A break above $115.77 offers a scalp opportunity targeting $118.89, but with a tight stop below $115.00. A break below $114.75 might offer a shorting opportunity targeting $112.77, again with strict risk management. Longer-term players will be watching for confirmation of a sustained breakout above $115.77, potentially waiting for a pullback and retest of this level as support before committing to larger positions targeting $118.89 and beyond.
Frequently Asked Questions: WTI Analysis
What happens if WTI breaks above $115.77 resistance?
If WTI convincingly breaks above the $115.77 resistance level, it would signal strong bullish momentum. The next key target would likely be the $118.89 resistance level. This scenario is supported by the strong daily trend (ADX 59.11) but would need to overcome the overbought RSI reading of 72.11.
Should I buy WTI at current levels of $115.71 given the RSI at 72.11?
Buying directly at $115.71 while the daily RSI is at 72.11 carries risk due to overbought conditions. A more prudent approach might be to wait for a slight pullback towards support around $114.75 or confirmation of a breakout above $115.77. The probability of a short-term pullback increases with the current RSI reading.
Is the ADX at 59.11 a sell signal for WTI right now?
No, an ADX reading of 59.11 on the daily chart is not a sell signal; it indicates a very strong trend. While the direction of the trend is not specified by ADX alone, in this context, it confirms the strength of the ongoing bullish move. It suggests that any retracements might be short-lived.
How will potential Fed rate decisions affect WTI this week, given DXY is at 99.85?
With the DXY at 99.85 and showing a strong daily uptrend, Fed expectations are crucial. If the Fed signals a more hawkish stance, it could strengthen the dollar further, potentially capping WTI's upside. Conversely, dovish signals might weaken the dollar and support oil prices, especially if geopolitical risks remain elevated.
The oil market remains a dynamic arena, heavily influenced by a complex web of supply, demand, and geopolitical factors. While WTI is currently showing strong bullish technicals, testing critical resistance at $115.71, traders must remain vigilant. The high RSI reading suggests that a consolidation or minor pullback is possible before the trend can resume. Patience and disciplined risk management will be key. The market is offering opportunities, but navigating them requires a keen eye on the confluence of technical levels, fundamental drivers, and the ever-present geopolitical landscape.
Technical Outlook Summary
| Indicator | Value | Signal | Interpretation |
|---|---|---|---|
| RSI (14) | 72.11 | Overbought | Suggests potential for pullback, but trend strength is high. |
| MACD Histogram | +0.94 | Bullish Momentum | Positive momentum continues, supporting the uptrend. |
| Stochastic | K:94.44, D:84.36 | Oversold | Extreme overbought territory; caution advised for new entries. |
| ADX | 59.11 | Very Strong Trend | Confirms a powerful and committed uptrend. |
| Bollinger | Upper Band | Breakout | Price is trading above the upper band, indicating strong upward pressure. |
Key Levels
Support Levels
Resistance Levels
Track markets in real-time
AI-powered analysis, technical indicators and real-time price data.
Join Our Telegram Channel
Breaking market news, AI analysis and trading signals instantly.
Join Channel