
XAGUSD Eyes $72.73: Navigating Geopolitical Currents and Dollar Strength
Silver at $72.73 faces key resistance amid DXY strength and mixed macro signals. Will geopolitical tensions drive safe-haven demand or will dollar strength prevail?
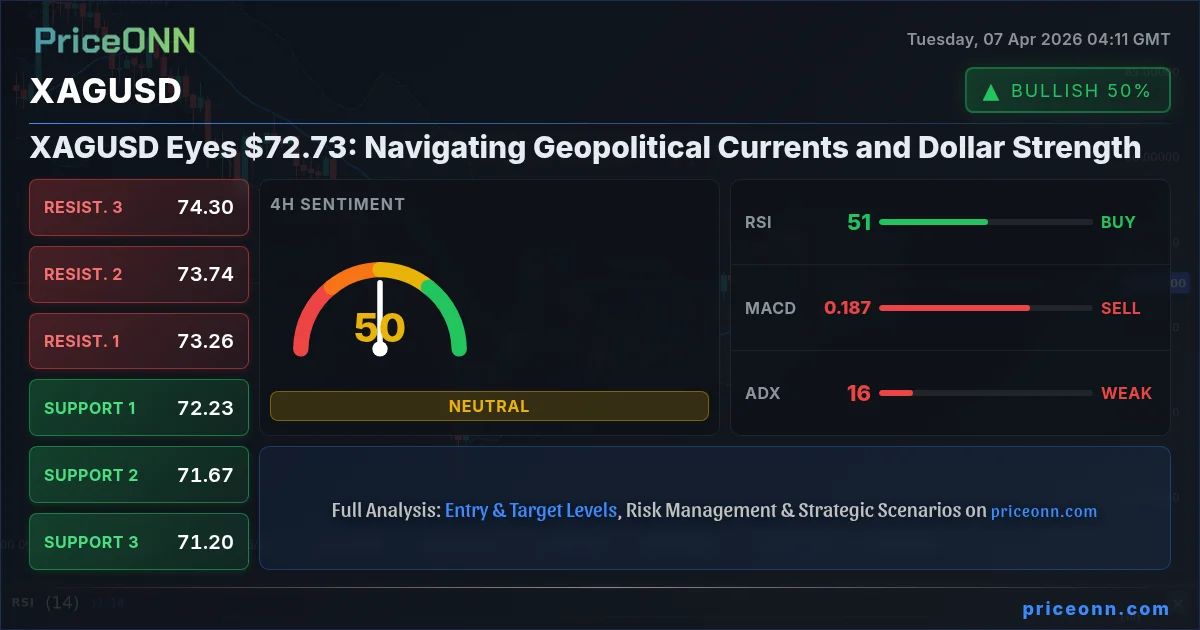
Silver, or XAGUSD, is currently hovering around the critical $72.73 mark. This price point isn't just a number; it's a battleground where geopolitical crosscurrents meet the unyielding force of a strengthening US Dollar. As traders digest mixed economic signals and the ever-present specter of global instability, the question isn't just where silver is heading, but what fundamental drivers are truly dictating its path. This analysis delves into the multi-faceted landscape shaping XAGUSD's immediate future, exploring potential scenarios and the data points that matter most.
- Silver's current price around $72.73 reflects a neutral stance, with RSI(14) at 51.03 on the 1H chart and 50.89 on the 4H, indicating a lack of strong directional momentum.
- The US Dollar Index (DXY) is showing strength, currently at 99.85 and trending upwards on the daily chart, which typically exerts downward pressure on commodities like silver.
- Geopolitical tensions are a significant factor, potentially increasing safe-haven demand for silver, but this is currently being counteracted by dollar strength and mixed broader market signals.
- Key support for XAGUSD lies at $72.23, while resistance is eyed around $73.26; a decisive break of either level will be crucial for determining the next trend.
The Tug-of-War: Dollar Strength vs. Geopolitical Premium
The narrative for silver is complex, caught between two powerful, often opposing, forces. On one hand, the US Dollar Index (DXY) is demonstrating resilience, currently trading at 99.85 and showing a strong upward trend on the daily timeframe (ADX: 29.17). A stronger dollar typically makes dollar-denominated assets like silver more expensive for holders of other currencies, potentially dampening demand. This is a fundamental headwind that cannot be ignored. We see this reflected in the 1-hour and 4-hour charts where the RSI is hovering around 51, suggesting a slight bearish lean despite the overall neutral trend strength.
However, the global geopolitical landscape remains a significant wildcard. Reports of escalating Middle East tensions, as highlighted in recent news, can often trigger a flight to safety, with precious metals like silver benefiting from increased demand. While gold prices have shown some recovery, the impact on silver is less clear-cut, suggesting that the dollar's strength is currently the more dominant factor influencing price action. The ADX readings across all timeframes (1H: 21.08, 4H: 15.98, 1D: 29.89) indicate a lack of strong trending momentum, reinforcing the idea that these opposing forces are keeping silver in a holding pattern.
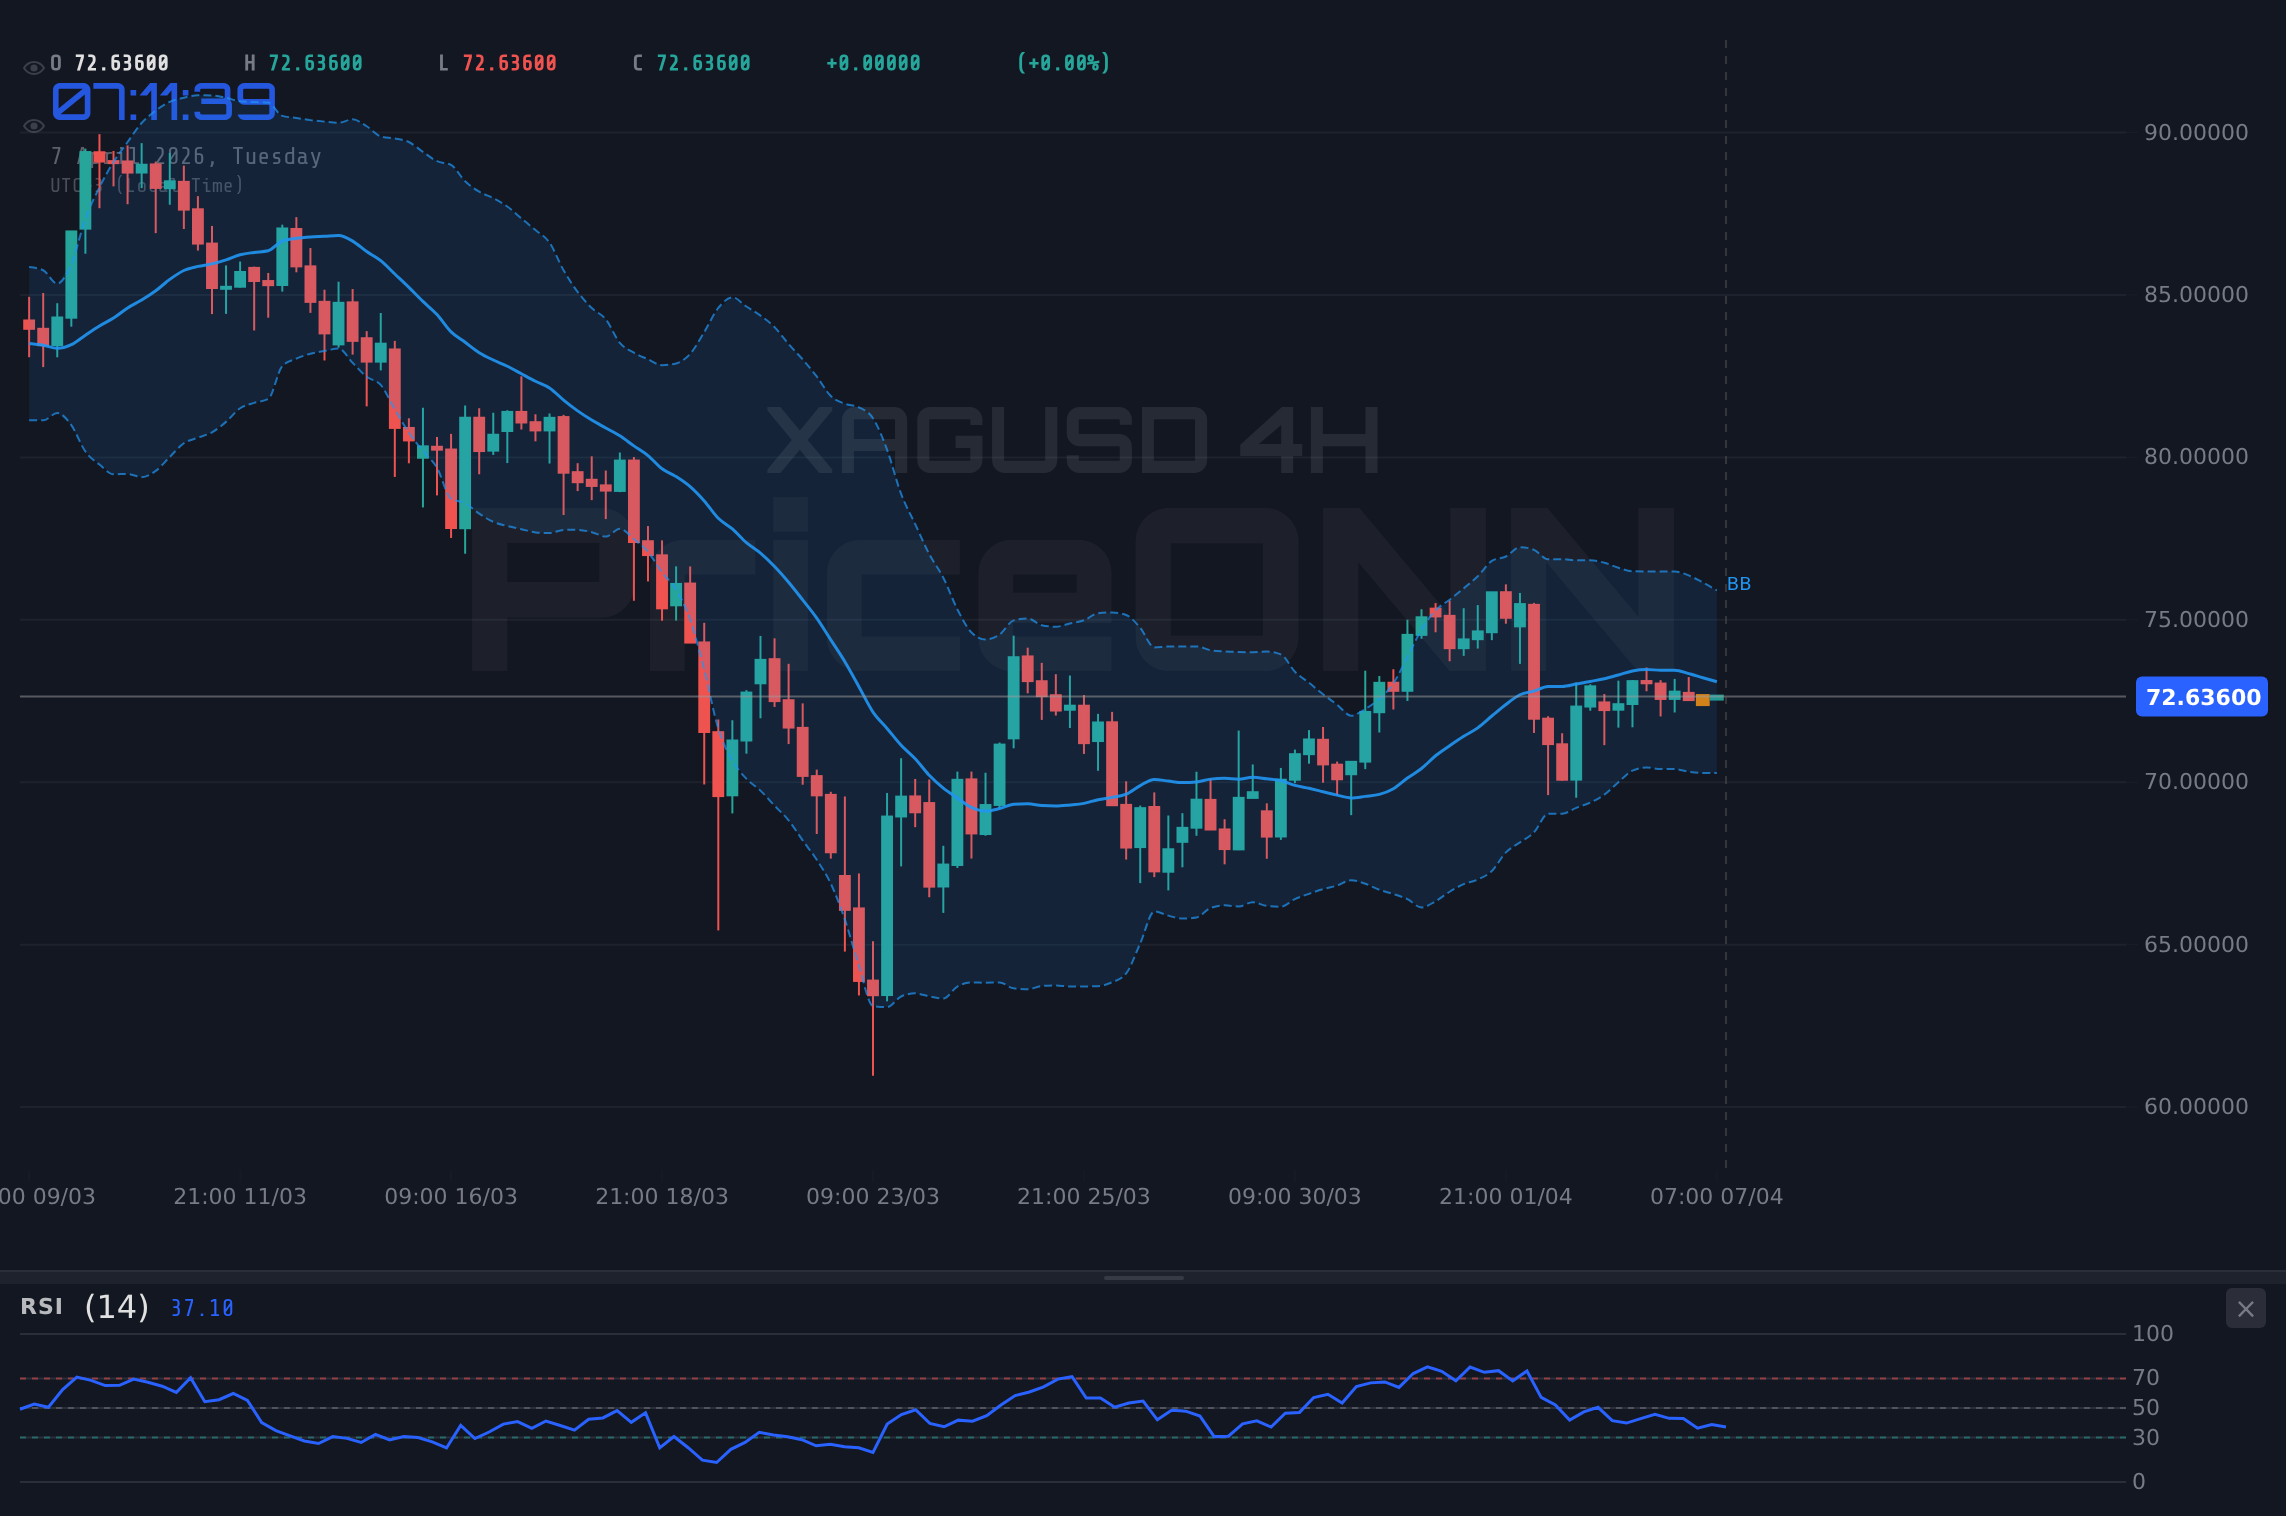
Technical Crossroads: What the Indicators Are Whispering
Delving into the technical indicators provides a nuanced picture. On the 1-hour chart, XAGUSD shows a 'SELL' signal (2 Sell, 6 Buy, 0 Neutral), but this is contradicted by the 4-hour chart's 'NEUTRAL' signal (4 Sell, 4 Buy, 0 Neutral). The daily chart leans towards 'SELL' (3 Sell, 5 Buy, 0 Neutral) with a strong downward trend indicated by ADX 29.89. This divergence across timeframes suggests a market grappling with conflicting signals.
The Relative Strength Index (RSI) across the hourly (46.5), 4-hour (51.07), and daily (44.73) charts generally sits in neutral territory, showing a slight bearish lean on the hourly and daily, but a slight bullish inclination on the 4-hour. This lack of a definitive overbought or oversold reading implies no immediate exhaustion is signaling a sharp reversal. Similarly, the Moving Average Convergence Divergence (MACD) shows negative momentum on the hourly and 4-hour charts, with the MACD line below the signal line, indicating selling pressure, while the daily MACD shows positive momentum. This inconsistency highlights the indecision plaguing the silver market.
Stochastic oscillators offer a mixed bag: the 1-hour shows a bullish crossover (%K > %D), while the 4-hour and daily also show bullish signals with %K above %D. This could hint at potential short-term upside, but it's occurring within a broader context of weak trend strength (ADX below 25 across all timeframes except the daily) and dollar strength, making any bullish move suspect.
Bollinger Bands are generally below the middle band on hourly and daily charts, suggesting a bearish bias, but on the 4-hour, they are also positioned below the middle band, implying a downward bias. The confluence of these indicators paints a picture of a market searching for direction, with short-term signals potentially overridden by longer-term fundamental pressures.
The Macroeconomic Puzzle: Upcoming Data and Their Potential Impact
The economic calendar, while not featuring major high-impact events for USD today, holds significant implications for the coming week. Upcoming releases for USD, such as the ISM Services PMI and consumer confidence data, will be critical. A stronger-than-expected ISM Services PMI, for instance, could further bolster the dollar by signaling economic resilience, potentially pushing XAGUSD lower towards its support levels. Conversely, a weaker reading might signal a slowdown, fueling safe-haven demand for silver and potentially pushing it towards resistance.
The historical data for these USD indicators shows a recent trend: ISM Services PMI was previously 63, and Consumer Confidence was 56.1. If the actual figures deviate significantly from forecasts (which are currently absent in the provided data), the market reaction could be pronounced. We must also consider the broader context of interest rate expectations. While specific Fed meeting minutes or rate decisions aren't listed in the immediate calendar, any subtle shifts in central bank rhetoric or inflation expectations can dramatically impact commodity prices. If inflation remains stubbornly high, it could theoretically support precious metals, but the Fed's reaction function – prioritizing price stability via higher rates – often negates this effect by strengthening the dollar.
The correlation between the DXY and XAGUSD is a crucial element to monitor. Historically, a rising DXY often correlates with falling silver prices. With the DXY at 99.85 and showing a strong daily uptrend, this relationship suggests headwinds for silver. Any signs of dollar weakness, perhaps stemming from weaker US economic data or a shift in Fed policy expectations, could provide a much-needed tailwind for XAGUSD, potentially pushing it towards the $73.26 resistance level.
Navigating the Scenarios: Where Does Silver Go From Here?
Given the current technical and fundamental crosscurrents, several scenarios are plausible for XAGUSD. The most likely outcome in the short term appears to be continued consolidation, but the triggers for a decisive move are becoming clearer.
Bearish Scenario: Dollar Dominance Prevails
60% ProbabilityBullish Scenario: Geopolitics Ignite Safe-Haven Demand
15% ProbabilityNeutral Scenario: Range-Bound Consolidation Continues
25% ProbabilityWhat I'm Watching This Week
My focus remains squarely on the interplay between the DXY and geopolitical headlines. The immediate trigger I'll be watching is the USD economic data releases, particularly the ISM Services PMI. A reading significantly above the previous 63 could solidify the dollar's strength and push XAGUSD towards its lower support levels. Conversely, any dip below 99.50 for the DXY, especially if accompanied by rising oil prices due to geopolitical events, could signal a shift, potentially testing the $73.26 resistance.
The ADX across all timeframes, particularly the daily's 29.89, suggests that while a strong trend isn't established, the market is leaning towards directional movement. A breakout above $73.26, confirmed by rising volume and a weakening DXY, would be a strong bullish signal. Conversely, a decisive break below $72.23, especially if the DXY pushes higher, would likely confirm the bearish bias, opening the door for further downside.
The current technical signals are mixed, with hourly and daily charts showing bearish leanings while the 4-hour offers a more neutral outlook. Stochastic oscillators are flashing some bullish signals, but they are occurring in a low-trend-strength environment (ADX), making them less reliable. Therefore, confirmation from price action and the DXY's movement will be paramount. The $72.73 level represents a crucial pivot; a sustained move away from this price point will likely dictate the short-to-medium term direction.
Frequently Asked Questions: XAGUSD Analysis
What happens if XAGUSD breaks below the $72.23 support level amidst dollar strength?
If XAGUSD closes below the key 4-hour support at $72.23, especially with the DXY pushing above 100.00, it would likely trigger further selling pressure. This could see the price target the next support level at $71.67, reflecting a bearish scenario driven by dollar dominance.
Should I consider buying XAGUSD at current levels around $72.73 if geopolitical tensions escalate significantly?
Buying solely on geopolitical news requires caution. While escalation could boost safe-haven demand, the current dollar strength (DXY at 99.85) acts as a counterforce. A more prudent approach would be to wait for confirmation, such as a break above $73.26 resistance or clear signs of dollar weakness, before considering a bullish entry.
Is the RSI at 51.03 a sell signal for XAGUSD right now, considering the mixed technicals?
An RSI reading of 51.03 is considered neutral, indicating neither strong overbought nor oversold conditions. While it shows a slight bearish lean on some timeframes, it's not a definitive sell signal on its own. The overall context, including weak trend strength (ADX around 15-29) and dollar dynamics, suggests caution rather than immediate action based solely on the RSI.
How will upcoming USD economic data, like ISM Services PMI, affect XAGUSD this week?
Stronger-than-expected USD data, such as an ISM Services PMI significantly above the previous 63, could bolster the dollar and pressure XAGUSD downwards towards $71.67. Conversely, weaker data might trigger safe-haven flows into silver, potentially pushing it towards the $73.26 resistance level as the market reassesses economic outlook.
| Indicator | Value | Signal | Interpretation |
|---|---|---|---|
| RSI (1H) | 46.5 | Sell | Slightly bearish pressure, but in neutral zone. |
| MACD (1H) | Negative | Sell | Momentum favors sellers on this timeframe. |
| Stochastic (1H) | K=49.81, D=28.65 | Buy | Bullish crossover suggests short-term upside potential. |
| ADX (1H) | 21.08 | Neutral | Medium trend strength, indicating consolidation is likely. |
| Bollinger Bands (1H) | Below Mid | Sell | Price action below the middle band suggests bearish bias. |
Track markets in real-time
AI-powered analysis, technical indicators and real-time price data.
Join Our Telegram Channel
Breaking market news, AI analysis and trading signals instantly.
Join Channel