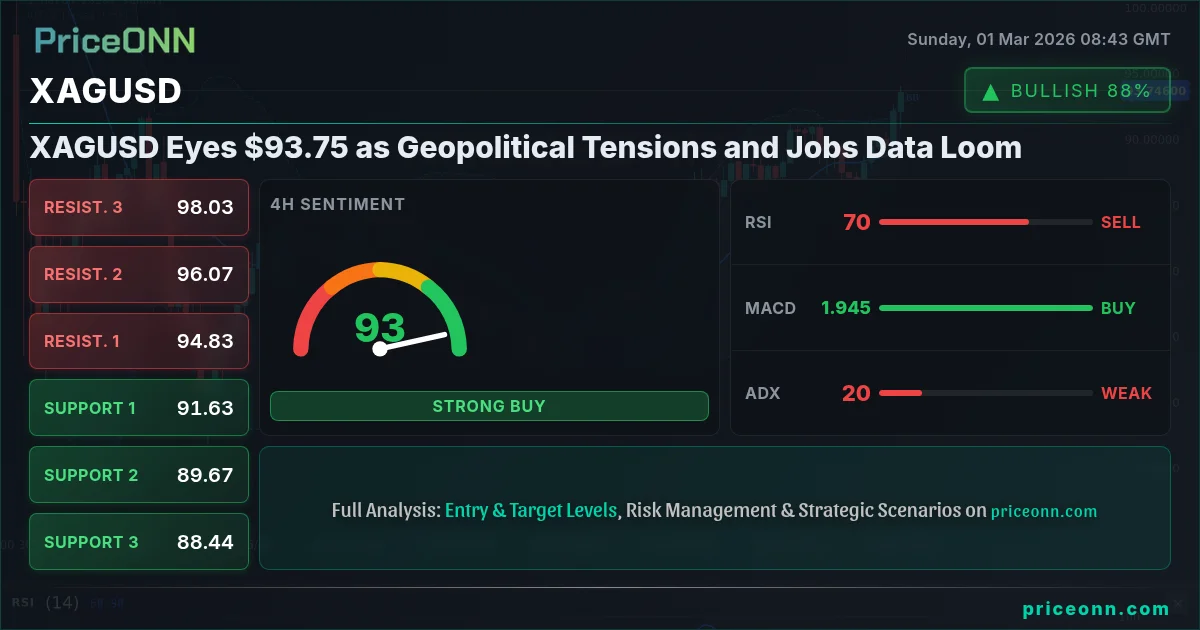
Silver (XAGUSD) closed last Friday at $93.75, a level that's now a key focal point as markets brace for a volatile week ahead. Escalating geopolitical tensions in the Middle East, coupled with the impending release of crucial jobs data, are setting the stage for potential significant price swings in the precious metal.
- XAGUSD closed last Friday at $93.75, serving as an immediate pivot point.
- RSI on the 1-hour chart stands at 70.3, signaling potential overbought conditions and possible near-term pullback.
- Strong support sits at $92.82, tested multiple times on the hourly timeframe this week.
- Geopolitical tensions and upcoming jobs data are expected to drive significant volatility.
Technical Overview: Last Week's Momentum
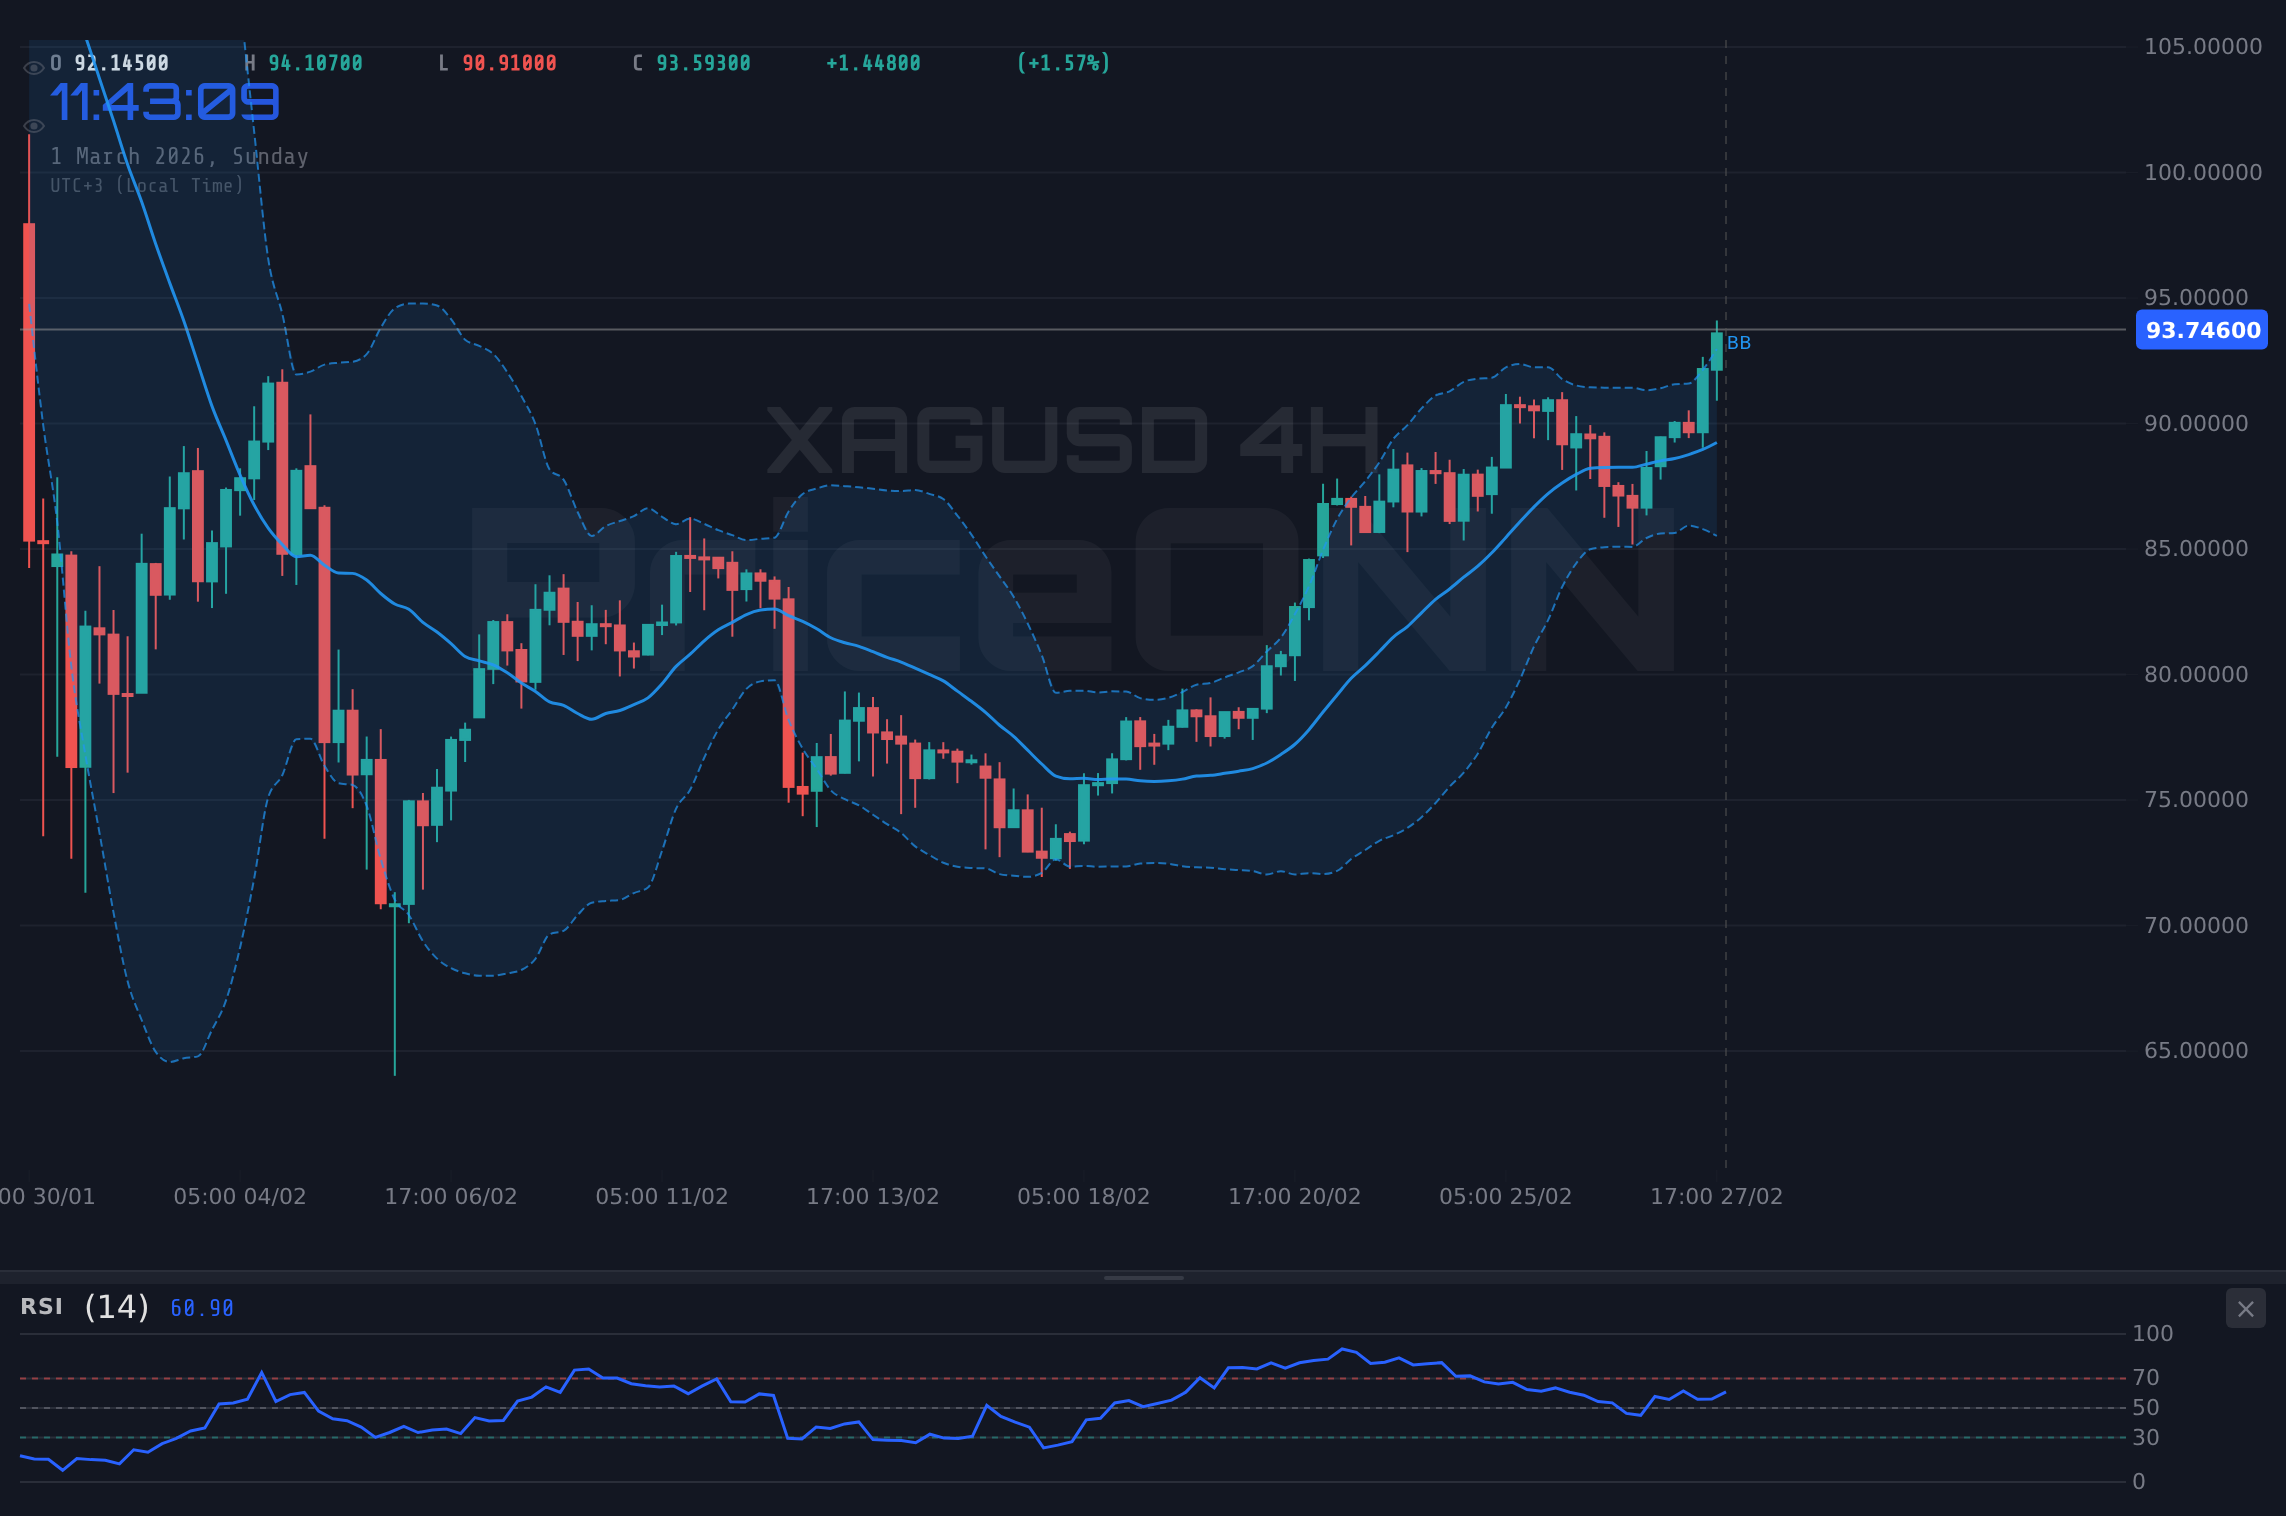
Last week saw a substantial rally in silver prices, driven by a confluence of factors including rising inflation fears and concerns about potential overvaluation in AI-related stocks. As PriceONN market news highlighted throughout the week, XAGUSD benefited from safe-haven demand as investors sought refuge from market uncertainty. The surge propelled silver past several key resistance levels, ultimately closing near $93.75 last Friday. The 1-hour chart shows a strong uptrend with the ADX at 28.27 indicating a solid bullish trend, but the RSI at 70.3 suggests the market may be due for a breather. The Stochastic oscillator shows K=84.38, D=84.53, confirming overbought conditions.
The 4-hour timeframe paints a similar picture, with an RSI of 70.19 indicating overbought territory. However, the ADX sits at a more moderate 18.84, suggesting the trend isn't as strong as the hourly chart indicates. Key support on this timeframe lies at $89.92, while resistance is found near $93.54. The daily chart reveals a more neutral outlook, with the RSI at 58.36. The daily ADX is at 23.9, indicating a moderate uptrend. Support on the daily timeframe is at $85.51, with resistance at $90.62.
The silver price has been reacting to a weakening dollar, as the DXY currently sits at 97.32, down 0.14% on the day. The weaker dollar makes silver more attractive to international buyers, adding to the upward pressure on prices. The SP500 is down 0.29% at 6871.77, indicating some risk-off sentiment in the market, which also supports silver's safe-haven appeal.
Geopolitical Drivers: Iran and Safe-Haven Demand
The recent killing of Iran's Supreme Leader Khamenei in a US-Israeli strike has significantly heightened geopolitical tensions in the Middle East. This event, as reported by Iranian state television, has triggered fears of disruptions in the Strait of Hormuz, a critical chokepoint for global oil supplies. The resulting uncertainty has fueled safe-haven demand for precious metals, including silver. As noted by PriceONN market news, the intensified conflict has the potential to push XAGUSD past the $100 mark. The surge in oil prices, with Brent at $65.73 and WTI at $67.38, further underscores the market's anxiety over potential supply disruptions and inflationary pressures.
The market is also closely monitoring OPEC+'s response to the escalating tensions. Reports indicate that OPEC+ is considering a significant increase in oil production to mitigate potential supply shortages. However, the effectiveness of this measure in calming market jitters remains to be seen. The death of Khamenei has triggered fears and dual safe-haven demand, increasing speculation that XAGUSD could move past $100.
Economic Data: Nonfarm Payrolls in Focus
Aside from geopolitical risks, the market's attention is also firmly fixed on the upcoming Nonfarm Payrolls (NFP) data. The NFP release is a key indicator of the health of the US labor market and can significantly influence Federal Reserve policy decisions. The high-impact USD events are the focus of investors. The upcoming data will provide insights into the strength of the labor market and its potential impact on inflation. Investors are reducing Fed rate-cut bets ahead of the NFP and ISM PMI data. A strong NFP number could lead to a more hawkish stance from the Fed, potentially strengthening the dollar and putting downward pressure on silver prices. Conversely, a weaker-than-expected NFP could reinforce expectations of Fed rate cuts, weakening the dollar and supporting silver prices.
Key Levels to Watch: Support and Resistance
Given the current market dynamics, it's crucial to identify key support and resistance levels for XAGUSD. On the upside, immediate resistance lies near the daily high of $94.11. A break above this level could open the door for a test of $94.91, the 4-hour resistance level. Further resistance is seen at $95.74, the daily resistance level.
On the downside, immediate support is found near $92.82, the 1-hour support level. A break below this level could lead to a test of $89.92, the 4-hour support level. Further support is seen at $85.51, the daily support level. The ADX on the 1-hour timeframe is at 28.27, indicating a moderately strong uptrend. However, the RSI at 70.3 signals overbought conditions, suggesting a potential pullback in the near term.
The Stochastic oscillator on the 1-hour chart shows K=84.38 and D=84.53, confirming the overbought conditions. The MACD on the 1-hour chart is positive, indicating continued bullish momentum. The market is currently pricing in a potential increase in oil production, potentially up to 411,000 bpd, in response to escalating tensions. This is a key level to watch because if the tensions rise, XAGUSD will likely rise as well. The 1-hour support levels are 92.82, 92.48, and 92.15. The 1-hour resistance levels are 93.48, 93.81, and 94.15.
The current trend is bullish, with a strength of 89% on the 1-hour timeframe. The overall signal is AL, with 6 indicating to buy, 2 to sell, and 0 neutral. The 4-hour support levels are 89.92, 87.67, and 86.3. The 4-hour resistance levels are 93.54, 94.91, and 97.16. The daily support levels are 85.51, 82.79, and 80.39. The daily resistance levels are 90.62, 93.02, and 95.74. The EURUSD is at 1.18106, up 0.12% on the day. The USDJPY is at 156.089, down 0.01% on the day. The GBPUSD is at 1.34735, down 0.04% on the day.
Risk/Reward Considerations
While the bullish momentum in silver remains strong, it's essential to consider the potential risks. The overbought conditions indicated by the RSI and Stochastic oscillators suggest a potential pullback in the near term. A stronger-than-expected NFP number could also trigger a sell-off in silver. The death of Khamenei has spurred increased speculation that silver could pass $100.
Trading Strategy: Cautious Optimism
Given the current market dynamics, a cautious approach is warranted. Traders may consider taking profits on existing long positions and waiting for a pullback before re-entering the market. Key levels to watch for potential entry points include the 1-hour support level at $92.82 and the 4-hour support level at $89.92. A break above the daily resistance level at $90.62 could signal a continuation of the uptrend.
The current pullback represents a chance for traders. The Stochastic Oscillator on the 1-hour chart has a K value of 84.38 and a D value of 84.53. The 4-hour chart is showing a positive momentum. The 1-day chart is showing a positive momentum. The daily stochastic oscillator has a K value of 90.67 and a D value of 83.47, which is an indication of overbought conditions. The overbought conditions could lead to a potential pullback. The ADX on the 4-hour is a zayıf trend.
Key Levels
Support Levels
Resistance Levels
Multi-Timeframe Analysis
The technical analysis of XAGUSD across multiple timeframes reveals a complex picture. The 1-hour chart shows a strong uptrend, but overbought conditions suggest a potential pullback. The 4-hour chart confirms the overbought conditions, but the ADX indicates a weaker trend. The daily chart presents a more neutral outlook, with the RSI in the neutral zone.
The multi-timeframe analysis highlights the importance of patience and careful risk management. Traders should avoid chasing the market higher and wait for a pullback before entering long positions. Key levels to watch for potential entry points include the 1-hour support level at $92.82 and the 4-hour support level at $89.92.
The stochastic oscillator on the daily chart is at a level of 90.67, which is indicative of overbought conditions. The ADX on the daily chart is at a level of 23.9, which is indicative of a medium-strength trend.
Technical Outlook Summary
| Indicator | Value | Signal |
|---|---|---|
| RSI (14) 1H | 70.3 | Overbought |
| MACD Histogram 1H | Positive | Bullish |
| Stochastic 1H | K=84.38, D=84.53 | Overbought |
| ADX 1H | 28.27 | Strong Trend |
| Bollinger 1H | Upper Band | Watch |
| RSI (14) 4H | 70.19 | Overbought |
| MACD Histogram 4H | Positive | Bullish |
| Stochastic 4H | K=91.07, D=67.06 | Oversold |
| ADX 4H | 18.84 | Watch |
| Bollinger 4H | Upper Band | Watch |
| RSI (14) 1D | 58.36 | Watch |
| MACD Histogram 1D | Positive | Bullish |
| Stochastic 1D | K=90.67, D=83.47 | Oversold |
| ADX 1D | 23.9 | Watch |
| Bollinger 1D | Upper Band | Watch |
Frequently Asked Questions: XAGUSD Analysis
Is XAGUSD a good buy right now?
XAGUSD is showing overbought signals in the short-term, but the overall trend is bullish. Waiting for a pullback to the $92.82 support level could present a better entry point.
What is the XAGUSD price forecast for this week?
The XAGUSD price forecast for this week is bullish, with a potential test of the $94.91 resistance level. However, overbought conditions suggest a pullback is possible before further gains.
What are the key support and resistance levels for XAGUSD?
Key support levels for XAGUSD are $92.82 and $89.92. Key resistance levels are $93.54 and $94.91.
Why is XAGUSD moving today?
XAGUSD is moving higher today due to a combination of geopolitical tensions in the Middle East and a weaker dollar. Safe-haven demand is also supporting silver prices.
Track markets in real-time
AI-powered analysis, technical indicators and real-time price data.
Join Our Telegram Channel
Breaking market news, AI analysis and trading signals instantly.
Join Channel