This is where things get interesting for silver traders. XAGUSD is currently hovering around the critical $75.53 mark, a level that has historically acted as a significant point of contention between buyers and sellers. The latest market data shows silver trading precisely at $75.53, exhibiting a notable 2.53% daily gain. However, the technical landscape is far from clear-cut, presenting a complex picture with conflicting signals across different timeframes. Understanding these divergences is key to navigating the choppy waters ahead.
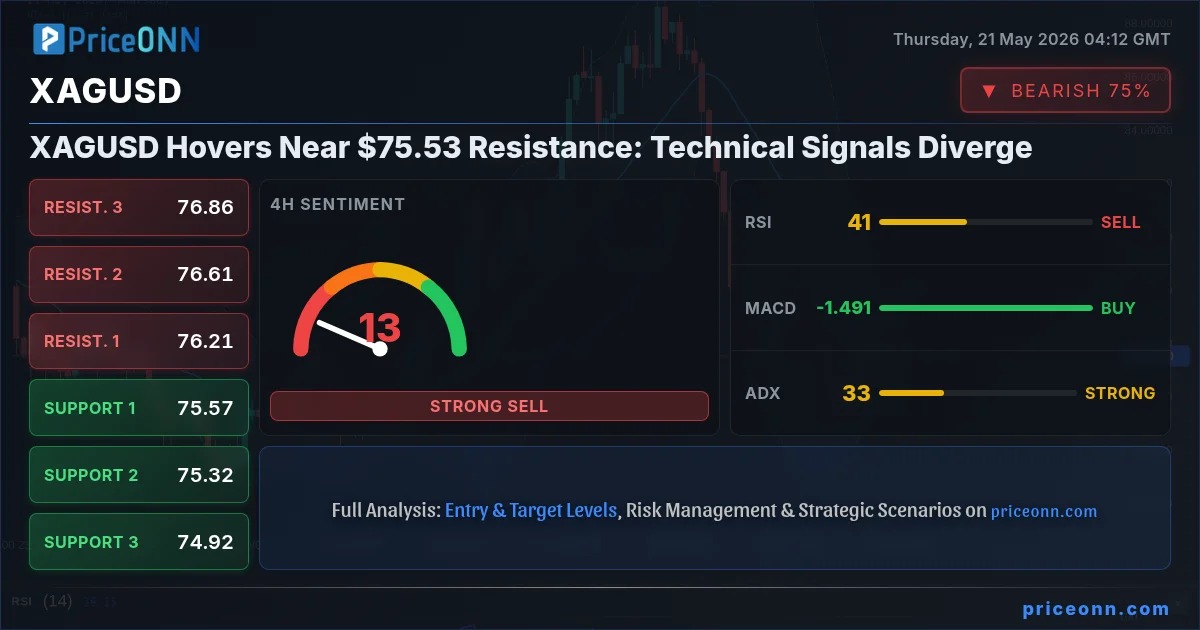
- RSI at 49.82 on the 1H chart signals weakening momentum, while the 4H RSI at 41.06 and 1D RSI at 46.4 indicate a bearish tendency.
- The ADX indicator shows mixed strength: strong trend signals on the 4H (42.06) and 1H (28.68) contrast with a weak trend on the 1D (19.71).
- Stochastic indicators are flashing conflicting signals: a bearish signal on the 1H (%K %D), and a bearish signal on the 1D.
- Key support for XAGUSD is identified at $74.84, while resistance looms around $76.19 on the 1H chart.
- The current price action suggests consolidation is likely, with a potential for a breakout above $76.19 or a rejection back towards $74.84.
The daily chart paints a picture of a market that, despite a recent upward move, is fundamentally in a weaker position. The overall trend on the daily timeframe is decidedly bearish, with a 100% power rating. This is underpinned by a current price of $75.53, which sits below the medium-term resistance at $77.32, and further down from the more significant resistance levels at $80.98 and $83.11. The daily RSI is sitting at 46.4, firmly in neutral territory but with a downward inclination, suggesting that the recent rally may be losing steam. Similarly, the MACD is showing negative momentum, lurking below its signal line, which is a classic sign of bearish pressure building. Bollinger Bands on the daily chart are also positioned below the middle band, reinforcing the bearish sentiment. The Stochastic oscillator, with %K at 16.3 and %D at 51.68, is deeply in oversold territory and flashing a bearish signal, indicating that bears have a stronger grip on the longer timeframe.
However, diving into the shorter timeframes reveals a different story, creating the divergence that is so critical for traders to understand. On the 1-hour chart, the trend is technically neutral with 50% power, but the momentum is decidedly mixed. The RSI is at 49.82, hovering just below the neutral 50 mark and showing a slight downward tendency, which aligns with the broader bearish outlook. The MACD, while showing positive momentum and trading above its signal line, is not giving a strong conviction. The Stochastic oscillator on the 1H is displaying a bearish signal with %K at 32.17 and %D at 56.2. Yet, the ADX is sitting at a relatively strong 14.64, which typically indicates a trend is present, but its low value suggests it's a weak one. The immediate support on this timeframe is at $74.84, with further levels at $74.33 and $73.49, while resistance is eyed at $76.19, $77.03, and $75.54.
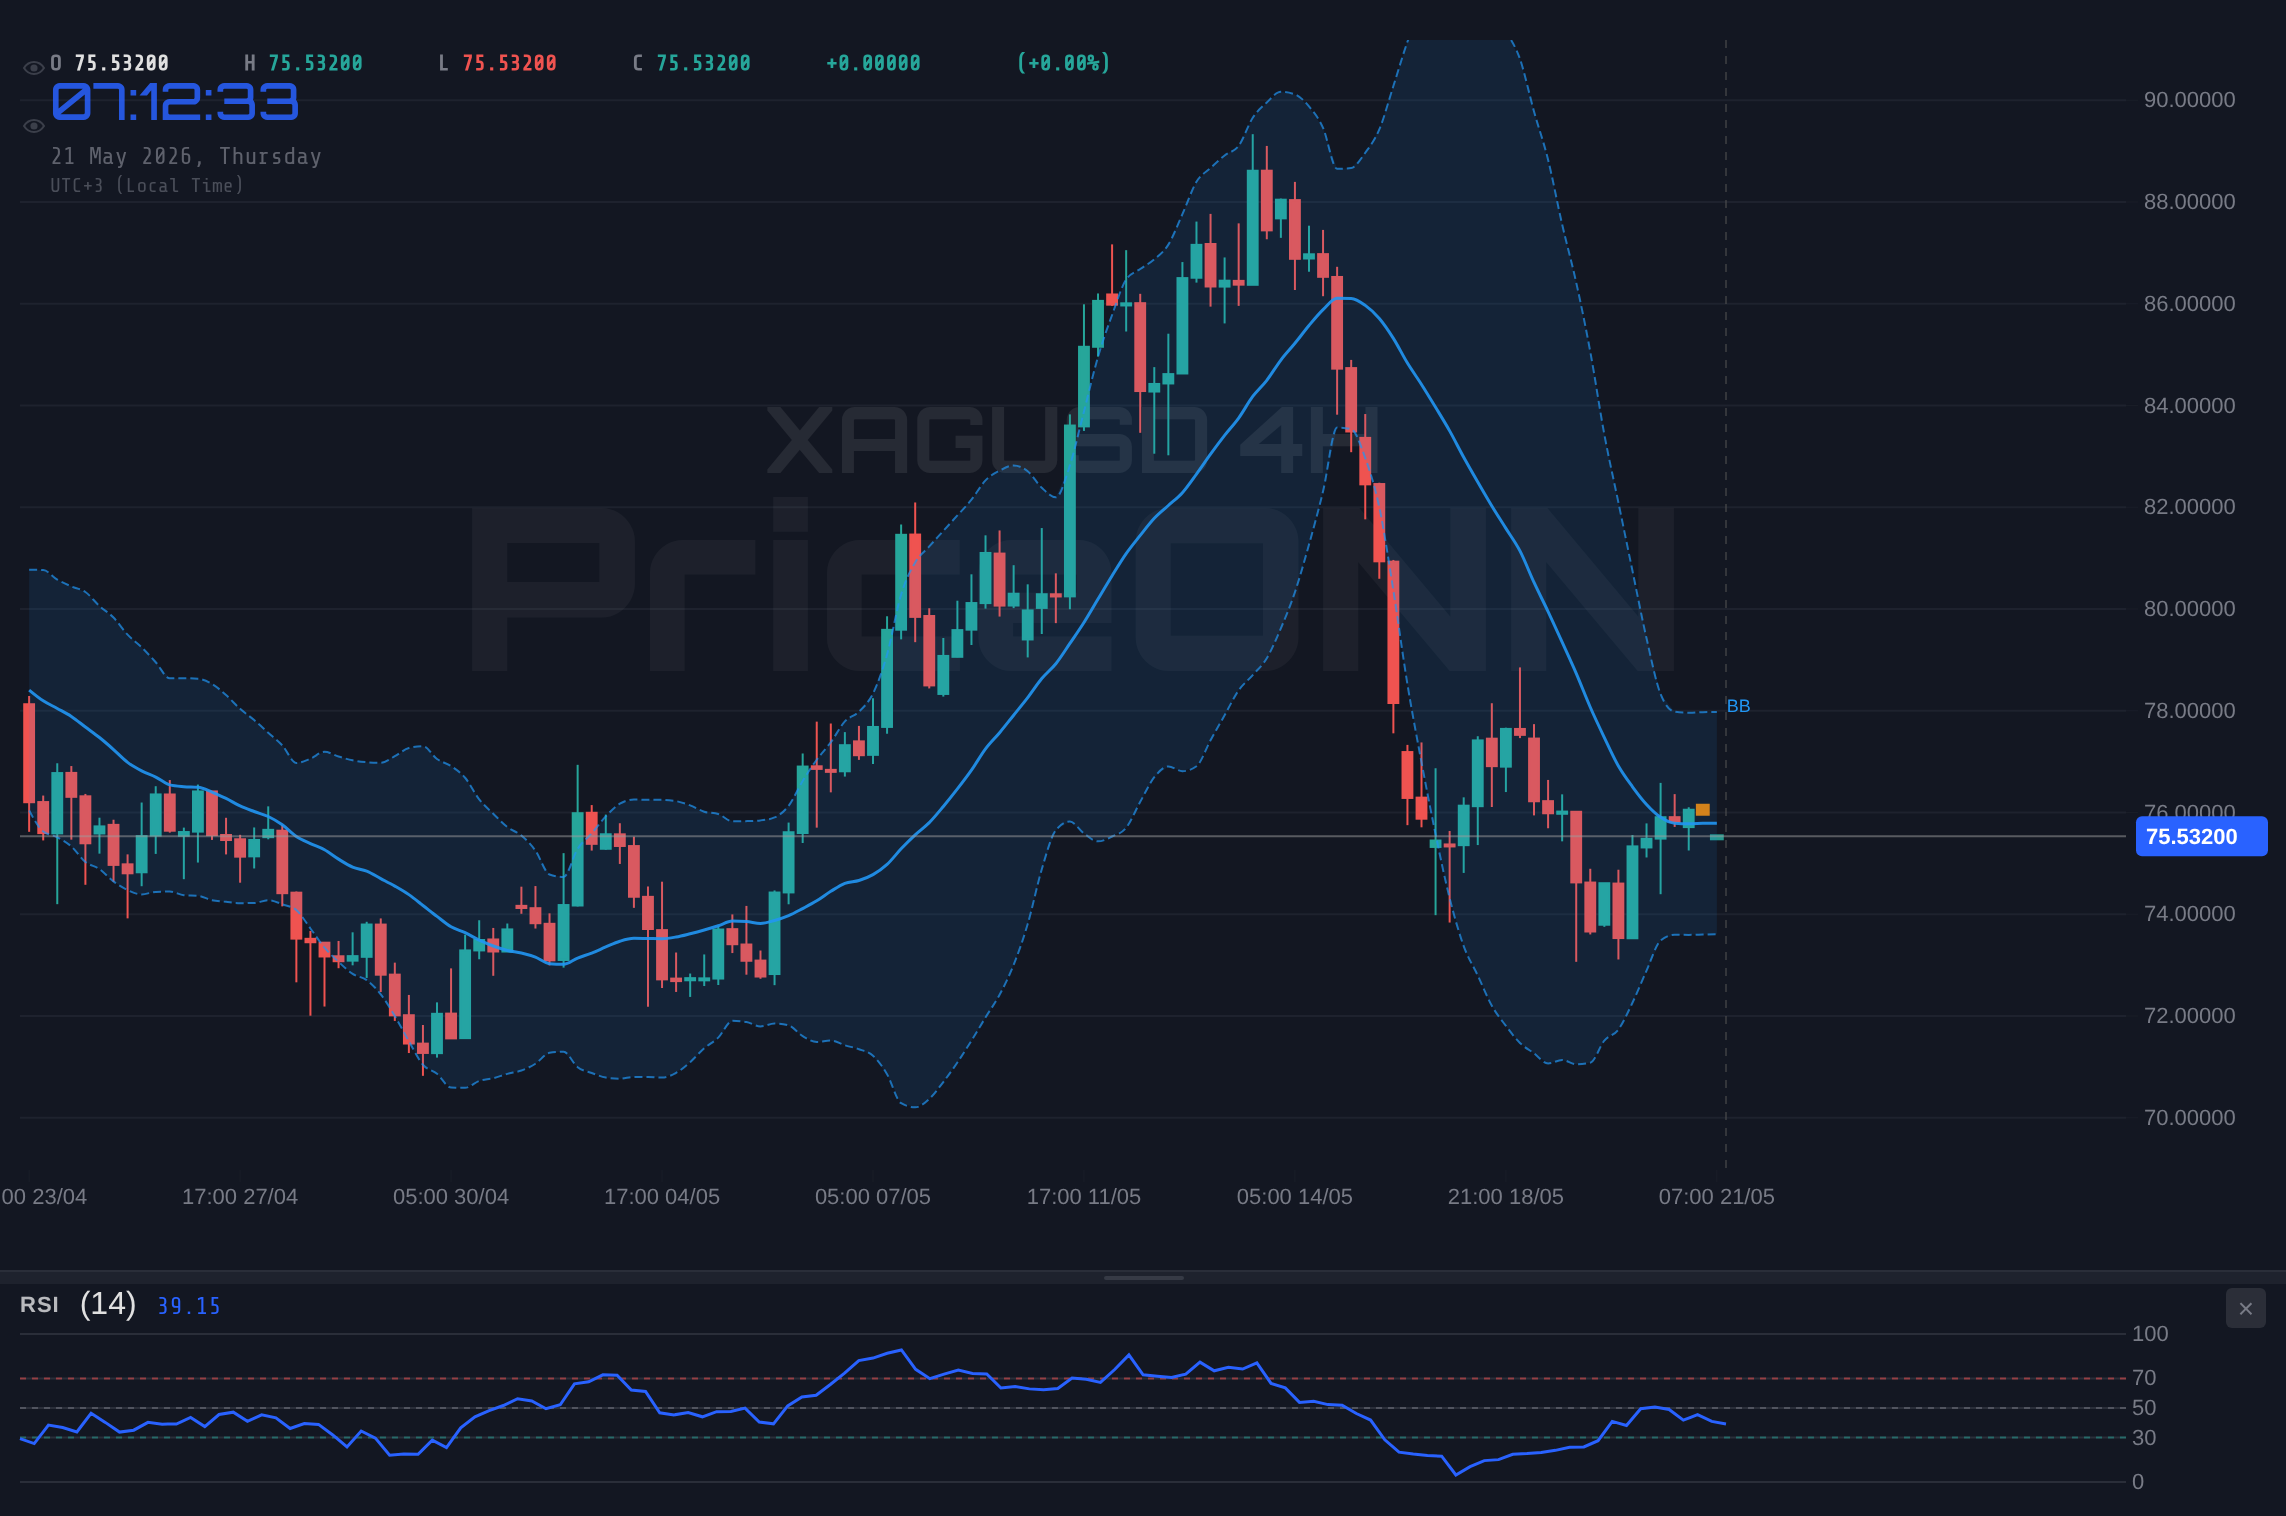
The 4-hour chart presents a more complex scenario, with a neutral trend strength but a strong downward trend reading from the ADX at 42.06. This suggests that while the price action might be consolidating, the underlying forces are pushing for a bearish continuation. The RSI here is at 41.06, reinforcing the bearish lean seen on the daily chart. The MACD is showing positive momentum and is above its signal line, which is a slight deviation from the longer-term bearish signals, but this could be short-lived. The Stochastic oscillator, however, is showing a bullish signal with %K at 75.89 and %D at 45.87, indicating a potential for a short-term bounce or that the pair is entering overbought territory on this timeframe. Support levels on the 4H are tightly clustered around $75.57, $75.32, and $74.92, while resistance sits at $76.21, $76.61, and $76.86. This tight clustering of levels suggests that price action could be volatile around these points.
This conflicting technical picture across timeframes is precisely what creates trading opportunities, but also significant risk. The ADX indicator, a measure of trend strength, provides a fascinating insight. On the 1-hour chart, the ADX stands at 28.68, indicating a strong upward trend, which seems counterintuitive given the daily and 4-hour bearish leanings. However, the 4-hour ADX at 42.06 screams 'strong trend,' but paradoxically, the daily ADX is only 19.71, signaling a weak trend. This discrepancy suggests that the current price action might be experiencing short-term momentum shifts that are not yet reflected in the longer-term trend. Traders must be aware that the 'strong trend' signals on the shorter timeframes could be part of a larger corrective move within a dominant daily downtrend. The general signal across all timeframes is predominantly 'SELL' (15 Sell, 4 Buy, 0 Neutral), which heavily favors a bearish outlook despite short-term bullish signals from some indicators like the 4H Stochastic.
Considering the correlation with broader market indicators is also crucial. The DXY (Dollar Index) is currently trading at 98.94, showing a slight daily decrease of 0.11%. Historically, a strengthening DXY puts pressure on precious metals like silver. Conversely, a weakening dollar can provide a tailwind for XAGUSD. The current slight dip in the DXY might be offering some temporary relief to silver, but the overall trend of the dollar index on the 4H chart is strongly bullish (99% power), suggesting that any dollar weakness could be short-lived. Equity markets, represented by the SP500 and Nasdaq, are showing strength. The SP500 is up 0.74% at 6572.87, and the Nasdaq is up 1.68% at 29287.51. Stronger equity markets generally indicate increased risk appetite, which can sometimes lead investors away from safe-haven assets like gold and silver. However, silver's price action in this specific instance seems to be driven more by its own technical factors and perhaps a specific inflation narrative rather than broad risk sentiment alone. The crude oil price, a key inflation indicator, has seen a significant drop of -4.83% for Brent, currently at $107.47, and -4.64% for WTI at $102.57. This decline in oil prices could signal easing inflation expectations, which would typically be bearish for precious metals.
The recent news flow also adds context. Reports indicate that crude oil prices plunged significantly amid shifting U.S.-Iran diplomacy and conflicting U.S. inventory data. This geopolitical tension and its impact on energy prices can indirectly affect silver, often seen as a hedge against inflation and geopolitical instability. If oil prices are falling due to de-escalation, it might reduce the safe-haven appeal of silver. Furthermore, reports suggest the US dollar is surging as Treasury yields climb past 4.65%, driven by hawkish Federal Reserve expectations and geopolitical tensions. This dollar strength, if sustained, would be a headwind for XAGUSD. The Eurozone inflation data showing a reheat while UK inflation cools also creates a complex macro environment, impacting EUR/USD which, in turn, influences XAGUSD through its correlation with the dollar.
Given this intricate technical and fundamental backdrop, a clear trading strategy must be defined. The overwhelming sell signals on the daily chart, coupled with the bearish lean on the 4-hour RSI and the conflicting Stochastic signals, suggest that the path of least resistance for XAGUSD is likely downwards. However, the strong ADX readings on the shorter timeframes and the current price action near resistance cannot be ignored. This points towards a potential for volatility and the possibility of a short-term bounce before a potential continuation of the downtrend. The key will be observing how price action behaves around the immediate support and resistance levels.
The immediate resistance level to watch is $76.19. A decisive close above this level on a significant volume could signal a short-term bullish continuation, potentially targeting $77.03 and then $77.54. This scenario would likely require a weakening DXY and perhaps a shift in broader market sentiment. Conversely, failure to break above $76.19, and a subsequent break below the immediate 1H support at $74.84, would confirm the bearish outlook. This could lead to a swift move towards the 4H support at $75.57 (which is the current price, implying a breakdown from here), then $75.32, and ultimately the more significant daily support levels starting at $74.33.
Risk management remains paramount. The conflicting signals mean that stop-loss orders should be placed diligently. For a bearish position initiated on a break below $74.84, a stop could be placed just above the 1H resistance at $76.19. For a bullish breakout scenario above $76.19, a stop could be set just below the 1H support at $74.84. The overall weak trend on the daily chart (ADX 19.71) suggests that any upward moves might be corrective rather than a true trend reversal, reinforcing the cautious approach needed.
The market is currently presenting a tug-of-war between short-term momentum and long-term bearish trends. While the daily indicators lean heavily towards a sell, the shorter timeframes offer glimpses of potential bounces. The $75.53 price point is a battleground. Traders should be prepared for potential chop around this level, but the prevailing technical indicators on the daily chart suggest that sellers have the upper hand in the long run. Patience will be key, waiting for a clear break of either the immediate support or resistance to confirm the next directional move.
Bearish Scenario: The Weight of the Daily Trend
65% ProbabilityNeutral Scenario: Consolidation Around $75.53
25% ProbabilityBullish Scenario: Short-Term Momentum Surge
10% Probability| Indicator | Value | Signal | Interpretation |
|---|---|---|---|
| RSI (14) | 49.82 | Neutral | Hovering below 50, slight bearish lean on 1H; Daily RSI at 46.4 shows broader bearish tendency. |
| MACD | Positive Momentum | Bullish | Above signal line on 1H, but daily MACD shows negative momentum. Conflicting signals. |
| Stochastic | K=32.17, D=56.2 | Bearish | 1H shows %K |
| ADX | 14.64 | Weak Trend | Suggests current price action lacks strong directional conviction, despite mixed signals on other timeframes. |
| Bollinger Bands | Mid Band | Watch | Price is below middle band on daily and 4H, indicating bearish pressure. 1H shows price above middle band, suggesting short-term strength. |
Frequently Asked Questions: XAGUSD Analysis
What happens if XAGUSD breaks below the $74.84 support level on the 1H chart?
A break below $74.84 would validate the bearish scenario, potentially triggering a move towards the next support at $74.33. This would align with the dominant daily downtrend signals.
Is the current RSI reading of 49.82 a sell signal for XAGUSD at $75.53?
While not an extreme sell signal, an RSI below 50 with a bearish tendency on the 1H chart, combined with daily bearish indicators, suggests caution. It indicates that bullish momentum is not strong enough to overcome the prevailing downward pressure.
How will the falling crude oil prices affect XAGUSD's trend analysis?
Falling oil prices, like the recent drop in WTI and Brent, can signal easing inflation expectations. This is typically bearish for precious metals like silver, which are often seen as inflation hedges, potentially reinforcing the downtrend.
How will the strengthening US Dollar and rising Treasury yields impact XAGUSD's price action this week?
A strengthening US Dollar, driven by rising yields and hawkish Fed expectations, generally acts as a headwind for XAGUSD. This could pressure silver prices lower, especially if the DXY continues its bullish trend observed on the 4H chart.
Navigating the silver market at $75.53 requires a keen eye on the conflicting technical signals and the broader macroeconomic context. While short-term indicators offer glimpses of potential upward movement, the daily chart's bearish bias, supported by falling oil prices and a potentially strengthening dollar, presents a significant headwind. The most probable scenario favors a continuation of the downtrend, with key support levels to watch closely. However, a decisive break above resistance could open the door for a short-term rally. Ultimately, disciplined risk management and patience in waiting for clear directional cues will be crucial for traders in the coming sessions. Volatility creates opportunity - those prepared will be rewarded.
Track markets in real-time
AI-powered analysis, technical indicators and real-time price data.
Join Our Telegram Channel
Breaking market news, AI analysis and trading signals instantly.
Join Channel