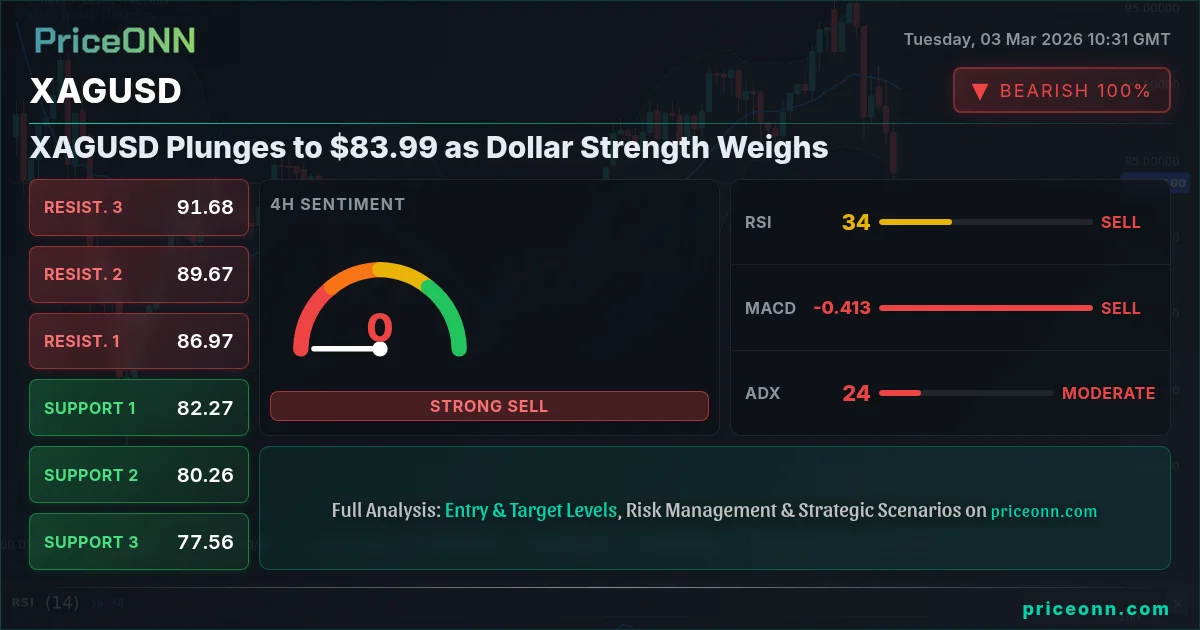
Silver (XAGUSD) is under significant pressure, currently trading at $83.99, a sharp decline driven by a strengthening Dollar Index (DXY) and disappointing PMI data. This move raises questions about the sustainability of silver's recent gains and whether this dip presents a buying opportunity for savvy investors. The overall signal is SELL based on today's data.
XAGUSD technical analysis reveals a bearish trend dominating the shorter timeframes. On the 1-hour chart, the trend is clearly down, with a strength rating of 97%. This is not a weak signal- selling pressure is intense. The ADX confirms this view, sitting at 34.46, indicating a strong downtrend. Remember- trend is your friend until it isn't.
The Relative Strength Index (RSI) on the 1H chart is at 33.13, hovering near oversold territory. While this might suggest a potential for a bounce, it's crucial to remember that oversold conditions can persist in a strong downtrend. The MACD histogram is printing negative values, reinforcing the bearish momentum. The Stochastic indicator, with K=28.69 and D=38.43, also points to further downside, with %K remaining below %D.
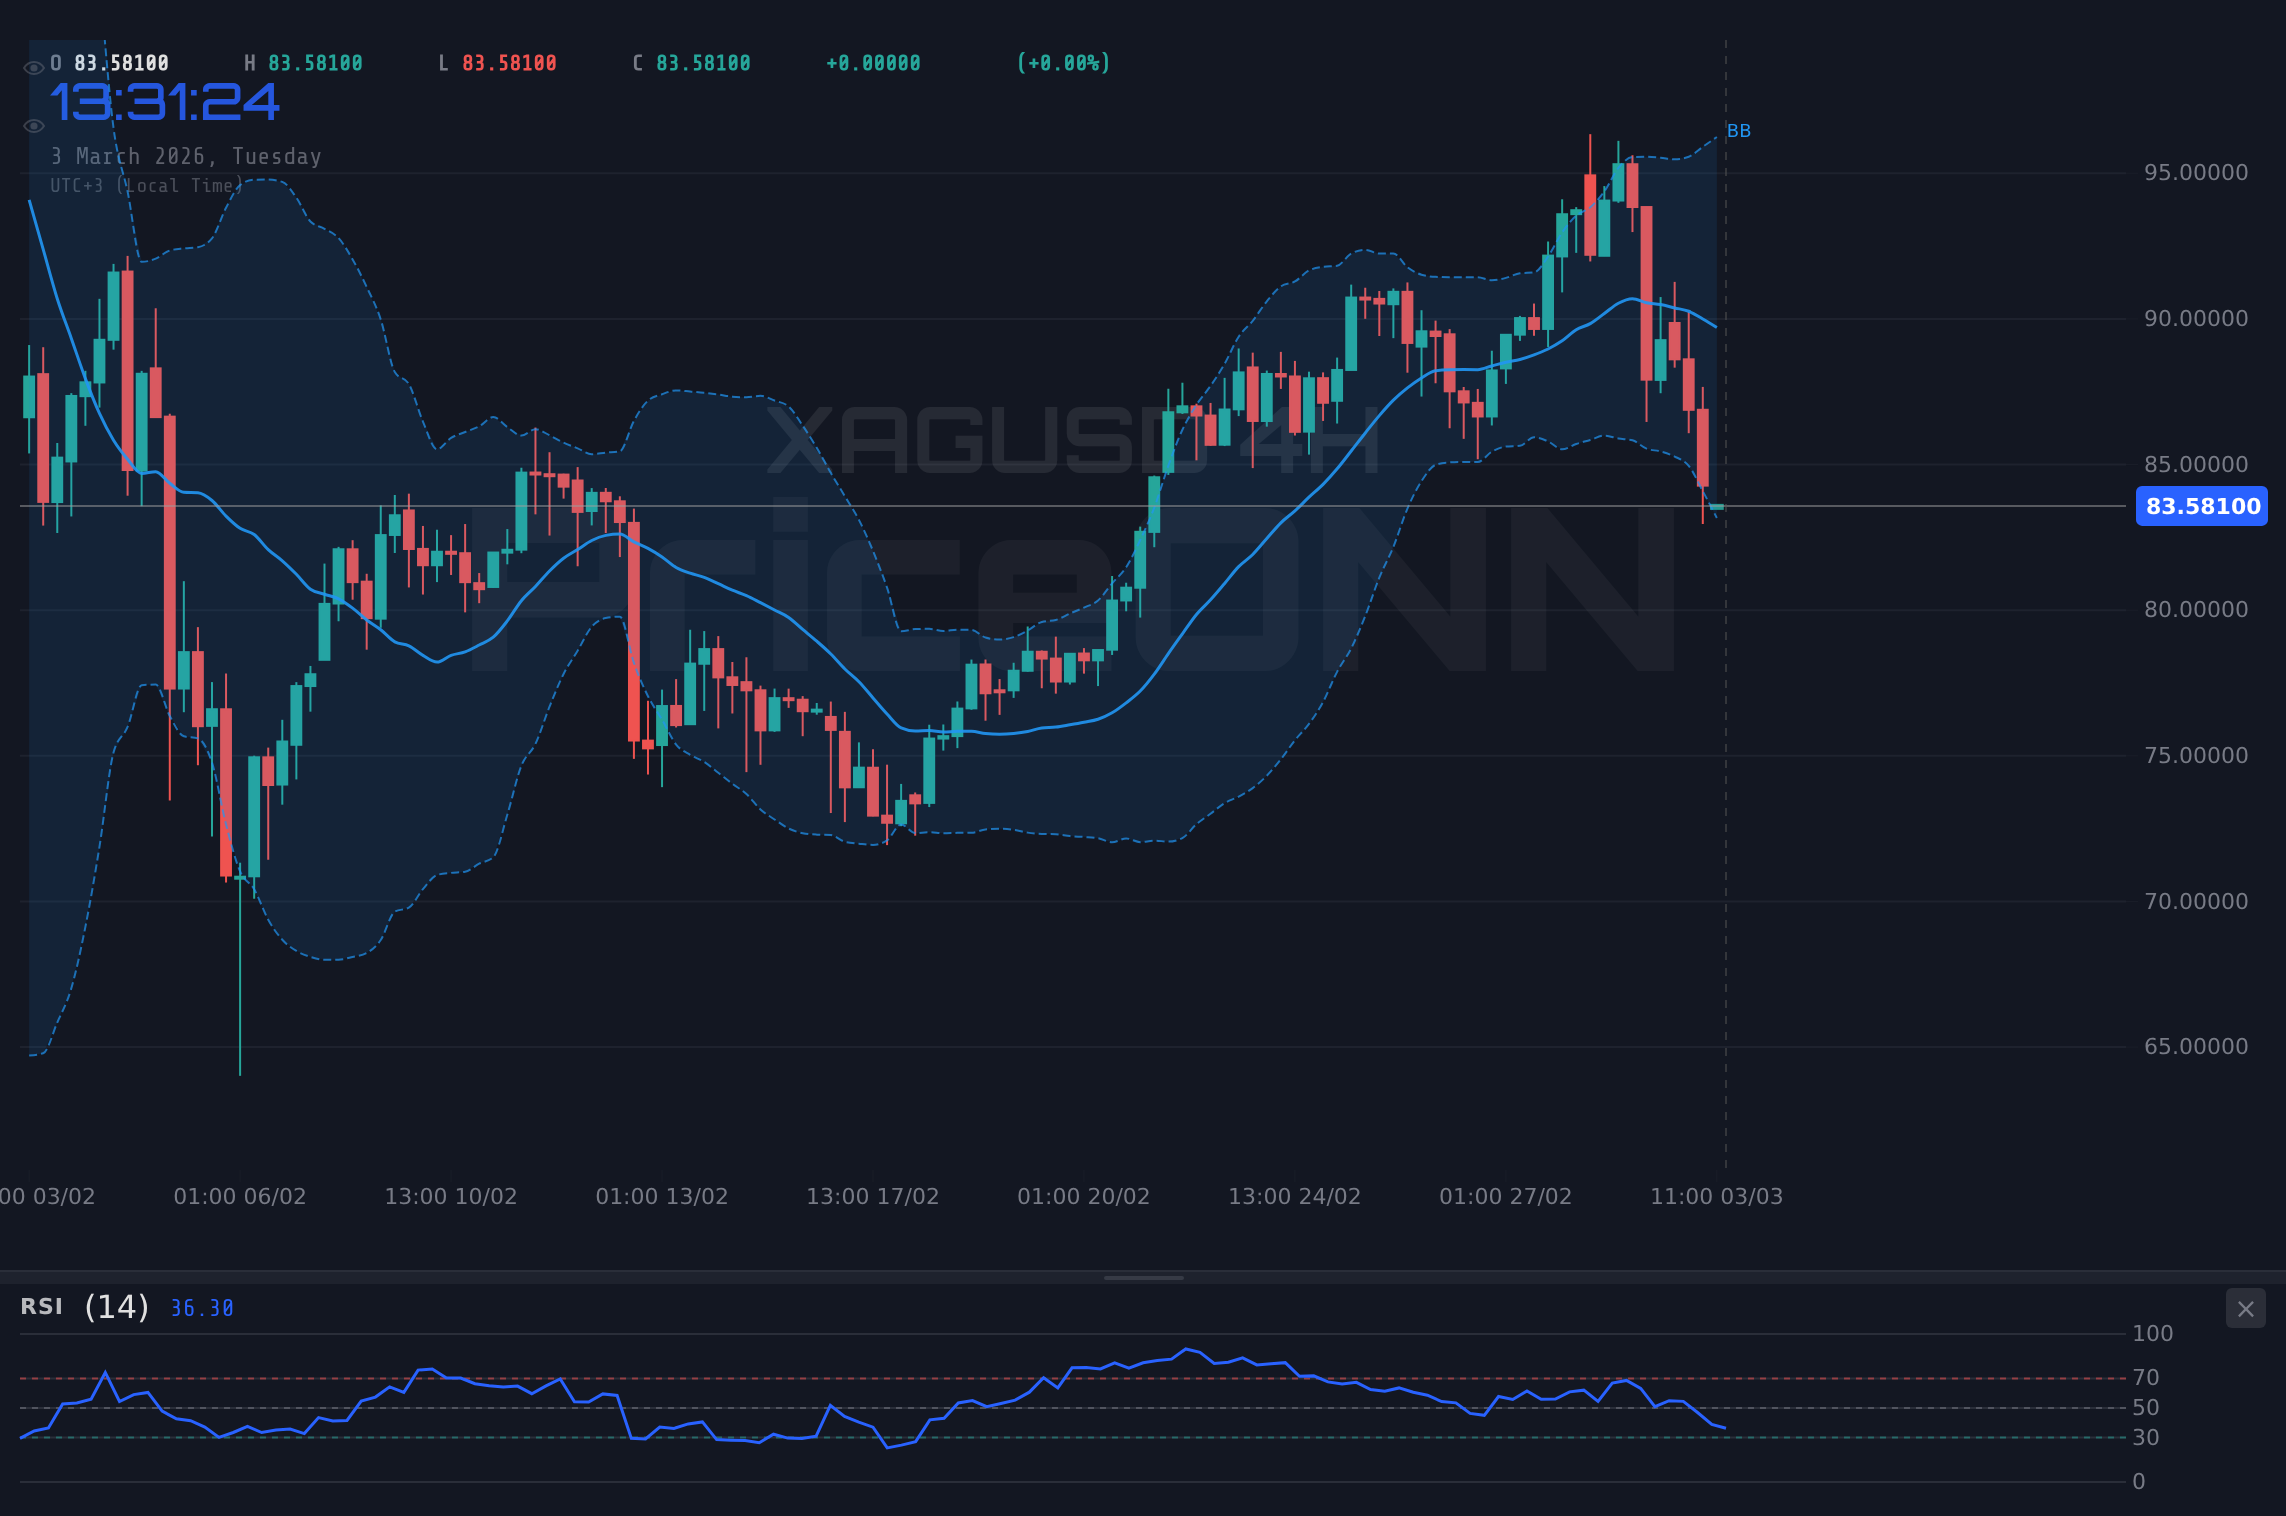
Looking at the 4-hour timeframe, the trend remains neutral overall, but the indicators lean bearish. RSI is at 37.38, while the Stochastic shows K=12.42 and D=37.13, signaling a continued downward trajectory. The ADX at 22.79 suggests moderate trend strength, implying the bears are not entirely in control, but are certainly applying pressure. The general signal in the 4H timeframe is SELL as well.
On the daily chart, the overall trend is neutral. However, the RSI at 49.1 is trending downward. The Stochastic, although showing a K value of 68.99 and a D value of 85.59- is signaling a downward shift as %K is trending to move below %D. The ADX reads 22.44, indicating a moderate uptrend. Overall, the daily timeframe presents a mixed picture, requiring caution. This means we need to focus on the short term charts to determine our trading plan.
Key support levels to watch include $83.97, followed by $82.99 and $81.14 on the 1-hour chart. These levels could act as potential areas of consolidation or bounce-back. However, a break below these levels could trigger further selling pressure. On the upside, immediate resistance lies at $86.8, followed by $88.65 and $89.63.
Why is silver under pressure? The primary driver appears to be the strengthening Dollar Index (DXY). As reported by Forex News, the DXY has surged past 98.70 amid escalating tensions in the Middle East. A stronger dollar typically exerts downward pressure on precious metals like silver, as it makes them more expensive for holders of other currencies. With DXY at 98.89, XAGUSD is likely to remain under pressure.
Furthermore, recent PMI data has added to the bearish sentiment. While the specific data impacting silver directly isn't available in the provided economic calendar, weaker-than-expected PMI numbers generally signal a slowdown in economic activity, which can negatively impact industrial demand for silver. Remember- silver has industrial applications, which are correlated to economic activity.
Looking ahead, traders should keep a close eye on the upcoming U.S. ADP Nonfarm Employment Change on Wednesday, as well as the U.S. Services PMI and ISM Non-Manufacturing PMI data. These releases will provide further clues about the health of the U.S. economy and could significantly impact the dollar's trajectory and, consequently, silver prices. Initial Jobless Claims data on Thursday and Retail Sales on Friday will also provide insight into where the economy is heading.
From a trading perspective, the current technical picture suggests a cautious approach. The bearish momentum in the short term outweighs the neutral signals on the daily chart. Scalpers might look for short-term selling opportunities, while swing traders might wait for a clearer signal before committing to a direction. Long-term investors may find current levels attractive, but should be prepared for potential further downside.
If XAGUSD breaks above the $86.8 resistance, it could signal a shift in momentum, targeting $88.65 and potentially $89.63. This scenario is contingent on a weakening dollar and positive economic data.
A sustained break below $82.99 support could open the door for further declines, with targets at $81.14. This scenario is likely if the dollar continues to strengthen and economic data disappoints.
Given the current technical setup and the influence of the dollar, a bearish trade plan seems more prudent. Here’s a potential strategy:
Entry Trigger: Short XAGUSD at market ($83.99) or on a retest of $84.50
Target 1: $82.99
Target 2: $81.14
Stop/Invalidation: $86.8 (a break above this level negates the bearish thesis)
Probability: 60% (given the strength of the dollar and the short-term bearish momentum)
Risk Warning: The upcoming U.S. economic data releases (ADP Nonfarm Employment Change, Services PMI, and ISM Non-Manufacturing PMI) could trigger significant volatility in the dollar and, consequently, in silver prices. Manage your position size accordingly.
Technical Outlook Summary
| Indicator | Value | Signal |
|---|---|---|
| RSI (14) | 33.13 | Neutral |
| MACD Histogram | Negative | Bearish |
| Stochastic | K=28.69, D=38.43 | Bearish |
| ADX | 34.46 | Strong Trend |
| Bollinger | Lower Band | Watch |
Key Levels
Support Levels
Resistance Levels
Frequently Asked Questions: XAGUSD Analysis
Is XAGUSD a good buy right now?
Given the current bearish momentum and strong dollar, XAGUSD may not be a good buy right now. The price is $83.99, and a break below $82.99 could trigger further declines, suggesting caution.
What is the XAGUSD price forecast for this week?
The XAGUSD price forecast for this week is bearish, with potential targets at $82.99 and $81.14. A break above $86.8 would invalidate this bearish outlook. The probability is 60%.
What are the key support and resistance levels for XAGUSD?
Key support levels for XAGUSD are $83.97, $82.99, and $81.14. Key resistance levels are $86.8, $88.65, and $89.63. These levels will provide targets for short term trades.
Why is XAGUSD moving today?
XAGUSD is moving lower today due to a strengthening Dollar Index (DXY) amid geopolitical tensions and weaker-than-expected PMI data, which is negatively impacting industrial demand for silver.
Track markets in real-time
AI-powered analysis, technical indicators and real-time price data.
Join Our Telegram Channel
Breaking market news, AI analysis and trading signals instantly.
Join Channel