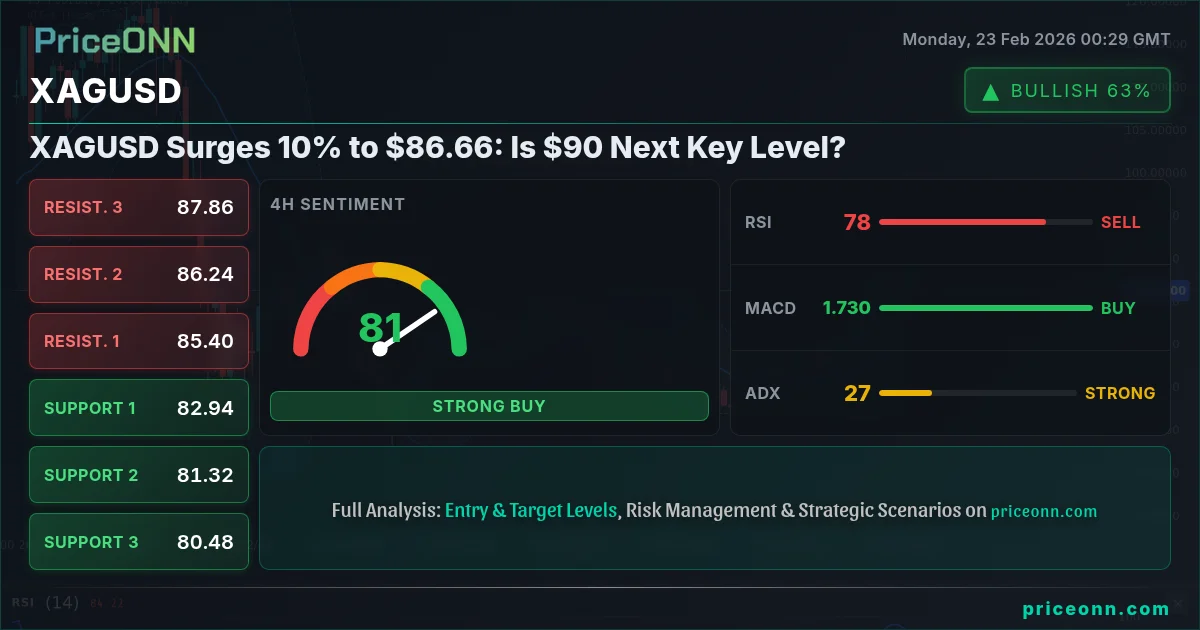
Silver just did something the bulls have been waiting for: a massive 10% surge to $86.66. The question now is whether this move has enough momentum to push through key resistance levels and target $90. Let's dive into the technicals and market sentiment to find out.
- XAGUSD's 1H RSI at 88.62 signals overbought conditions, suggesting potential for a pullback.
- Critical support for XAGUSD sits at $84.08, a level that needs to hold to maintain the bullish momentum.
- MACD histogram shows strong positive momentum, but divergence could signal waning bullish enthusiasm.
- DXY at 97.44 is declining, fueling XAGUSD's rally by weakening the dollar.
Why XAGUSD Volatility Analysis Points to a Breakout
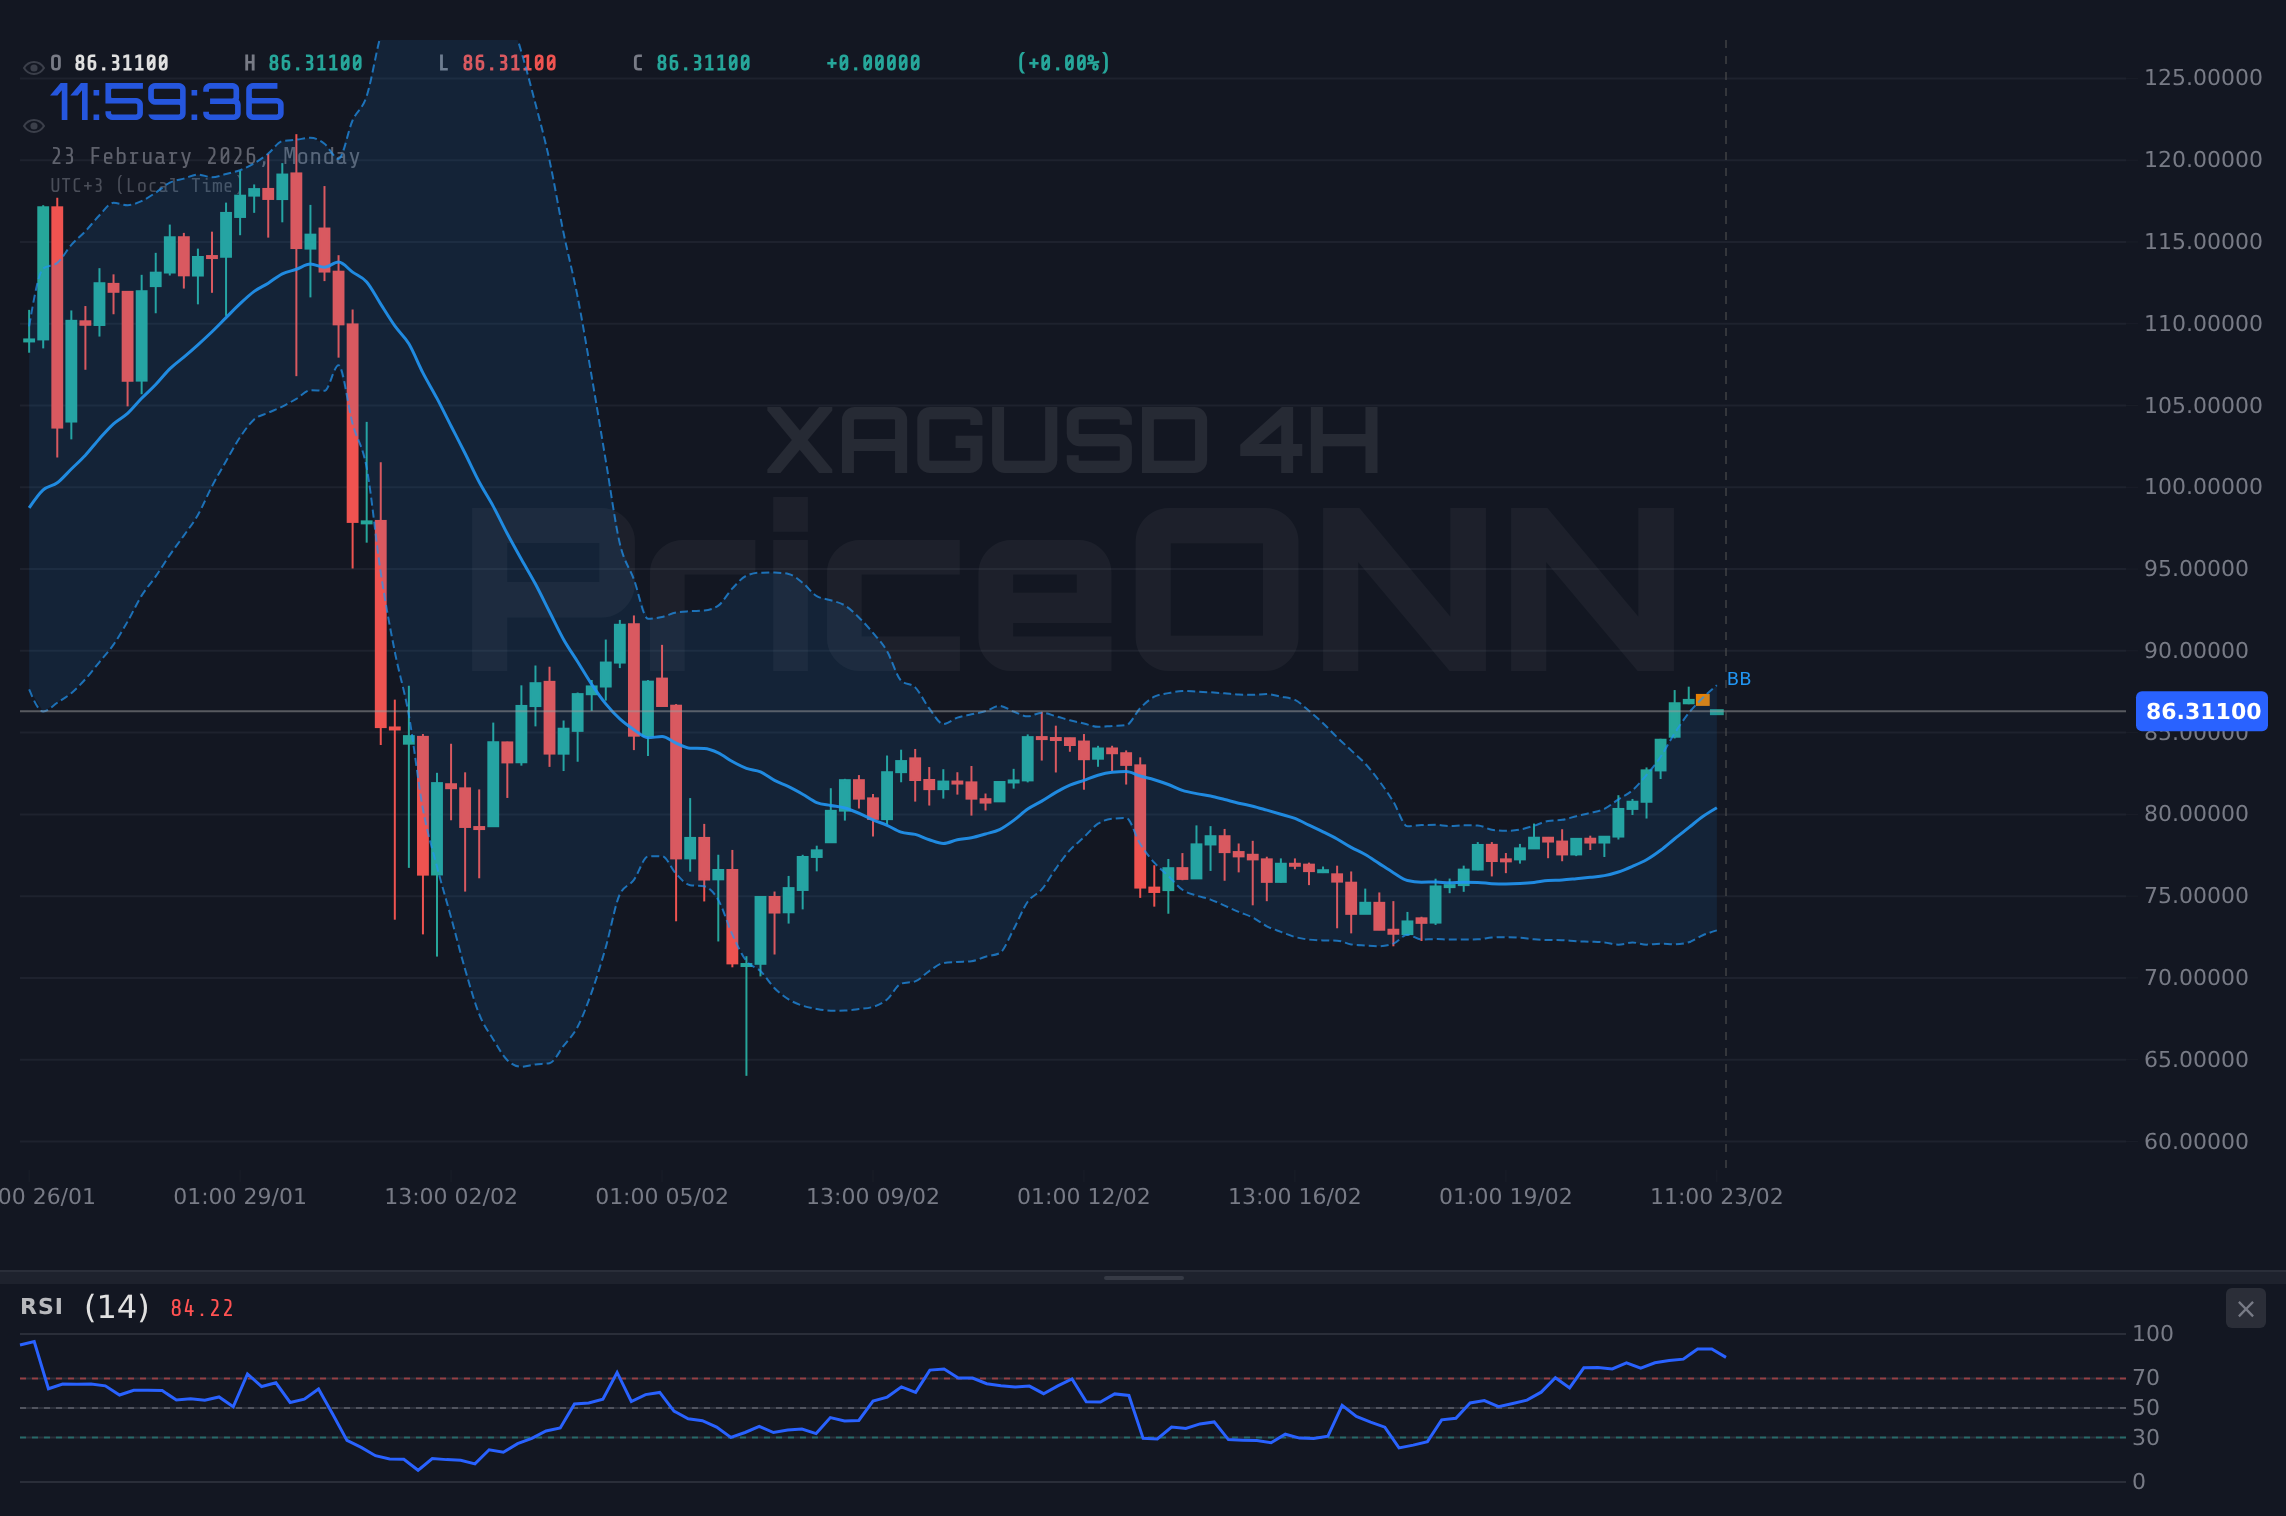
XAGUSD's recent performance has been nothing short of spectacular. The 10% gain to $86.66 is a clear indication of strong bullish sentiment. However, a closer look at the technical indicators reveals a more nuanced picture. The 1H RSI, for example, is flashing a warning sign. At 88.62, it's firmly in overbought territory, suggesting that the current rally may be unsustainable in the short term. Traders should be wary of a potential pullback or consolidation phase.
On the other hand, the MACD histogram is painting a more bullish picture. It shows strong positive momentum, indicating that buyers are still firmly in control. However, it's crucial to watch for any signs of divergence, which could signal that the bullish momentum is starting to wane. If the MACD starts to trend downward, it could be an early warning sign of a potential reversal.
The ADX on the 1H chart is currently at 34.72, indicating a strong upward trend. This suggests that the current rally has legs and could potentially continue higher. However, it's important to remember that the ADX is a lagging indicator, and it's always best to confirm its signals with other indicators and price action analysis.
What the Stochastic Signal Tells Us About XAGUSD Trend Analysis
The Stochastic oscillator is another key indicator to watch for XAGUSD. Currently, the %K line is at 96.22 and the %D line is at 95.86, both firmly in overbought territory. This reinforces the RSI's signal that the current rally may be overextended. However, it's important to remember that overbought conditions can persist for extended periods during strong uptrends. Therefore, it's crucial to wait for confirmation before taking any short positions.
Looking at the 4H chart, the Stochastic oscillator tells a similar story. The %K line is at 95.77 and the %D line is at 80.01, both in overbought territory. This suggests that the bullish momentum is starting to fade, and a pullback may be imminent. However, the ADX on the 4H chart is at 25.38, indicating a strong uptrend. This conflicting signal highlights the importance of multi-timeframe analysis and waiting for confirmation before making any trading decisions.
Multi-timeframe analysis is critical. The daily chart shows a different picture. The RSI is at 53.04, in neutral territory, suggesting more room to run. The Stochastic oscillator is also giving a bullish signal, with the %K line at 68.28 above the %D line at 48.34. This suggests that the long-term trend is still upward, and any short-term pullbacks may be buying opportunities.
$84.08: The Line in the Sand for XAGUSD Bulls
The key level to watch for XAGUSD is $84.08, which is the first support level on the 1H chart. A break below this level could signal a potential reversal and trigger a deeper pullback. If this level holds, it would confirm the bullish trend and open the door for a move towards higher targets.
On the upside, the immediate resistance level is at $84.83. A break above this level could trigger a further rally towards the next resistance levels at $85.11 and $85.59. These levels are crucial to watch as they could act as potential profit-taking zones or areas where the rally could stall.
Given the overbought conditions on the shorter timeframes, scalpers might look for short-term selling opportunities, targeting $84.83 and $84.08 as potential profit-taking zones. Swing traders, on the other hand, may look for buying opportunities on pullbacks, targeting the longer-term resistance levels at $85.11 and $85.59. Long-term investors may continue to hold their positions, as the overall trend remains bullish.
Correlations and Market Sentiment Driving XAGUSD
The recent rally in XAGUSD has been fueled by a combination of factors, including a weaker dollar and increased demand for safe-haven assets. The DXY (Dollar Index) is currently at 97.44, down slightly on the day. A weaker dollar makes silver cheaper for international buyers, increasing demand and pushing prices higher. The SP500 is currently at 6877.7, showing an upward trend. Since XAGUSD is positively correlated to the SP500, the rise in the SP500 also contributes to the rise in XAGUSD.
Geopolitical risks are also playing a role in the rally. With tensions remaining high in various parts of the world, investors are seeking safe-haven assets like silver. This increased demand is further supporting prices. According to Reuters, "geopolitical risks are expected to remain elevated in the coming months, which could continue to support safe-haven demand for silver."
The economic calendar is relatively light this week, with no major high-impact events scheduled. This could allow the technical factors to take center stage. However, traders should remain vigilant and be prepared for any unexpected news that could impact market sentiment.
Trade Plan: Riding the XAGUSD Momentum
XAGUSD breaks above $84.83 resistance, confirming the bullish trend. Targets are $85.11 and $85.59. A sustained break above $85.59 could open the door for a move towards $90.
XAGUSD fails to hold $84.08 support, signaling a potential reversal. Targets are $83.6 and $83.32. A sustained break below $83.32 could lead to a deeper pullback towards $80.67.
Frequently Asked Questions: XAGUSD Analysis
Is XAGUSD a good buy right now?
XAGUSD is exhibiting overbought conditions on shorter timeframes, as indicated by an RSI of 88.62 on the 1H chart, suggesting caution. However, the overall trend remains bullish, so a pullback to the $84.08 support level could offer a buying opportunity for swing traders.
What is the XAGUSD price forecast for this week?
The XAGUSD price forecast for this week is bullish, with potential targets at $85.11 and $85.59 if the $84.83 resistance is broken. Given the overbought conditions, a 60% probability is assigned to the bullish scenario, while a 40% probability is assigned to a potential pullback.
What are the key support and resistance levels for XAGUSD?
Key support levels for XAGUSD are at $84.08, $83.6, and $83.32, as indicated on the 1H chart. Key resistance levels are at $84.83, $85.11, and $85.59. These levels should be closely monitored for potential breakouts or reversals.
Why is XAGUSD moving today?
XAGUSD is moving higher today due to a combination of factors, including a weaker dollar (DXY at 97.44) and increased demand for safe-haven assets. Geopolitical tensions and a light economic calendar are also contributing to the rally.
XAGUSD's surge to $86.66 presents both opportunities and risks. While the bullish momentum is strong, overbought conditions suggest caution. Manage your risk, wait for your setup - the market always gives a second chance.
Track markets in real-time
AI-powered analysis, technical indicators and real-time price data.
Join Our Telegram Channel
Breaking market news, AI analysis and trading signals instantly.
Join Channel