
XAGUSD Tests $72.86: Silver Navigates Geopolitical Crosswinds and Shifting Macro Signals
Silver hovers around $72.86 as geopolitical tensions and mixed economic data create a complex trading environment. Explore key levels and market correlations.
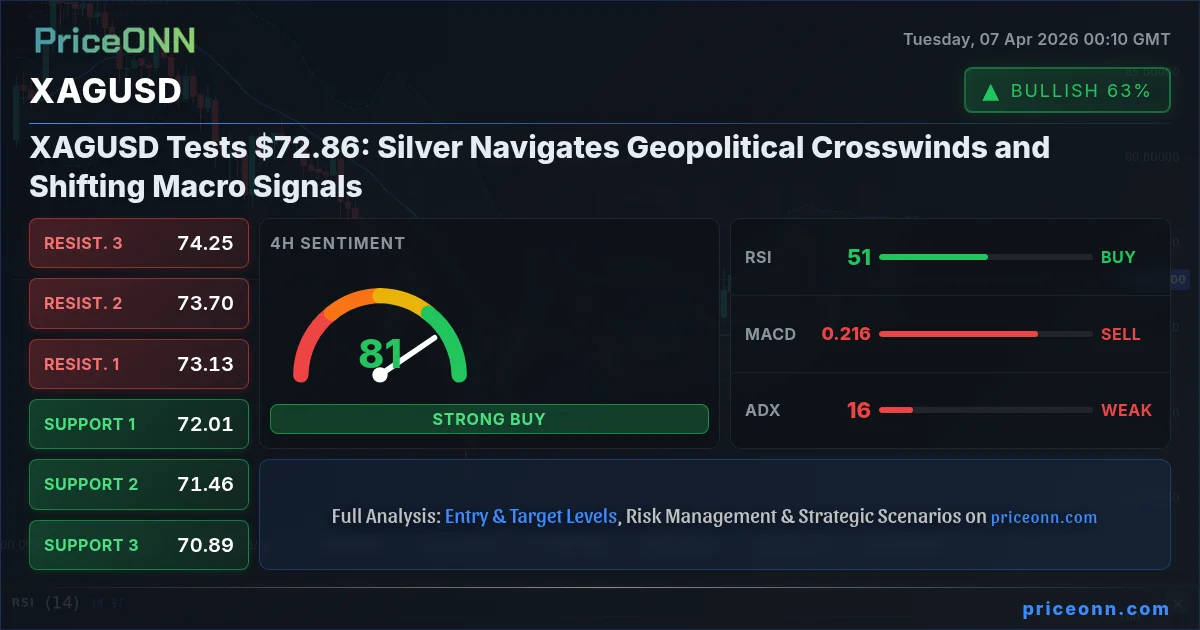
Silver, or XAGUSD, is currently trading at $72.86, a level that finds itself at a critical juncture amidst a swirling mix of geopolitical uncertainty and shifting macroeconomic currents. The precious metal has been navigating a tight range, showing resilience but also a lack of clear direction as traders weigh conflicting signals from global markets. This price point, $72.86, is not just a number; it represents a delicate balance between safe-haven demand, industrial appetite, and the broader financial market's risk sentiment. Understanding the interplay between these factors is crucial for deciphering silver's next move.
- Silver holds at $72.86, caught between geopolitical headwinds and industrial demand signals.
- RSI at 52.05 on the 1H chart indicates a neutral momentum, while 4H shows a slight upward bias.
- Key support is identified at $72.01, with resistance eyed at $73.13, according to current market data.
- The US Dollar Index (DXY) at 99.79 presents a potential headwind if it continues to climb.
- Geopolitical events, particularly concerning energy markets and central bank policies, will be critical catalysts.
The market's current disposition is one of cautious observation. Geopolitical developments, particularly those impacting energy prices and global stability, continue to cast a long shadow. The recent news of potential oil trades preceding geopolitical announcements adds a layer of complexity, suggesting that market participants are keenly anticipating and reacting to shifts in global affairs. For silver, these events can act as double-edged swords; while geopolitical stress often bolsters safe-haven demand, any de-escalation can quickly temper that enthusiasm. The current price of $72.86 reflects this indecision, as buyers and sellers grapple with an uncertain outlook.
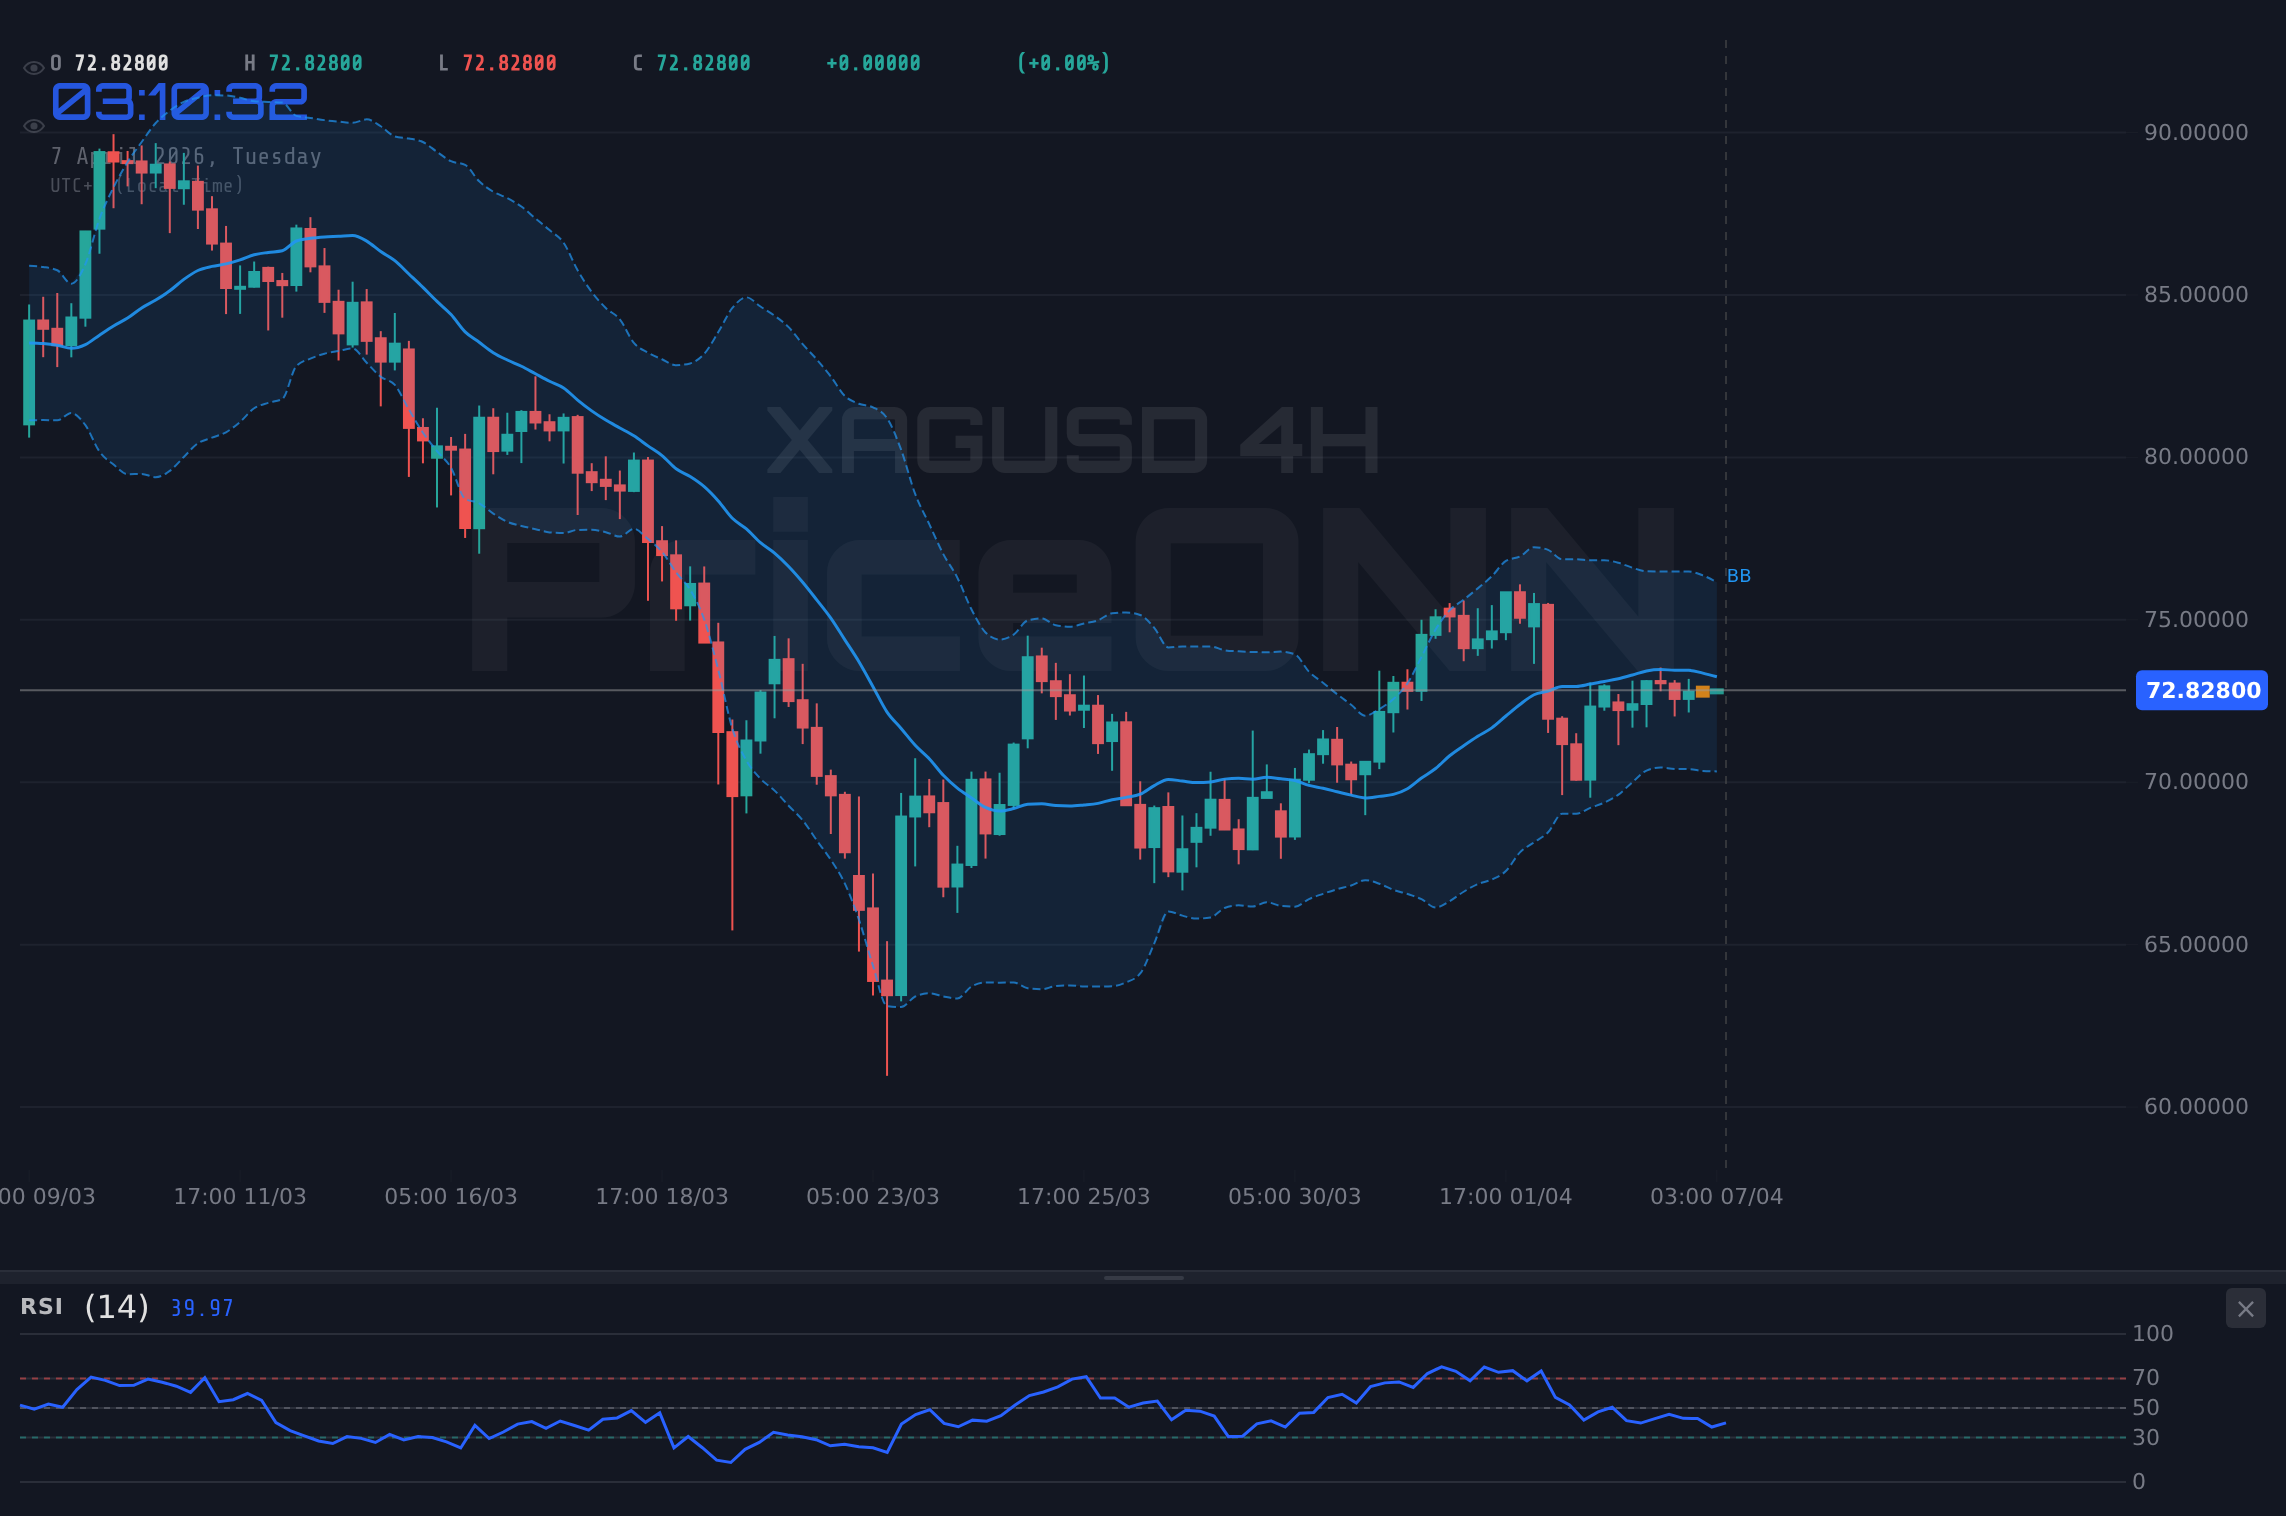
On the technical front, the 1-hour chart for XAGUSD presents a neutral trend with a 50% power reading, indicating a market in consolidation. The RSI(14) is hovering at 52.05, a reading that suggests neither strong buying nor selling pressure, but a slight upward inclination. This is corroborated by the MACD, which shows positive momentum with the MACD line above its signal line, and Stochastic indicators pointing towards a bullish signal with K at 64.36 and D at 57.33, moving out of oversold territory. However, the ADX at 17.24 signifies a weak trend, reinforcing the idea that the market is not yet committed to a strong directional move. The overall signal on this timeframe is 'BUY', but the weak trend suggests caution.
Navigating the Shorter Timeframes
Diving deeper into the 1-hour timeframe, the signals are mixed but lean towards a cautious optimism for silver. The RSI at 52.05 is sitting squarely in neutral territory, offering no strong conviction either way, though it shows a slight upward inclination. The MACD is exhibiting positive momentum, with the MACD line perched above its signal line, suggesting that recent price action has been constructive. More notably, the Stochastic Oscillator is flashing a bullish signal, with the %K line at 64.36 crossing above the %D line at 57.33, moving out of the oversold region. This suggests that buyers are beginning to step in. However, the ADX reading of 17.24 is a significant caveat; it indicates a very weak trending market, meaning that any upward momentum could easily fizzle out. This combination of factors - bullish oscillators but a weak trend - is typical of a market consolidating before a potential breakout or breakdown. The 'BUY' signal on this timeframe should be interpreted with a high degree of caution due to the lack of trend strength.
The 4-hour chart offers a slightly more constructive, though still nuanced, picture for silver. Here, the trend is identified as neutral with a 50% power, mirroring the indecisiveness seen on the shorter timeframe. However, the RSI(14) is at 51.48, showing a slight upward tendency, and the MACD continues to display positive momentum. The Stochastic Oscillator, with K at 72.63 and D at 54.66, strongly suggests a bullish signal, indicating a move out of consolidation and potentially into a more defined upward trajectory. Yet, the ADX at 15.57 remains low, again pointing to a lack of a strong trend. The overall signal here is 'NEUTRAL', reflecting the balance between the bullish oscillator readings and the weak trend. This suggests that while the short-term indicators are leaning positive, the broader market structure is not yet confirming a sustained rally.
The Daily Picture: A Tug-of-War
Shifting to the daily timeframe, the narrative for XAGUSD becomes more complex, highlighting the ongoing tug-of-war between different market forces. The trend is officially neutral with a 50% power, but the ADX at 31.84 is notably higher, indicating a moderately strong trend, albeit with a downward inclination based on the signal. The RSI(14) is at 44.9, firmly in neutral territory and showing a downward bias, suggesting that sellers have had a slight upper hand recently. The MACD, however, presents a conflicting signal: it's showing positive momentum with the MACD line above its signal line, which typically precedes a bullish move. Simultaneously, the Stochastic Oscillator is flashing a strong bullish signal, with %K at 82.52 and %D at 61.15, indicating an overbought condition but a clear upward momentum in the oscillator itself. The 'SELL' signal on this timeframe, driven by the RSI and ADX readings, contrasts with the bullish signals from MACD and Stochastic, underscoring the indecision in the market. This divergence is crucial; it suggests that while short-term oscillators might be pointing up, the daily trend and momentum indicators are not yet fully aligned for a sustained move higher.
The current price of $72.86 is finding immediate support around the $72.64 mark, with further levels at $72.35 and $72.06. These are the levels to watch for any immediate downside pressure. On the upside, resistance is forming at $73.22, followed by $73.52 and $73.81. A decisive break above these resistance levels, particularly $73.22, would be needed to signal a significant shift in momentum. The broader support levels on the daily chart are much lower, at $72.01, $71.46, and $70.89, indicating substantial room for a pullback if market sentiment turns sour. Conversely, the daily resistance at $76.01, $79.07, and $82.32 suggests that if a strong bullish trend were to materialize, there's significant upside potential, though current indicators do not yet support such a strong conviction.
Macroeconomic and Geopolitical Undercurrents
The performance of silver cannot be divorced from the broader macroeconomic and geopolitical landscape. The US Dollar Index (DXY), currently at 99.79 and showing a rising trend on multiple timeframes, acts as a significant counterforce. A stronger dollar typically makes dollar-denominated assets like silver more expensive for holders of other currencies, potentially dampening demand. The DXY's upward trajectory, especially its strong 1D trend, suggests that dollar strength might persist, posing a challenge for silver bulls. This correlation is a constant factor traders must monitor; a rising DXY often coincides with pressure on commodities.
Furthermore, the performance of major equity indices like the S&P 500 (currently at 6572.87, showing a strong upward move on the 1H and 4H but a bearish signal on the 1D) and the Nasdaq 100 (at 24121.12, mixed signals across timeframes) provides context for risk appetite. While recent intraday moves have been positive for equities, the longer-term signals remain mixed, suggesting that market participants are not fully committed to a risk-on environment. This ambiguity can lead to increased demand for safe-haven assets like silver, but only if broader risk aversion takes hold decisively. The current price action shows equities pushing higher, which could theoretically reduce safe-haven demand for silver, but the underlying uncertainty in the daily charts hints that this rally might be fragile.
Oil prices, represented by Brent crude at $112.96 and WTI at $113.70, are showing strong upward momentum. This is a key indicator of inflationary pressures and geopolitical risk. Higher oil prices can translate into broader inflation concerns, which historically supports gold and silver as inflation hedges. However, they can also signal economic stress or supply disruptions, which might dampen industrial demand for silver. The strong upward trend in oil prices, particularly the very strong ADX on the daily timeframe for both Brent and WTI, suggests that energy markets are signaling persistent inflationary pressures and potential supply-side risks. This factor alone provides a fundamental underpinning for precious metals, even if other indicators are mixed.
Central Bank Policies and Interest Rate Expectations
The ongoing narrative surrounding central bank policies, particularly from the Federal Reserve, remains a critical driver for all asset classes, including silver. While specific economic calendar data for the immediate future was not provided with actual outcomes, the general expectation of monetary policy stances heavily influences market sentiment. If central banks signal a hawkish stance - leaning towards higher interest rates or a slower pace of rate cuts - this typically strengthens the US dollar and increases the opportunity cost of holding non-yielding assets like silver, thereby putting downward pressure on its price. Conversely, any hint of a dovish pivot or concerns about economic slowdown could lead to expectations of rate cuts, weakening the dollar and providing a tailwind for silver. The current market pricing for Fed Funds futures, though not explicitly provided here, is always a key indicator to monitor for shifts in policy expectations. The current DXY strength at 99.79 suggests that the market might still be pricing in a relatively firm monetary policy stance from the Fed, which acts as a headwind for silver.
Industrial Demand vs. Investment Demand
Silver's unique dual role as both a monetary asset and an industrial commodity means its price is influenced by factors affecting both investment and industrial sectors. While investment demand often responds to macroeconomic factors, inflation expectations, and geopolitical risks, industrial demand is tied to global manufacturing output and specific technological applications. Reports on copper projects and industrial demand percentages, such as those referencing Vizsla Copper's expansion and Highland Copper's domestic supply initiatives, hint at underlying strength in the industrial commodities space. This is positive for silver, as it shares many industrial uses with copper, particularly in electronics and renewable energy technologies. However, the current economic outlook and the mixed signals from equity markets suggest that industrial activity might be facing headwinds, creating a potential conflict between the two demand drivers. The strength in oil prices could imply robust industrial activity or simply supply constraints; discerning between these is key. If industrial demand is indeed picking up, it provides a solid floor for silver prices around the $72.01 support level and above.
Market Sentiment and Risk Appetite
The prevailing market sentiment - whether it's 'risk-on' or 'risk-off' - plays a pivotal role in silver's price action. During periods of heightened risk aversion, investors tend to flock to perceived safe-haven assets, which can include silver, gold, and US Treasuries. Conversely, in a risk-on environment, speculative capital often flows into riskier assets like equities and cryptocurrencies, potentially drawing capital away from precious metals. The mixed signals from the S&P 500 and Nasdaq 100, despite some intraday gains, suggest that underlying risk appetite is not yet firmly established. The fact that Bitcoin, often seen as a risk-on asset, is holding above $60,000 amidst geopolitical shocks could indicate a complex interplay where some risk assets are surprisingly resilient, or that capital is flowing into multiple asset classes simultaneously. For silver, a clear shift towards sustained risk-off sentiment would likely provide a significant boost, pushing prices towards the $73.13 resistance and beyond. The ADX readings across multiple timeframes for silver, mostly below 30, reinforce the idea of a market that is not yet trending strongly, making it susceptible to sentiment shifts.
Scenario Analysis for XAGUSD
Bearish Scenario: Consolidation Failure
65% ProbabilityNeutral Scenario: Range-Bound Trading
25% ProbabilityBullish Scenario: Breakout Potential
10% ProbabilityThe current technical indicators across multiple timeframes present a mixed picture, preventing a clear directional bias. The 1H chart shows bullish oscillators (Stochastic K=64.36, D=57.33) but a weak trend (ADX=17.24). The 4H chart also leans bullish on oscillators (Stochastic K=72.63, D=54.66) but maintains a weak trend (ADX=15.57). The daily chart, however, presents a more challenging scenario with an RSI at 44.9 and a strong trend reading from ADX at 31.84, although MACD and Stochastic offer some bullish divergence. This conflicting data suggests that while short-term buying pressure might emerge, the longer-term trend is not yet confirmed bullish, making the $72.01 support level critical for any potential downside risk. The DXY at 99.79 and rising oil prices add further layers to this complex analysis.
Given the conflicting signals across timeframes and the weak trend readings on shorter timeframes (ADX
Focus on Key Levels and Macro Drivers
The immediate focus for XAGUSD traders will be on the $72.01 support level. A failure to hold this level could trigger a cascade of selling, targeting the $71.46 and $70.89 areas. This would likely be exacerbated by a continued rise in the DXY, which is currently at 99.79 and showing a strong daily trend. On the flip side, a sustained push above $73.22, and more importantly, above $73.81, would be necessary to invalidate the near-term bearish bias and open the door for a move towards the $76.01 daily resistance. The strength of the trend indicated by the ADX on the daily chart (31.84) suggests that if a directional move does materialize, it could be significant.
The role of industrial demand cannot be overstated. Reports highlighting expansions in copper projects and the general percentage of industrial demand for silver versus gold (keywords like 'industrial demand silver vs gold percentage' are gaining traction) point to underlying structural support. If global manufacturing activity remains robust or shows signs of recovery, this could provide a solid floor for silver prices, even in the face of dollar strength or rising interest rate expectations. However, the current uncertainty in equity markets and the mixed economic signals mean that industrial demand could also falter, adding another layer of complexity to the outlook.
Looking ahead, upcoming economic data releases will be crucial. While specific outcomes were not detailed, any data that influences interest rate expectations - such as inflation reports or employment figures - will directly impact the DXY and, consequently, silver. A stronger-than-expected US dollar, driven by hawkish Fed rhetoric or robust economic data, would likely pressure silver downwards. Conversely, signs of economic weakening or a more dovish tone from central banks could support silver's safe-haven appeal. The current price of $72.86 is a battleground where these macro forces clash with technical levels. The low ADX on the 1H and 4H charts suggests that the market is waiting for a catalyst, and the next significant economic release or geopolitical development could be that spark.
Frequently Asked Questions: XAGUSD Analysis
What happens if XAGUSD breaks below the $72.01 support level?
A break below the $72.01 support level, a key area on the daily chart, would likely trigger further selling pressure. This could lead to a test of the $71.46 and subsequently the $70.89 levels. Such a move would be invalidated if price decisively closes back above $73.81 resistance.
Should I buy XAGUSD at current levels around $72.86 given the mixed technical signals?
Buying at $72.86 requires caution due to mixed technical signals and weak trend strength on shorter timeframes. A more prudent approach might be to wait for confirmation, such as a break above $73.22 resistance with increased volume, or a clear bounce from the $72.01 support level, to define a higher probability trade setup.
Is the RSI at 52.05 a sell signal for XAGUSD right now?
An RSI of 52.05 is not typically considered a sell signal; it sits in neutral territory with a slight upward inclination. While it doesn't signal strong buying pressure, it also doesn't indicate immediate overbought conditions that would warrant a sell. The overall trend context and other indicators are needed for a complete picture.
How will the upcoming economic data releases affect XAGUSD this week, given the DXY at 99.79?
Upcoming data releases that influence Fed policy expectations will be critical. If data suggests a stronger US economy or persistent inflation, it could push the DXY higher from 99.79, potentially pressuring XAGUSD. Conversely, weaker data could lead to dollar weakness and support silver prices.
The path forward for silver hinges on its ability to navigate the confluence of these technical levels and macro drivers. While short-term oscillators show some promise, the lack of a strong trend and the headwinds from a potentially strengthening dollar present significant challenges. Patience and disciplined risk management will be paramount for traders looking to capitalize on silver's next significant move. The market is at a crossroads, and the $72.86 level is a key pivot point that could dictate the near-term trajectory.
| Indicator | Value | Signal | Interpretation |
|---|---|---|---|
| RSI (14) | 52.05 | Neutral | Slight upward tendency, not yet overbought/oversold. |
| MACD | Positive Momentum | Bullish Signal | MACD line above signal line. |
| Stochastic | K: 64.36, D: 57.33 | Bullish | Moving out of oversold, %K > %D. |
| ADX | 17.24 | Weak Trend | Market lacks strong directional conviction on 1H. |
| Bollinger | Mid Band | Watch | Price is above mid band, indicating some upward bias. |
Track markets in real-time
AI-powered analysis, technical indicators and real-time price data.
Join Our Telegram Channel
Breaking market news, AI analysis and trading signals instantly.
Join Channel