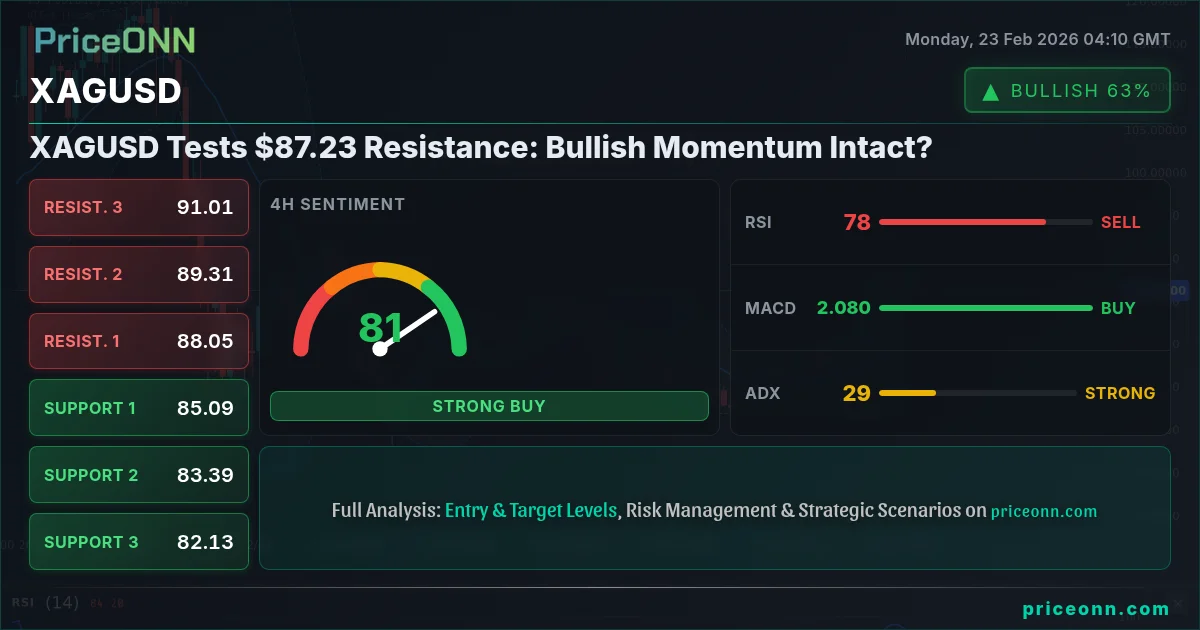
XAGUSD is currently trading at $87.23, a level that could determine its short-term trajectory. The precious metal is exhibiting strong bullish momentum, but with several indicators flashing overbought signals, a potential pullback or consolidation phase could be in the cards. Understanding the interplay between these technical signals and broader market dynamics is crucial for traders looking to capitalize on XAGUSD's next move.
- RSI at 80.69 on the 1H chart indicates overbought conditions, suggesting a possible pullback.
- Key resistance level at $88.00, a break above which could trigger further upside.
- ADX at 44.78 on the 1H chart confirms a strong uptrend, supporting bullish continuation.
- DXY weakness is providing tailwinds for XAGUSD, but a reversal could quickly change the picture.
Decoding XAGUSD's Bullish Surge
The hourly chart paints a compelling picture of XAGUSD's recent surge. The Relative Strength Index (RSI) currently sits at 80.69, firmly in overbought territory. This suggests that the buying pressure may be unsustainable in the short term, and a period of consolidation or a minor pullback could be expected. However, the Average Directional Index (ADX) is also a key indicator to watch. With a reading of 44.78, the ADX confirms a strong uptrend, suggesting that the bullish momentum is still firmly in place. Traders should be wary of relying solely on the RSI for a sell signal, as the underlying trend remains robust.
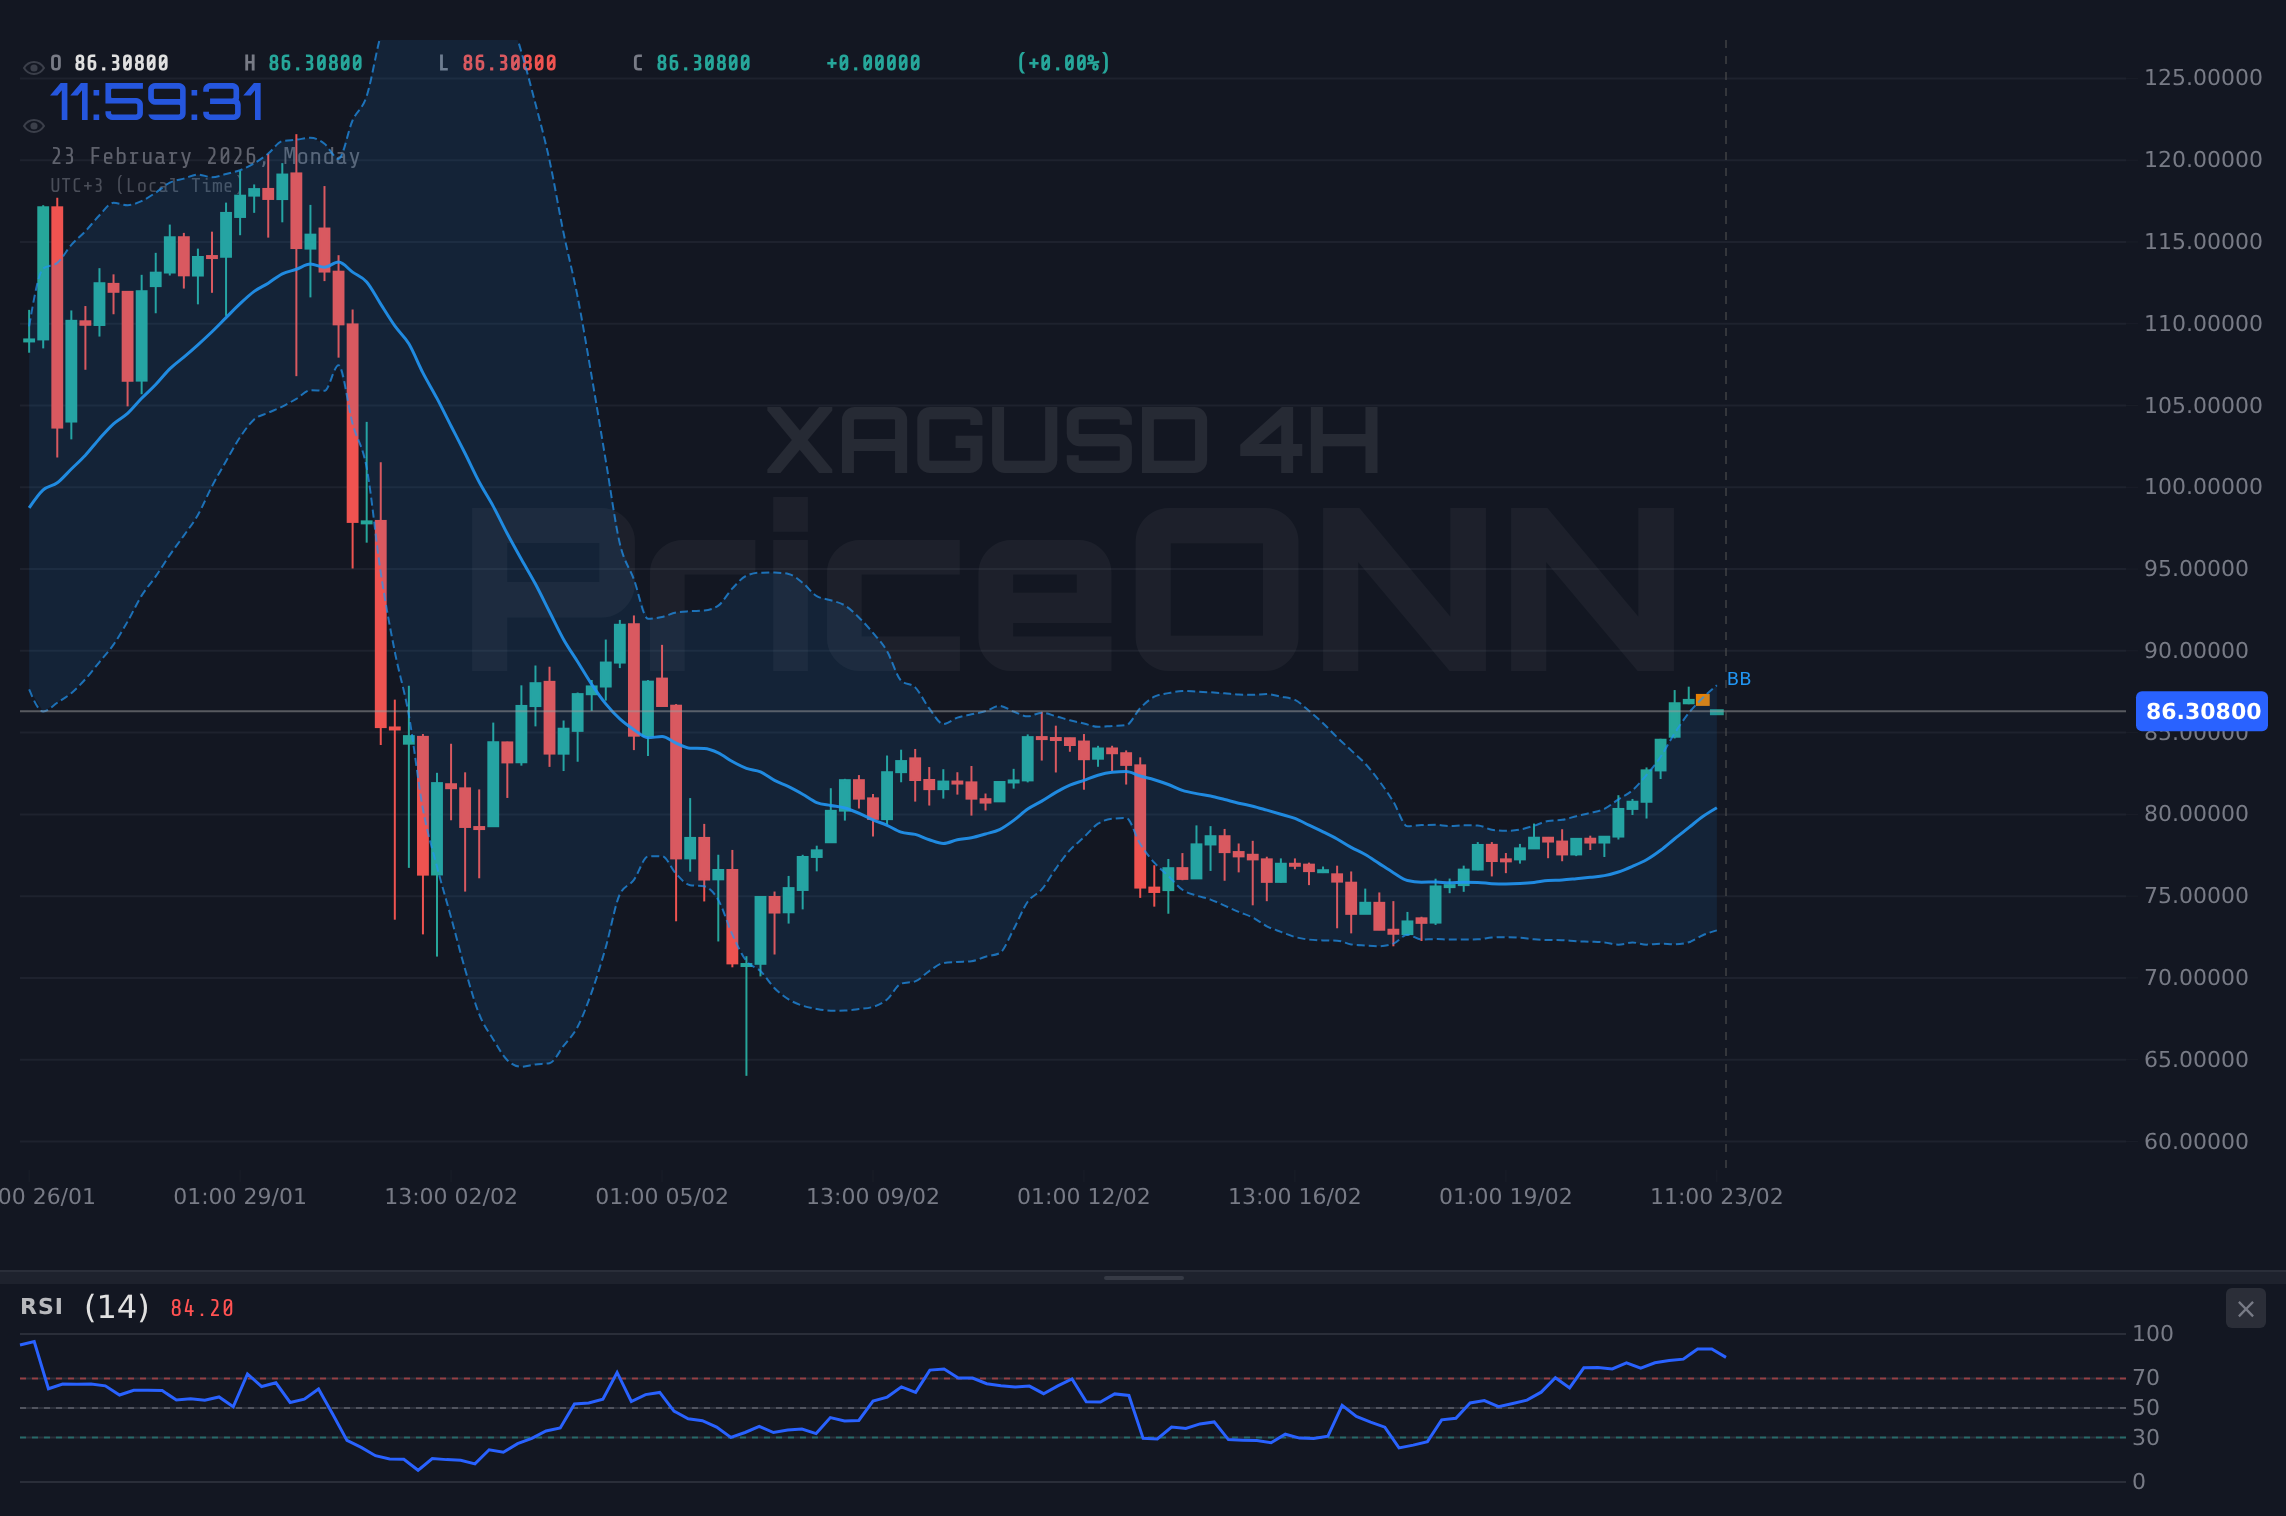
Looking at the four-hour timeframe, the RSI is also elevated at 78.33, reinforcing the overbought conditions. However, much like the hourly chart, the ADX remains strong at 26.97, signaling that the underlying uptrend is still intact. Furthermore, the Stochastic oscillator is deep in overbought territory with %K at 97.52 and %D at 85.26. This confluence of overbought indicators suggests that a period of consolidation or a minor pullback is increasingly likely, but the broader trend remains bullish.
On the daily chart, the picture is slightly different. The RSI is at a more moderate 53.55, suggesting that there is still room for further upside before the market becomes overextended. The ADX is also strong at 29.06, confirming the overall bullish trend. The Stochastic oscillator, with %K at 76.76 and %D at 53.54, also supports the bullish outlook. This divergence between the short-term overbought signals and the longer-term bullish trend highlights the importance of multi-timeframe analysis.
Key Price Levels to Watch
Identifying key support and resistance levels is crucial for navigating XAGUSD's potential volatility. On the hourly chart, immediate support can be found at $86.93, followed by $86.30 and $85.86. These levels represent potential areas where buyers may step in to defend the uptrend. On the resistance side, the immediate target is $88.00, followed by $88.44 and $89.07. A decisive break above $88.00 could trigger a fresh wave of buying, potentially leading to a test of the higher resistance levels.
On the four-hour chart, stronger support levels are located at $82.94, $81.32 and $80.48. These levels represent more significant areas of demand that could provide a floor in case of a deeper pullback. Resistance levels on this timeframe are situated at $85.40, $86.24 and $87.86. These levels are crucial to monitor as they could act as barriers to further upside.
The daily chart reveals even more significant levels. Key support can be found at $79.76, $74.97 and $72.54. These levels represent long-term areas of demand that could provide substantial support in case of a major correction. On the resistance side, the key levels are $86.99, $89.42 and $94.22. Breaching these levels could signal a significant shift in the long-term trend.
Trade Plan: Riding the Silver Wave
Given the current technical picture, a carefully considered trade plan can help capitalize on XAGUSD's bullish momentum while managing risk effectively. The strong uptrend, as confirmed by the ADX, suggests that buying opportunities may arise. However, the overbought conditions, as indicated by the RSI and Stochastic oscillator, warrant caution.
- Entry: Break above $88.00
- Target 1: $88.44
- Target 2: $89.07
- Stop/Invalidation: $86.93
- Condition: Failure to break $88.00 and subsequent break below $86.93.
- Target 1: $86.30
- Target 2: $85.86
Economic Calendar and Market Sentiment
The economic calendar is relatively light today, but several USD data releases later this week could have a significant impact on XAGUSD. Any surprises in these releases could trigger volatility in both the dollar and precious metals. Keep an eye on these events and adjust your trading strategy accordingly.
Market sentiment is currently leaning bullish, but caution is warranted. The strong uptrend is supported by the ADX, but the overbought conditions suggest that a pullback is possible. Monitor the DXY closely, as any strength in the dollar could weigh on XAGUSD. Furthermore, keep an eye on broader market risk sentiment, as risk aversion could trigger safe-haven flows into the dollar and out of precious metals.
Multi-Timeframe Analysis: A Holistic View
As we've seen, the technical picture for XAGUSD is complex, with different timeframes painting slightly different pictures. The short-term charts suggest overbought conditions and the potential for a pullback, while the longer-term charts confirm a strong uptrend. This highlights the importance of multi-timeframe analysis. Traders should consider both the short-term and long-term trends when making trading decisions.
Scalpers may look for short-term opportunities to fade the overbought conditions, while swing traders may look for pullbacks to enter long positions. Long-term investors may view any pullbacks as buying opportunities, given the overall bullish trend. Understanding your trading style and time horizon is crucial for interpreting the technical signals and making informed trading decisions.
| Indicator | Value | Signal | Interpretation |
|---|---|---|---|
| RSI (1H) | 80.69 | Overbought | Potential for pullback |
| MACD (1H) | Positive | Bullish | Uptrend continuation |
| Stochastic (1H) | 90.88/93.52 | Overbought | Potential for pullback |
| ADX (1H) | 44.78 | Strong | Strong uptrend |
| RSI (1D) | 53.55 | Neutral | Room for upside |
Frequently Asked Questions: XAGUSD Analysis
Is XAGUSD a good buy right now?
XAGUSD shows bullish momentum, but the RSI at 80.69 indicates overbought conditions. A break above $88.00 could signal a good buying opportunity, but wait for confirmation to avoid a potential pullback.
What is the XAGUSD price forecast for this week?
The XAGUSD price forecast for this week is cautiously bullish. Expect a test of $88.44 resistance, with a potential move towards $89.07 if momentum sustains. A 60% probability is assigned to this scenario given the ADX support.
What are the key support and resistance levels for XAGUSD?
Key support levels for XAGUSD are at $86.93, $86.30, and $85.86. Resistance levels to watch are $88.00, $88.44, and $89.07, derived from the 1H chart data.
Why is XAGUSD moving today?
XAGUSD is moving higher today due to a combination of DXY weakness and strong technical momentum. The ADX confirms a robust uptrend, while risk appetite in broader markets supports precious metals.
Track markets in real-time
AI-powered analysis, technical indicators and real-time price data.
Join Our Telegram Channel
Breaking market news, AI analysis and trading signals instantly.
Join Channel