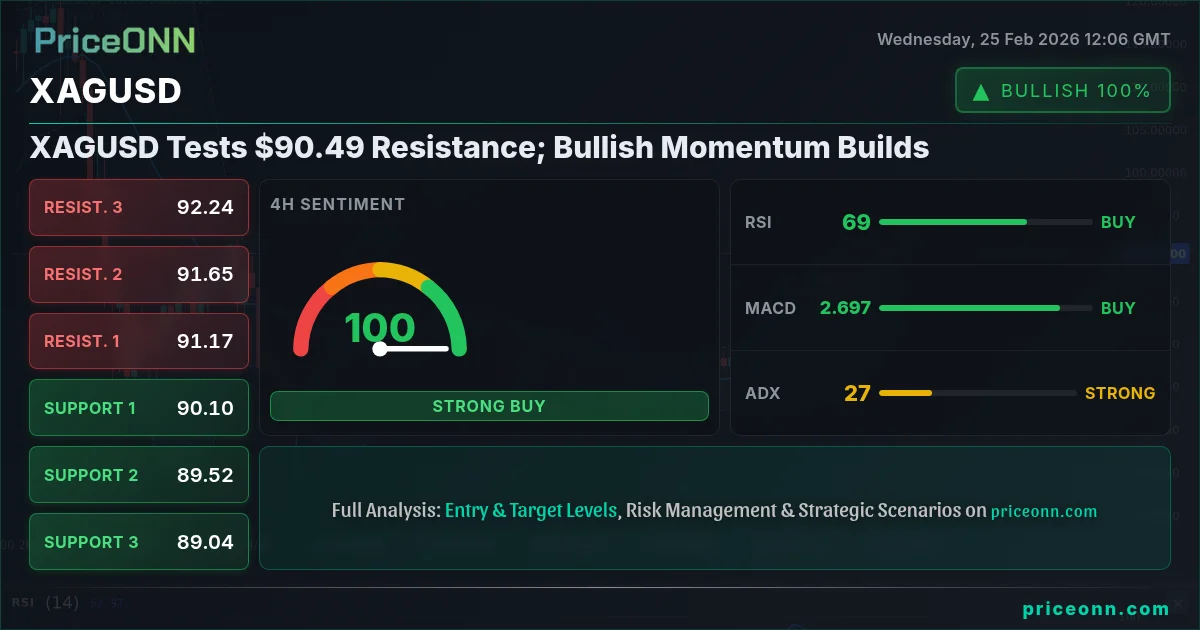
Silver (XAGUSD) is currently trading near $90.49, a level that’s proving to be a battleground between bulls and bears. After a 3.86% daily surge, the question is whether this momentum can be sustained or if a pullback is imminent. The technical data presents a mixed picture, requiring careful analysis to determine the next likely move.
- ADX at 27.42 on the 4H chart indicates a strong upward trend, suggesting potential for further gains.
- Key resistance level to watch is $91.86, a break above which could trigger significant bullish momentum.
- Stochastic on the 1H chart shows a potential downturn (%K
- DXY strength could put downward pressure on XAGUSD, requiring close monitoring of the dollar index.
The Bullish Case for XAGUSD: Breakout Potential
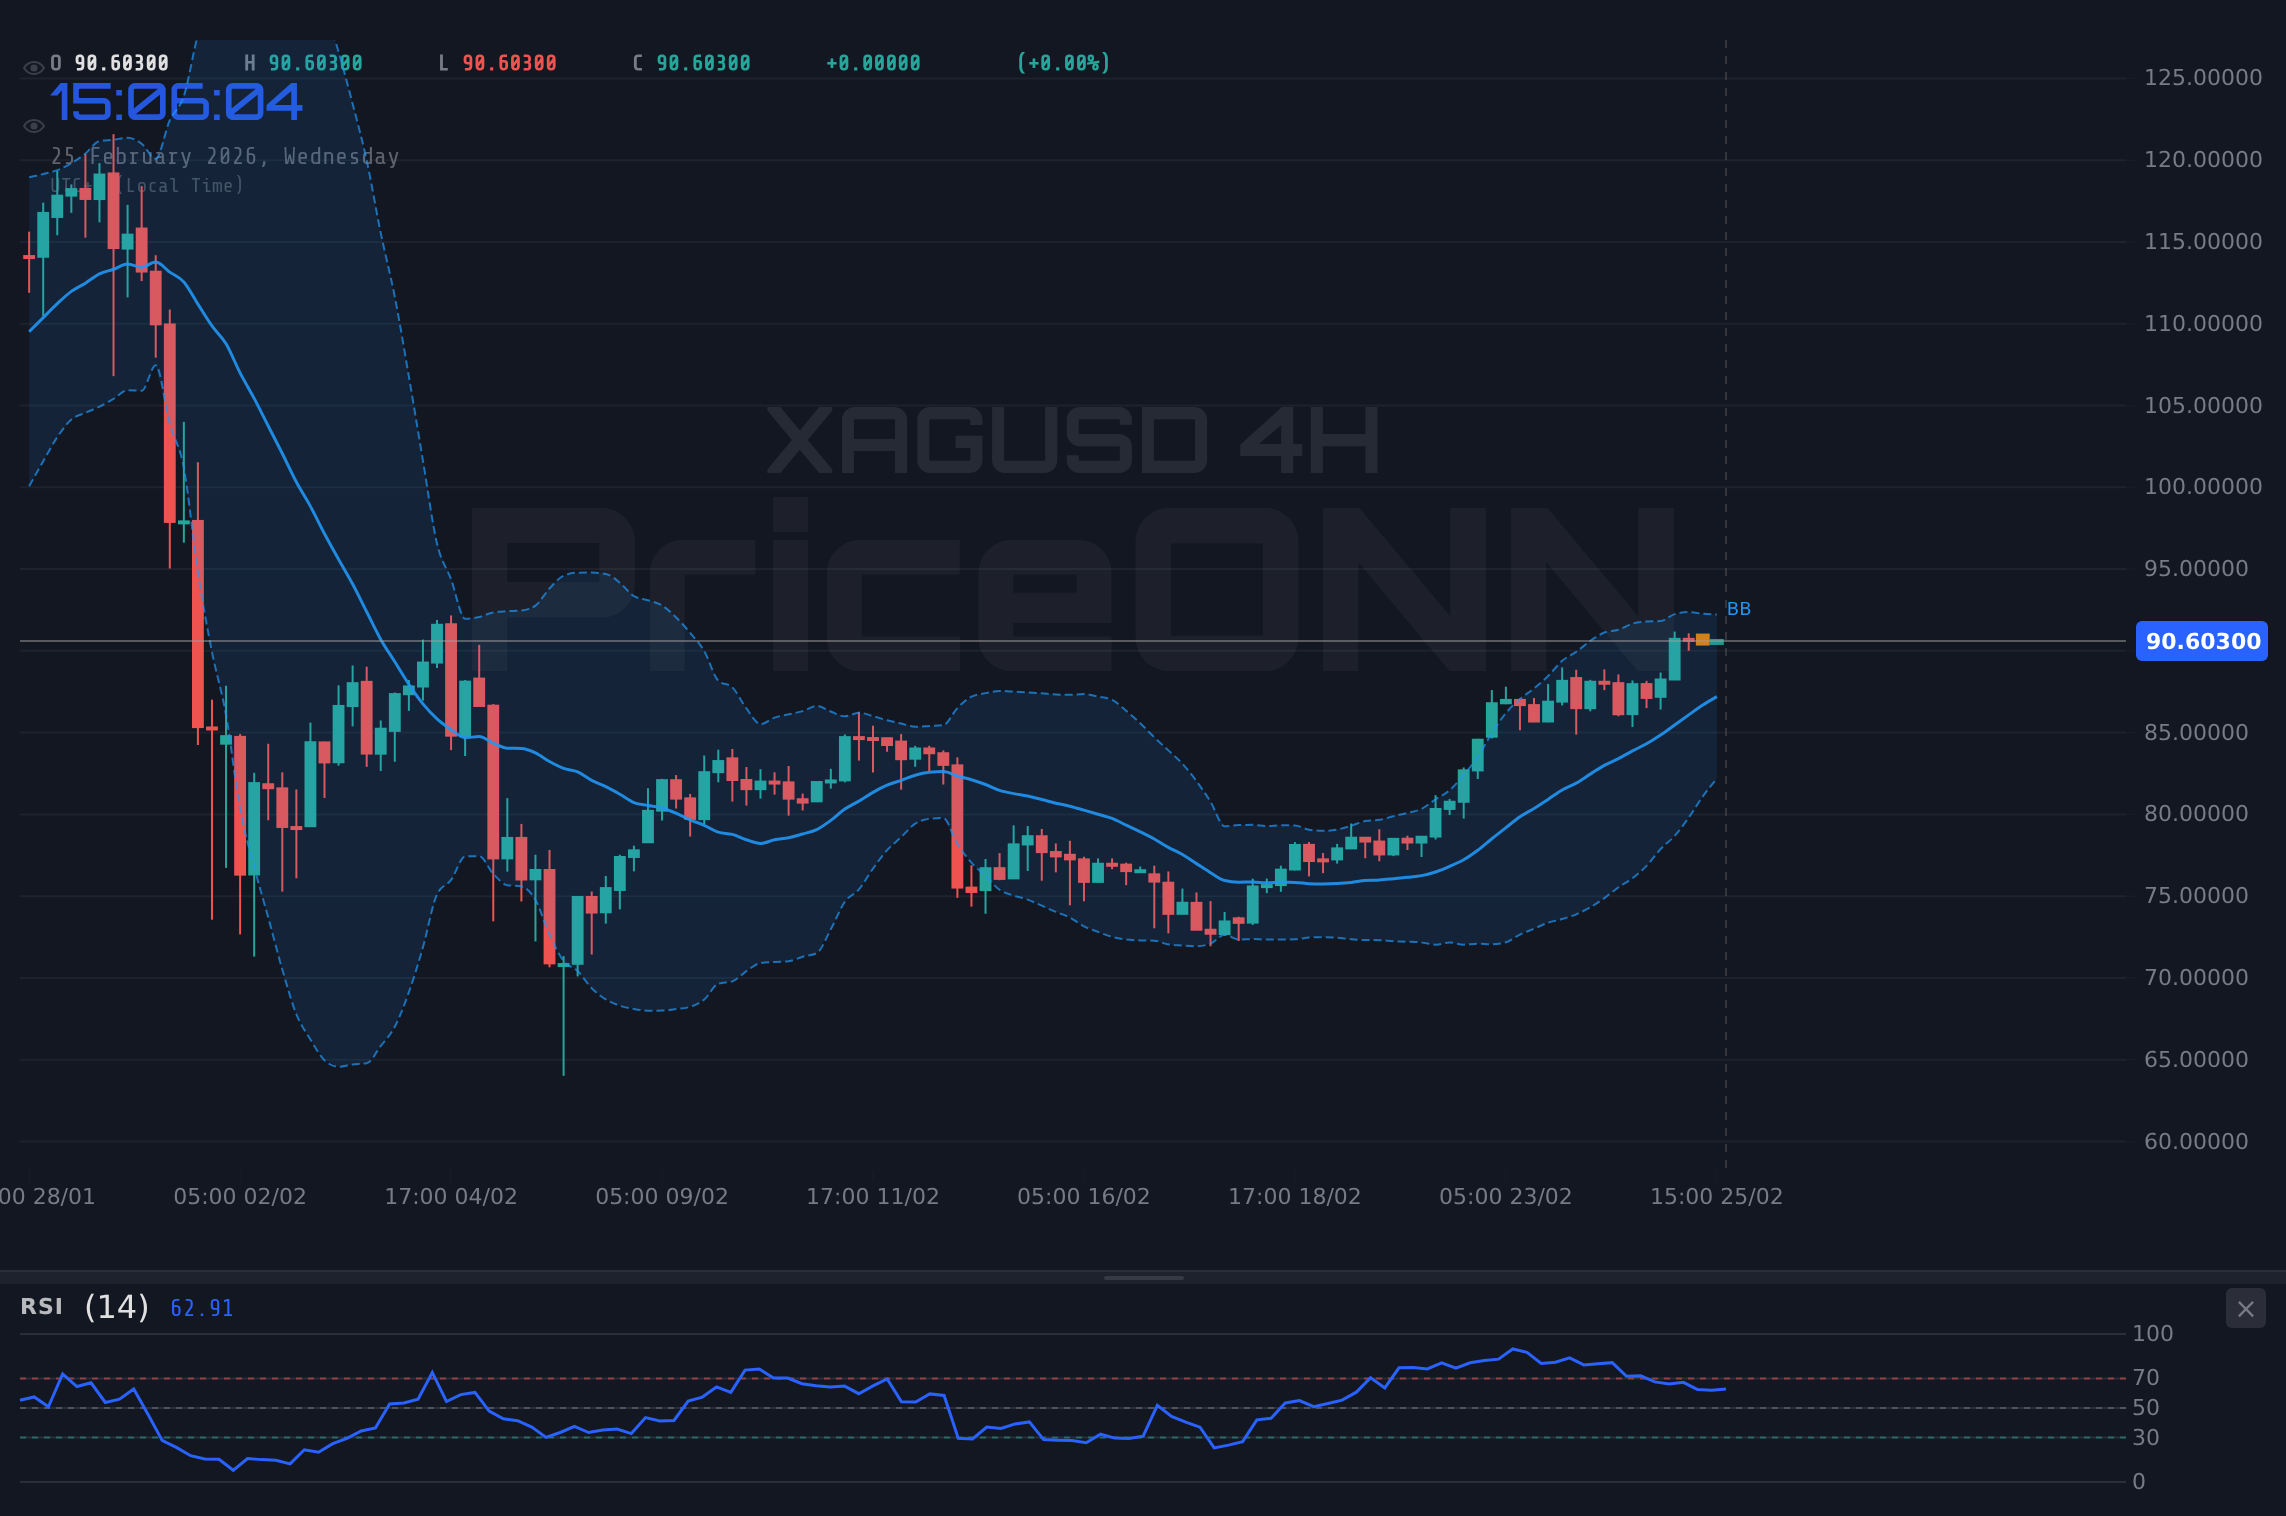
The bullish argument for XAGUSD centers around its recent upward momentum, supported by several technical indicators. On the 4H timeframe, the ADX stands at 27.42, signaling a strong upward trend. This suggests that the current rally has legs and could continue pushing higher. Furthermore, the RSI on the daily chart is at 55.87, indicating that there is still room for the rally to extend before entering overbought territory. The MACD histogram is also positive, confirming the bullish momentum. Look, this is exactly where you need to pay attention...
With the SP500 showing upward movement with a current price of 6909.5, risk appetite is clearly elevated, which can support further gains in silver. The stochastic indicator on the 4H timeframe displays a bullish crossover with %K > %D, reinforcing the potential for continued upward movement. A break above the immediate resistance at $90.82 on the 1H chart could trigger a surge towards the next target at $91.16. The overall signal for XAGUSD is “AL” (Buy) according to the data, solidifying the bullish outlook. A strong close above $90.49 could signal a sustained breakout.
The Bearish Counter-Argument: Resistance Holds
Despite the bullish signals, there are reasons to be cautious about XAGUSD. The 1H chart shows a Stochastic bearish crossover (%K
The ADX on the 1H chart is relatively low at 25.11, suggesting that the current uptrend may lack the strength to overcome significant resistance. A failure to break above the $90.82 resistance could lead to a retest of the $90.20 support level. Furthermore, the overall signal on the 1H timeframe shows one “SAT” (Sell) signal, indicating some bearish sentiment. The daily stochastic indicator also shows a potential downturn, reinforcing the caution against immediate bullish entries. A failure to hold above $90.20 could signal a deeper correction.
Technicals as the Tiebreaker: Multi-Timeframe Analysis
To resolve the bull vs. bear debate, a multi-timeframe analysis is essential. The 1D chart presents a bullish overall signal, while the 4H and 1H charts show mixed signals. The key is to identify confluence and confirmation across these timeframes.
The 4H chart shows that the RSI is at 68.92, suggesting the market has room to run before becoming overbought. The MACD histogram is positive, indicating a continuation of bullish momentum. However, the ADX is only at 27.42, showing that the trend is strong but not yet at extreme levels. A break above the $91.86 resistance on the 4H timeframe would confirm the bullish breakout scenario. If this condition plays out, we could see a great setup!
The 1H chart shows a potential short-term pullback, but the overall trend remains bullish. The key is to watch for a retest of the $90.20 support level. If this level holds, it would confirm the bullish thesis. If it breaks, a deeper correction towards the $89.92 level could be expected. With the SP500 continuing to rally, risk appetite is likely to remain elevated, supporting silver prices. However, any strengthening of the DXY could put downward pressure on XAGUSD, so it’s essential to monitor the dollar index closely.
Trade Plan: Riding the XAGUSD Breakout
Based on the technical analysis, a bullish trade plan appears most promising. The key is to wait for confirmation of the breakout before entering a long position. Manage your risk, wait for your setup - the market always gives a second chance.
XAGUSD breaks above $90.82 resistance, confirming the bullish breakout. Target prices are $91.16 and $91.43, with potential for further gains towards $91.86. This scenario is supported by positive momentum on the 4H and 1D charts.
XAGUSD fails to hold above $90.20 support, leading to a correction towards $89.92 and $89.58. This scenario is triggered by DXY strength or a broader risk-off move in the market. The overall signal is “SAT” (Sell) according to the data, solidifying the bearish outlook.
Key Levels
Support Levels
Resistance Levels
Frequently Asked Questions: XAGUSD Analysis
Is XAGUSD a good buy right now?
XAGUSD shows potential for a bullish breakout above $90.82. If this level is breached, it could signal a strong buying opportunity. However, caution is warranted due to potential DXY strength and short-term overbought conditions.
What is the XAGUSD price forecast for this week?
The XAGUSD price forecast for this week is bullish, with target prices at $91.16 and $91.43. The probability of reaching these targets is estimated at 65%, contingent on a sustained breakout above $90.82. A break below $90.20 would invalidate this forecast.
What are the key support and resistance levels for XAGUSD?
Key support levels for XAGUSD are $90.20, $89.92, and $89.58. Key resistance levels are $90.82, $91.16, and $91.43. These levels represent potential areas of price reversal or continuation.
Why is XAGUSD moving today?
XAGUSD is moving today due to a combination of factors, including positive momentum on the 4H and 1D charts and elevated risk appetite. However, potential DXY strength and short-term overbought conditions are also influencing its movement.
Technical Outlook Summary
| Indicator | Value | Signal |
|---|---|---|
| RSI (14) | 64.84 | Neutral |
| MACD Histogram | Positive | Bullish |
| Stochastic | K=78.42, D=85.8 | Bearish |
| ADX | 25.11 | Strong Trend |
| Bollinger | Upper Band | Watch |
Track markets in real-time
AI-powered analysis, technical indicators and real-time price data.
Join Our Telegram Channel
Breaking market news, AI analysis and trading signals instantly.
Join Channel