XAGUSD Weekly Outlook: Silver Slides to $67.90 Amid Strong Dollar and Risk-Off Sentiment
Silver (XAGUSD) faces intense selling pressure, dropping to $67.90 as the DXY strengthens and risk appetite wanes. Key support levels are being tested.
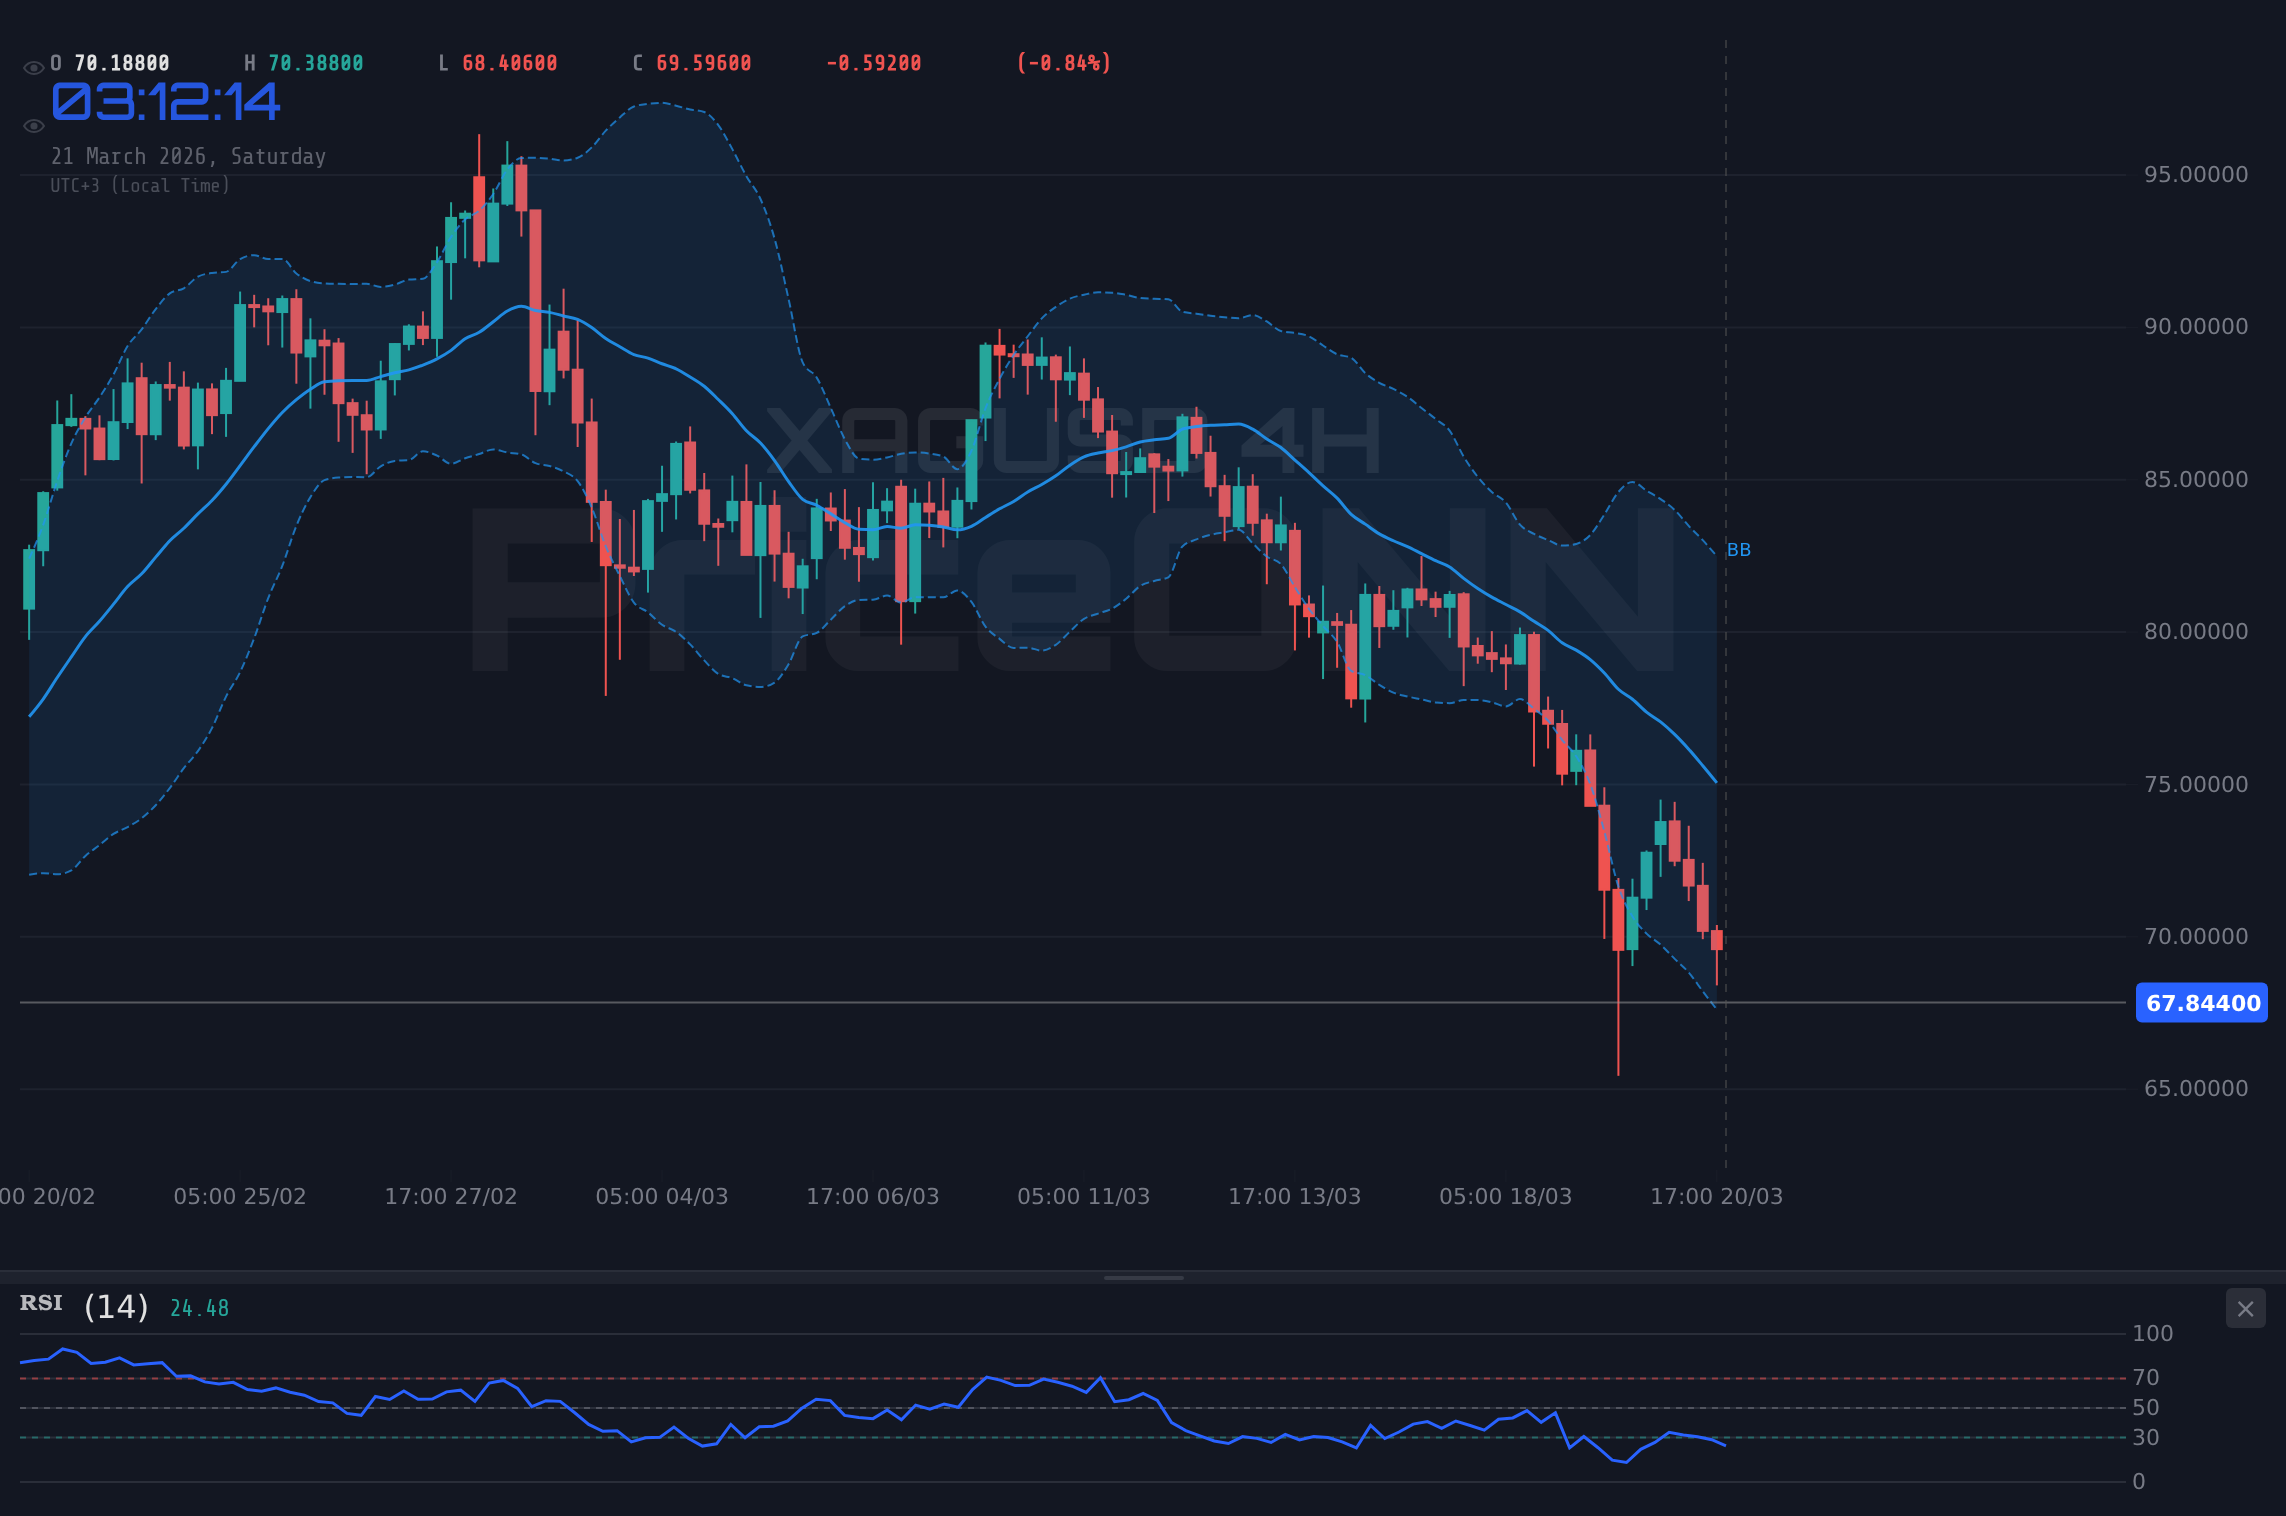
The relentless slide in silver prices continues, with XAGUSD now firmly trading around the critical $67.90 mark. This sharp downturn, especially noticeable in the last 48 hours according to recent market reports, paints a grim picture for the precious metal. It's not just a minor pullback; we're seeing a significant bearish momentum building across multiple timeframes, driven by a confluence of factors including a strengthening US Dollar and a palpable decrease in global risk appetite. As traders scramble to reassess their positions, the question on everyone's mind is whether this downward trajectory has room to run further, and more importantly, what levels will ultimately dictate the metal's next move. This week's action has been particularly brutal, with significant price drops that have cleared key technical levels, leaving many wondering if the bulls have lost control entirely.
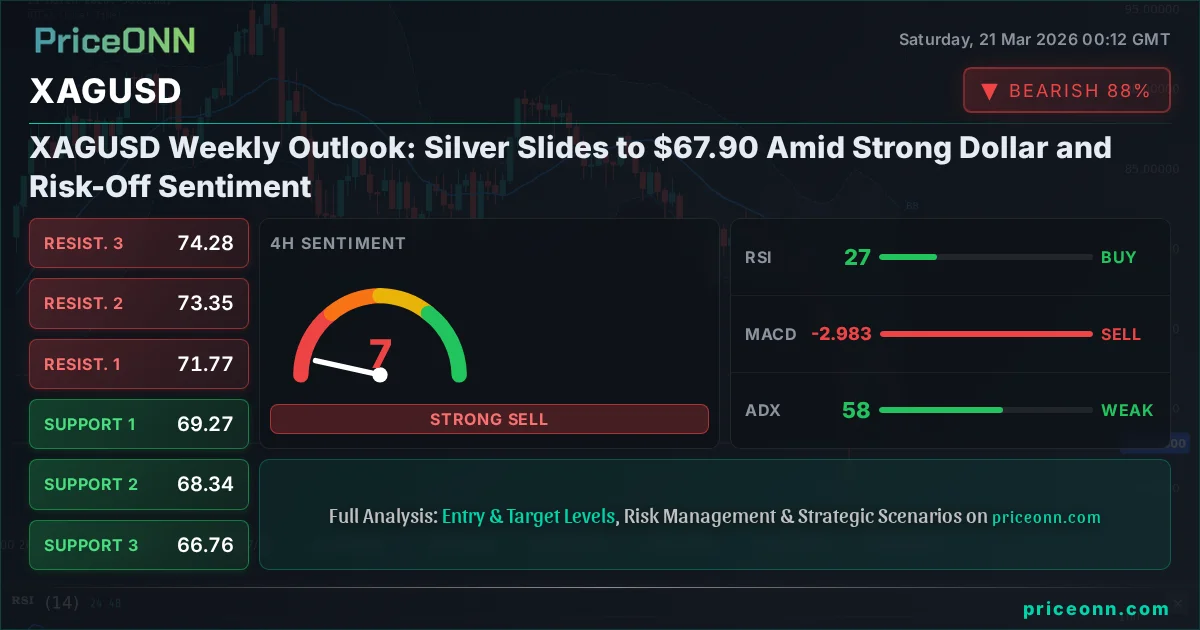
- XAGUSD is trading at $67.90, showing strong bearish momentum with RSI(14) at 30.51 on the 1H chart.
- Critical support sits at $67.33, tested heavily this week as the ADX indicates a strong downtrend.
- MACD histogram shows negative momentum across all timeframes, suggesting further downside potential.
- The strengthening DXY at 99.39 is correlating with XAGUSD's decline, increasing pressure on the precious metal.
The past week has been a stark reminder of how quickly market sentiment can shift. What started as a potentially consolidative period has morphed into a full-blown bearish trend for silver. On the 1-hour timeframe, the ADX reading of 36.09 signals a strong downtrend, a sentiment echoed by the 100% trend strength on the 4-hour chart. This isn't the kind of environment where a quick recovery is expected. The RSI(14) on the 1-hour chart is hovering around 30.51, firmly in oversold territory, which might suggest a short-term bounce is possible, but the underlying trend strength, particularly the ADX at 62.9 on the 4H, indicates that any such bounce is likely to be met with significant selling pressure. The MACD is also painting a consistent bearish picture, with negative momentum and the MACD line sitting below its signal line across all major timeframes. This suggests that sellers are firmly in control and are actively pushing prices lower.
The Dollar's Dominance and Risk Aversion
A primary driver behind silver's sharp decline is the resurgent strength of the US Dollar Index (DXY). Currently trading at 99.39, the DXY has shown considerable upward momentum, particularly on the daily chart where its trend strength is rated at 92%. This inverse correlation is a well-established market dynamic; as the dollar strengthens, commodities priced in dollars, like silver, tend to become more expensive for holders of other currencies, thereby reducing demand. This is precisely what we are witnessing. The market sentiment has also shifted towards risk aversion, a theme amplified by escalating geopolitical tensions and concerns about the global economic outlook. In such an environment, investors tend to flee riskier assets and seek refuge in perceived safe-haven assets like the US dollar, further bolstering its strength and simultaneously weighing on commodities like silver. The correlation between DXY's rise and XAGUSD's fall is becoming increasingly pronounced, a pattern that has held true across the week.
Broader Commodity Sell-off and Intermarket Dynamics
Silver is not acting in isolation; it's part of a broader commodity sell-off that has seen significant pressure on precious metals. Gold, silver's larger cousin, has also experienced a brutal week, tumbling below $4,500. Recent reports indicate gold's decline, with prices struggling to find footing near the $4,500 level after a sharp two-day downturn. While central bank demand could offer some support, the overwhelming pressure from higher interest rate expectations and a strengthening dollar is proving too much for gold to overcome. This contagion effect is clearly impacting silver. Furthermore, the performance of major indices like the S&P 500 and Nasdaq, which have seen significant declines (-1.21% and -1.65% respectively on the day), signals a clear risk-off sentiment in the broader financial markets. This risk aversion typically leads investors to shed commodity exposure, including silver, in favor of safer assets. The fact that oil prices have soared while gold and silver have plunged highlights a complex inflationary picture, where energy prices are signaling inflation while precious metals are acting more like risk assets being sold off.
Technical Breakdown: A Bearish Signal Across Timeframes
Looking deeper into the technicals, the picture for silver is undeniably bearish. On the 1-hour chart, the trend is firmly in a downtrend with 98% strength. Support levels at $67.33, $66.59, and $65.40 are now in focus. The RSI(14) at 30.51 suggests oversold conditions, but this is often seen during strong downtrends, meaning it's not necessarily a buy signal but rather an indication of intense selling pressure. The MACD remains bearish, consistently below its signal line, reinforcing the negative momentum. Bollinger Bands are trading below the middle band, indicating bearish pressure. Stochastic oscillators are deep in oversold territory, with %K at 12.14 and %D at 13.02, but again, this doesn't guarantee a reversal in a strong trend. The ADX at 36.09 confirms a robust downtrend. The overall signal across this timeframe is a clear 'SELL'.
The situation is even more pronounced on the 4-hour timeframe. Here, the trend is undeniably bearish with 100% strength. Support levels are being eyed at $69.27, $68.34, and $66.76. The RSI(14) plunges to 27.22, indicating extreme oversold conditions. However, the ADX at a staggering 62.9 signifies an exceptionally strong downtrend – the kind where catching falling knives is a dangerous game. The MACD continues its bearish trajectory, and Stochastic oscillators show %K at 41.41 and %D at 50.75, still suggesting further downside with %K below %D. The overall signal here is a strong 'SELL'.
Even the daily chart, which often provides a longer-term perspective, reflects this bearish sentiment, though with slightly less conviction. The trend is still classified as bearish with 90% strength, with key support levels at $66.58, $60.41, and $55.38. The RSI(14) is at 33.56, still in oversold territory, but the ADX at 19.51 suggests a weakening trend, possibly hinting at a period of consolidation or a potential bottoming process in the longer term. However, given the overwhelming bearish signals on shorter timeframes and the prevailing market sentiment, it would be premature to bet on a significant daily trend reversal just yet. The 'SAT' signal on the daily chart, derived from a mix of indicators, still leans towards caution for buyers.
Geopolitical Headwinds and Inflationary Puzzles
The current geopolitical landscape adds another layer of complexity and uncertainty, which, ironically, often benefits safe-haven assets. However, in the current market environment, the narrative seems to be dominated by other factors. Escalating conflicts in the Middle East and other regions typically increase demand for gold and, by extension, silver as hedges against uncertainty. Yet, we are seeing the opposite. This suggests that the immediate impact of geopolitical risk is being overshadowed by broader concerns about inflation, interest rates, and a potential global economic slowdown. Recent news from Reuters highlighted that central bank officials are emphasizing 'stubborn' inflation, which directly translates into expectations of sustained higher interest rates. This is a critical point: while geopolitical tension might normally support precious metals, the dominant narrative of sticky inflation and hawkish central banks is currently driving the price action. The market appears to be prioritizing interest rate differentials and the strength of the US dollar over traditional safe-haven demand, a dynamic that has been particularly punishing for silver this week.
What About Other Precious Metals and Related Assets?
The performance of gold provides a crucial comparative context. The recent tumble in gold, shedding over 8.50% this week and experiencing an eight-day losing streak, mirrors silver's plight, albeit with slightly different magnitudes. While gold is often seen as a purer safe-haven, its recent decline alongside silver, despite soaring oil prices (a classic inflation hedge), suggests that the market is pricing in a scenario where central banks will prioritize inflation control through aggressive rate hikes, even at the cost of economic growth. This is a challenging environment for all non-yielding assets. The performance of mining stocks also offers clues. While specific company data isn't provided here, general trends in the mining sector often follow the price of the underlying commodity. If silver stocks are also experiencing significant downturns, it further confirms the bearish sentiment. The fact that oil prices are soaring while precious metals are falling creates a divergence that is unusual and suggests that the market's focus is heavily on the 'higher for longer' interest rate narrative, potentially at the expense of inflation hedging properties of metals.
Navigating the Current Market: What Traders Should Watch
For traders looking to navigate this challenging market, a few key areas demand close attention. Firstly, the $67.33 support level on XAGUSD is paramount. A decisive break below this level, especially on increased volume, would confirm the continuation of the bearish trend and likely open the door for further declines towards $66.59 and potentially $65.40. Conversely, any sustained move back above the $69.26 resistance level would be the first sign of a potential stabilization, though a true bullish reversal would require breaking through subsequent resistance levels like $70.45 and $71.18. The $67.90 current price is a crucial psychological level to watch in the immediate term.
Secondly, monitoring the DXY's trajectory is essential. As long as the DXY remains strong, with its daily trend showing 92% strength, it will continue to act as a headwind for silver. A significant reversal in the DXY, perhaps triggered by a shift in Federal Reserve policy expectations or a sudden escalation of global risk that forces a flight to safety into currencies other than the USD, could provide some relief for silver. However, based on current data, the dollar's strength appears entrenched.
Thirdly, market sentiment indicators, such as the VIX (though not provided here) or the performance of major equity indices like the S&P 500 and Nasdaq, will offer further clues. A continued sell-off in equities would reinforce the risk-off environment and likely keep pressure on silver. Conversely, a stabilization or recovery in stock markets might coincide with a temporary reprieve for the precious metal, although it wouldn't necessarily signal a full trend reversal without accompanying dollar weakness or a shift in rate hike expectations.
The Role of Central Banks and Future Expectations
The ongoing narrative surrounding central bank policy, particularly the US Federal Reserve, remains a dominant force. Recent statements from Fed officials emphasizing 'stubborn' inflation suggest a continued commitment to their hawkish stance. This means that the market should brace for potentially higher interest rates for a longer duration than previously anticipated. This policy environment is inherently bearish for precious metals like silver, which do not offer yields and become less attractive as interest-bearing assets become more appealing. The CME FedWatch tool, if available, would show the current pricing of future rate hikes, providing a quantitative measure of market expectations. Without that specific data point, we must rely on the qualitative statements and the general market sentiment which points towards a higher-for-longer rate scenario. Any deviation from this expectation, such as dovish signals from the Fed or a sudden economic downturn that forces a policy pivot, could be a catalyst for a silver recovery. However, until such a shift occurs, the path of least resistance for silver appears to be downwards.
The European Central Bank (ECB) also plays a role, although its influence on XAGUSD is more indirect compared to the Fed. If the ECB signals a more aggressive stance on inflation or maintains a hawkish outlook, it could contribute to broader dollar strength or impact the Euro, which in turn influences EURUSD and subsequently affects global currency markets. However, the immediate focus for silver remains squarely on the Fed and the US interest rate outlook. The interplay between inflation data, central bank rhetoric, and market pricing of future rate hikes will be the key determinant of silver's short-to-medium term direction.
Scenario Analysis: Where Does Silver Go From Here?
Given the current technical setup and market conditions, we can outline three potential scenarios for XAGUSD:
Bearish Scenario: Continued Downslide
65% ProbabilityNeutral Scenario: Consolidation and Choppy Action
25% ProbabilityBullish Scenario: Short-Covering Rally
10% ProbabilityExpert Take: Patience is Key in This Downtrend
The current technical readings across multiple timeframes for XAGUSD strongly suggest that bearish momentum is dominant. The ADX values are exceptionally high on the 4-hour and 1-hour charts, confirming the strength of the current downtrend. While the RSI and Stochastic oscillators are deep in oversold territory, indicating potential for a short-term bounce, the overwhelming trend strength means that such bounces are likely to be short-lived and met with renewed selling pressure. For any trader considering a long position, confirmation is absolutely crucial. Waiting for a clear break of resistance levels, such as $69.26, coupled with a shift in momentum indicators and a weakening dollar, would be a more prudent approach than attempting to catch a falling knife. Risk management should be paramount, with tight stop-losses employed to protect capital in this volatile environment. The near-term outlook remains cautious, and patience will likely be rewarded for those waiting for a more defined setup.
Frequently Asked Questions: XAGUSD Analysis
What happens if XAGUSD breaks below the $67.33 support level?
A decisive break below $67.33, especially with increased volume, would likely signal a continuation of the bearish trend. This could open the door for further declines towards the next support levels at $66.59 and potentially $65.40. The strong ADX reading on the 4-hour chart suggests such a move would be part of a robust downtrend.
Should I consider buying XAGUSD at current levels around $67.90 given the oversold RSI?
While the RSI is oversold, attempting to buy into a strong downtrend indicated by ADX values above 40 can be risky. A high-probability strategy would involve waiting for confirmation, such as a break above resistance at $69.26 or a significant shift in the DXY's trend, before considering a long position. Risk management with tight stops is essential if entering now.
Is the MACD histogram showing a bearish signal for XAGUSD at current levels?
Yes, the MACD histogram is consistently negative across all timeframes (1H, 4H, 1D), and the MACD line is below its signal line. This indicates negative momentum and suggests that sellers are in control, reinforcing the bearish outlook for XAGUSD in the short to medium term.
How will the strengthening DXY at 99.39 affect XAGUSD's outlook this week?
The strengthening DXY at 99.39 exerts significant downward pressure on XAGUSD due to the inverse correlation between the dollar and dollar-denominated commodities. This strong dollar environment, driven by higher interest rate expectations, makes silver more expensive for foreign buyers and is a key factor contributing to the current bearish sentiment and price decline.
| Indicator | Value | Signal | Interpretation |
|---|---|---|---|
| RSI (14) | 30.51 | Oversold | Potential for bounce, but trend strength indicates caution. |
| MACD Histogram | -5.20 | Negative Momentum | Sellers in control, supporting further downside. |
| Stochastic | 12.14 / 13.02 | Extreme Oversold | Indicates intense selling pressure; reversal not guaranteed. |
| ADX | 36.09 | Strong Downtrend | Confirms a robust trend, caution advised for counter-trend trades. |
| Bollinger Bands | Below Middle Band | Bearish Pressure | Price is trading in the lower half, indicating selling bias. |
Track markets in real-time
AI-powered analysis, technical indicators and real-time price data.
Join Our Telegram Channel
Breaking market news, AI analysis and trading signals instantly.
Join Channel