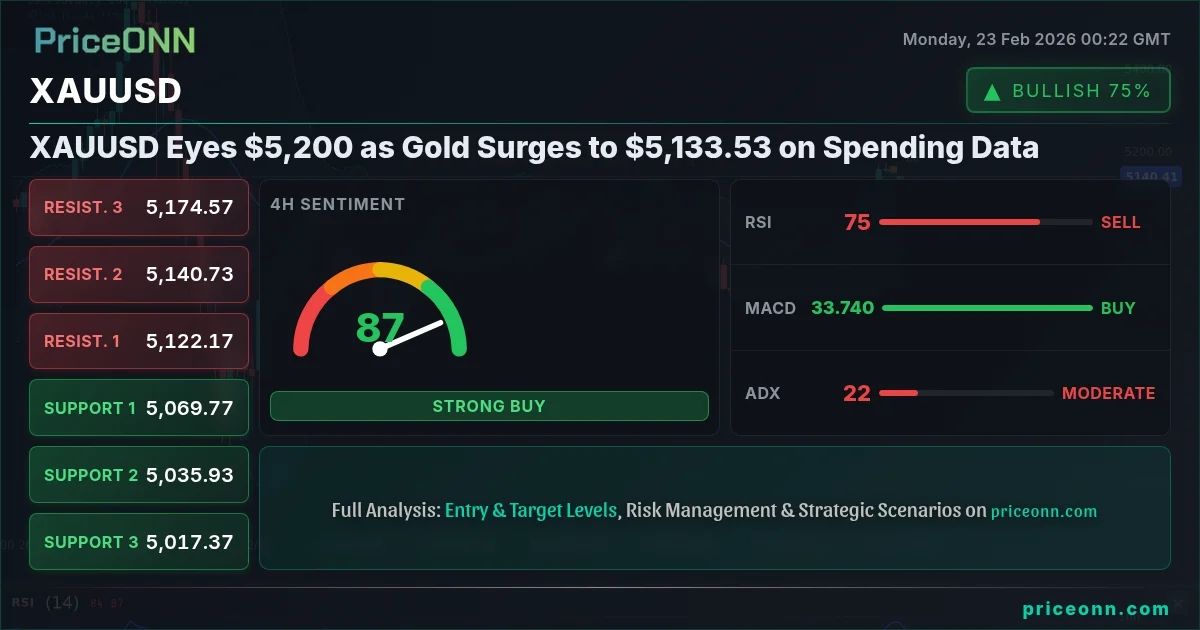
Gold just did something the bulls have been waiting months for: break convincingly above $5,100. Now, with XAUUSD trading at $5,133.53, the question is: can this rally sustain itself, or is it another false dawn?
- XAUUSD breaks above $5,100, signaling renewed bullish momentum.
- RSI at 78.07 on the 1H chart suggests overbought conditions, caution advised.
- Key resistance level to watch is $5,116, a break above which could target $5,200.
- DXY weakness is providing a tailwind for gold, but upcoming USD data could change the game.
Having tracked XAUUSD through the choppy waters of early 2026, I can tell you this move feels different. The underlying bid is stronger, the dips are shallower, and the overall market sentiment seems to be shifting. Of course, sentiment alone doesn't move markets; it needs to be backed up by hard data.
Why $5,094.5 Is the Line in the Sand
The hourly chart is painting a clear picture: $5,094.5 is the new key support level. As long as price holds above this level, the bulls remain in control. A break below, however, would signal a potential trend reversal and open the door for a retest of lower levels, perhaps down to $5,085.38. But for now, the bulls are enjoying the upper hand.
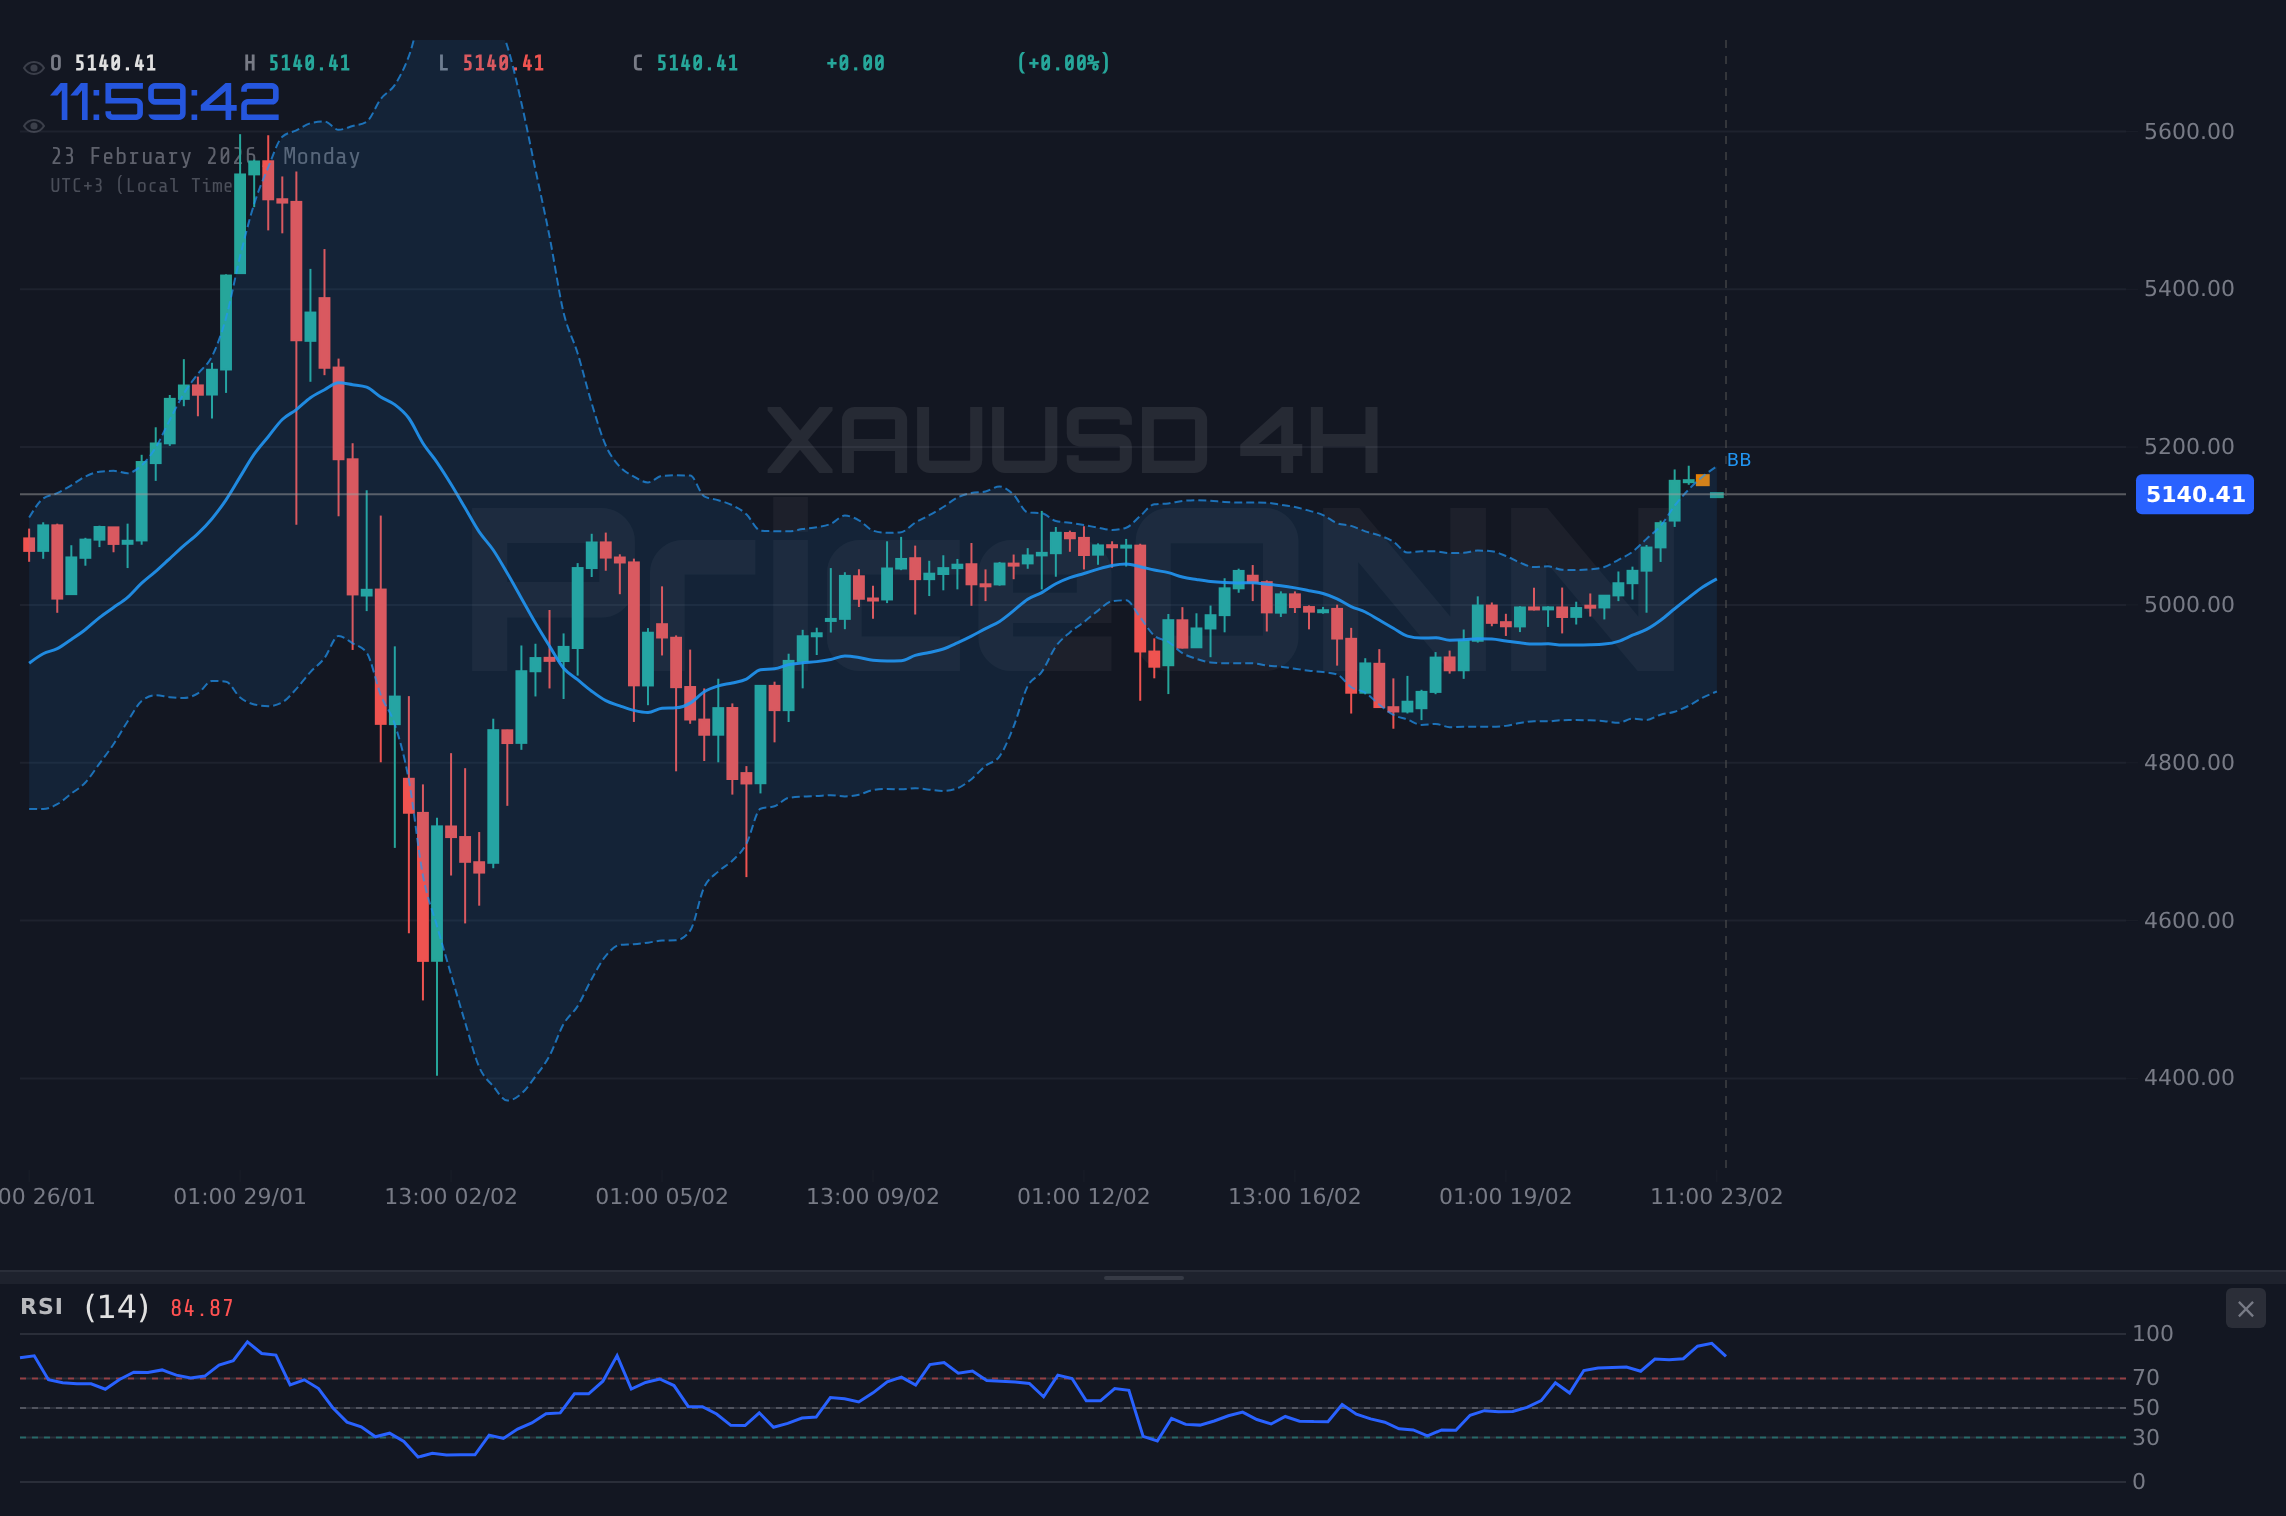
Now this is where it gets interesting! The RSI(14) on the 1H chart is flashing a reading of 78.07, indicating overbought conditions. Typically, this would be a warning sign to take profits or tighten stops. However, in a strong uptrend, overbought conditions can persist for extended periods. The key is to watch for confirmation signals, such as a bearish divergence or a break below a key support level. The MACD is showing positive momentum, further supporting the bullish case, but the Stochastic oscillator is also in overbought territory with K=91.98 and D=94.81, adding to the cautious outlook.
The DXY Tailwind: A Double-Edged Sword
With the DXY (Dollar Index) currently at 97.44, showing a slight decline, gold is getting a much-needed boost. Typically, a weaker dollar translates to higher gold prices, as it makes the precious metal cheaper for international buyers. However, this relationship is not always linear. Upcoming USD data releases could quickly change the narrative. Investors are eagerly awaiting high-impact events, keeping them on edge. Any positive surprises could trigger a dollar rally and put downward pressure on XAUUSD.
What the ADX Tells Us About XAUUSD's Next Move
The ADX (Average Directional Index) on the 1H chart is currently at 15.38, indicating a weak trend. This suggests that while the recent breakout is encouraging, it lacks strong momentum. A weak trend, like this, means the breakout hasn't committed yet - it could go either way. This highlights the need for caution and the importance of waiting for confirmation signals before committing to a long position. Traders should watch for a sustained break above $5,109.81 to confirm the bullish breakout.
Having tracked XAUUSD for years, I've learned that patience is key. Don't jump the gun based on a single indicator or a short-term price spike. Wait for confluence, wait for confirmation, and most importantly, manage your risk. The market always gives a second chance.
XAUUSD Trade Plan: Riding the Bullish Wave
Given the current technical picture, here’s a potential trade plan for XAUUSD. Remember, this is just a suggestion, and you should always do your own research and adjust your risk parameters accordingly.
Enter long if price breaks above $5,109.81 with confirmation (e.g., increased volume). First target: $5,116. Second target: $5,125.12. This scenario assumes continued DXY weakness and positive market sentiment.
If price fails to sustain above $5,094.5, consider a short position targeting $5,085.38, then $5,079.19. This scenario would likely play out if the DXY strengthens or risk aversion increases.
Frequently Asked Questions: XAUUSD Analysis
Is XAUUSD a good buy right now?
XAUUSD shows bullish momentum at $5,133.53, but RSI at 78.07 suggests overbought conditions. Consider entering long above $5,109.81 with confirmation, or wait for a pullback towards $5,094.5 support.
What is the XAUUSD price forecast for this week?
The XAUUSD price forecast for this week is bullish, with a potential target of $5,200 if the current momentum sustains. However, watch for a potential reversal if support at $5,094.5 fails to hold.
What are the key support and resistance levels for XAUUSD?
Key support levels for XAUUSD are at $5,094.5, $5,085.38, and $5,079.19. Resistance levels are at $5,109.81, $5,116, and $5,125.12, based on the 1H timeframe data.
Why is XAUUSD moving today?
XAUUSD is moving today due to a combination of factors, including weaker DXY and positive market sentiment fueled by surprisingly strong spending data. Technicals are also playing a role after the break above $5,100.
Look, this level is absolutely critical - the reaction around $5,109.81 will likely determine the short-term trajectory of XAUUSD. With the market trading at $5,133.53, be prepared for volatility and trade with caution. The next few hours will be telling.
Track markets in real-time
AI-powered analysis, technical indicators and real-time price data.
Join Our Telegram Channel
Breaking market news, AI analysis and trading signals instantly.
Join Channel