As the dust settles from recent central bank commentary and geopolitical unease, XAUUSD finds itself trading at $5,142.93. The question now is whether this dip represents a strategic entry point for bullish investors or a warning sign of a more pronounced downtrend. With the dollar index (DXY) flexing its muscles and risk sentiment wavering, gold's traditional safe-haven appeal is being tested.
- RSI at 44.94 on the 1H chart suggests potential for further downside before oversold conditions appear.
- Key near-term support lies at $5,134.17, a break below which could accelerate losses.
- MACD on the 1D chart is showing negative momentum, hinting at a possible trend reversal.
- DXY strength and rising bond yields are currently weighing on XAUUSD, creating headwinds.
The pressure on gold stems in part from the resurgence of the dollar. With the DXY currently at 97.59, its highest level in weeks, gold is finding it difficult to maintain its footing. The stronger dollar makes gold more expensive for international buyers, dampening demand. Furthermore, rising treasury yields are offering investors an alternative to gold, further reducing its allure.
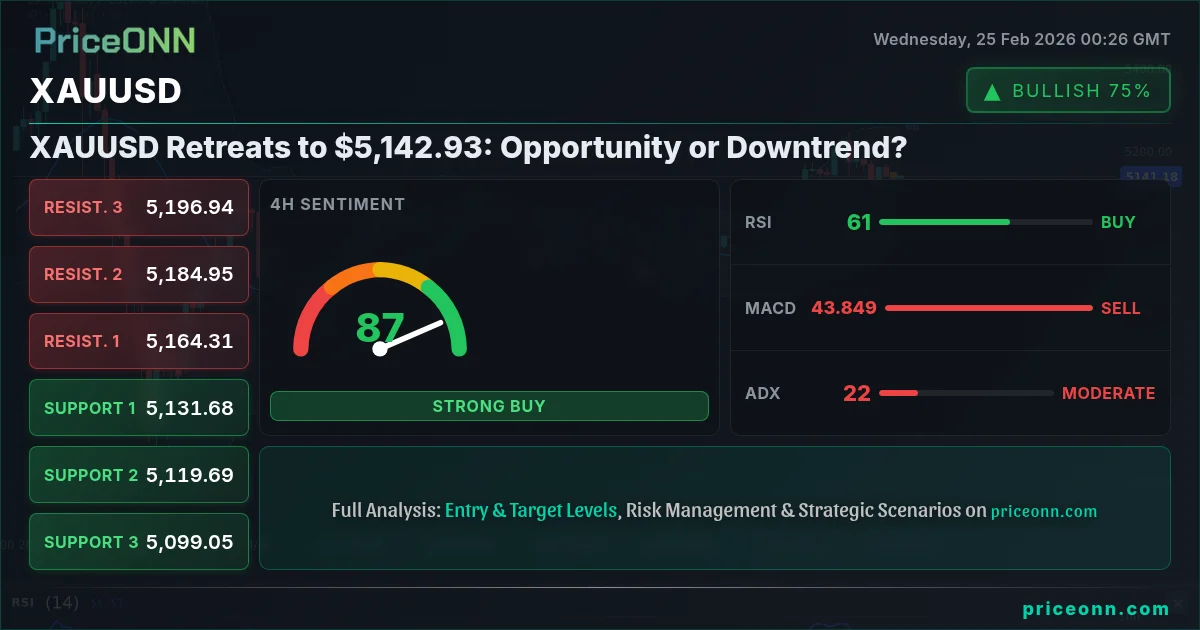
The technical picture presents a mixed bag. On the one-hour chart, XAUUSD is exhibiting a bearish trend with 87% strength. The immediate support level to watch is $5,134.17. If this level breaks, we could see a quick move down to $5,124.68. However, the Relative Strength Index (RSI) at 44.94 suggests that the market is not yet oversold, leaving room for further downside. Conversely, the Stochastic oscillator (K=70.97, D=72.38) indicates a potential overbought condition, hinting at a possible near-term bounce.
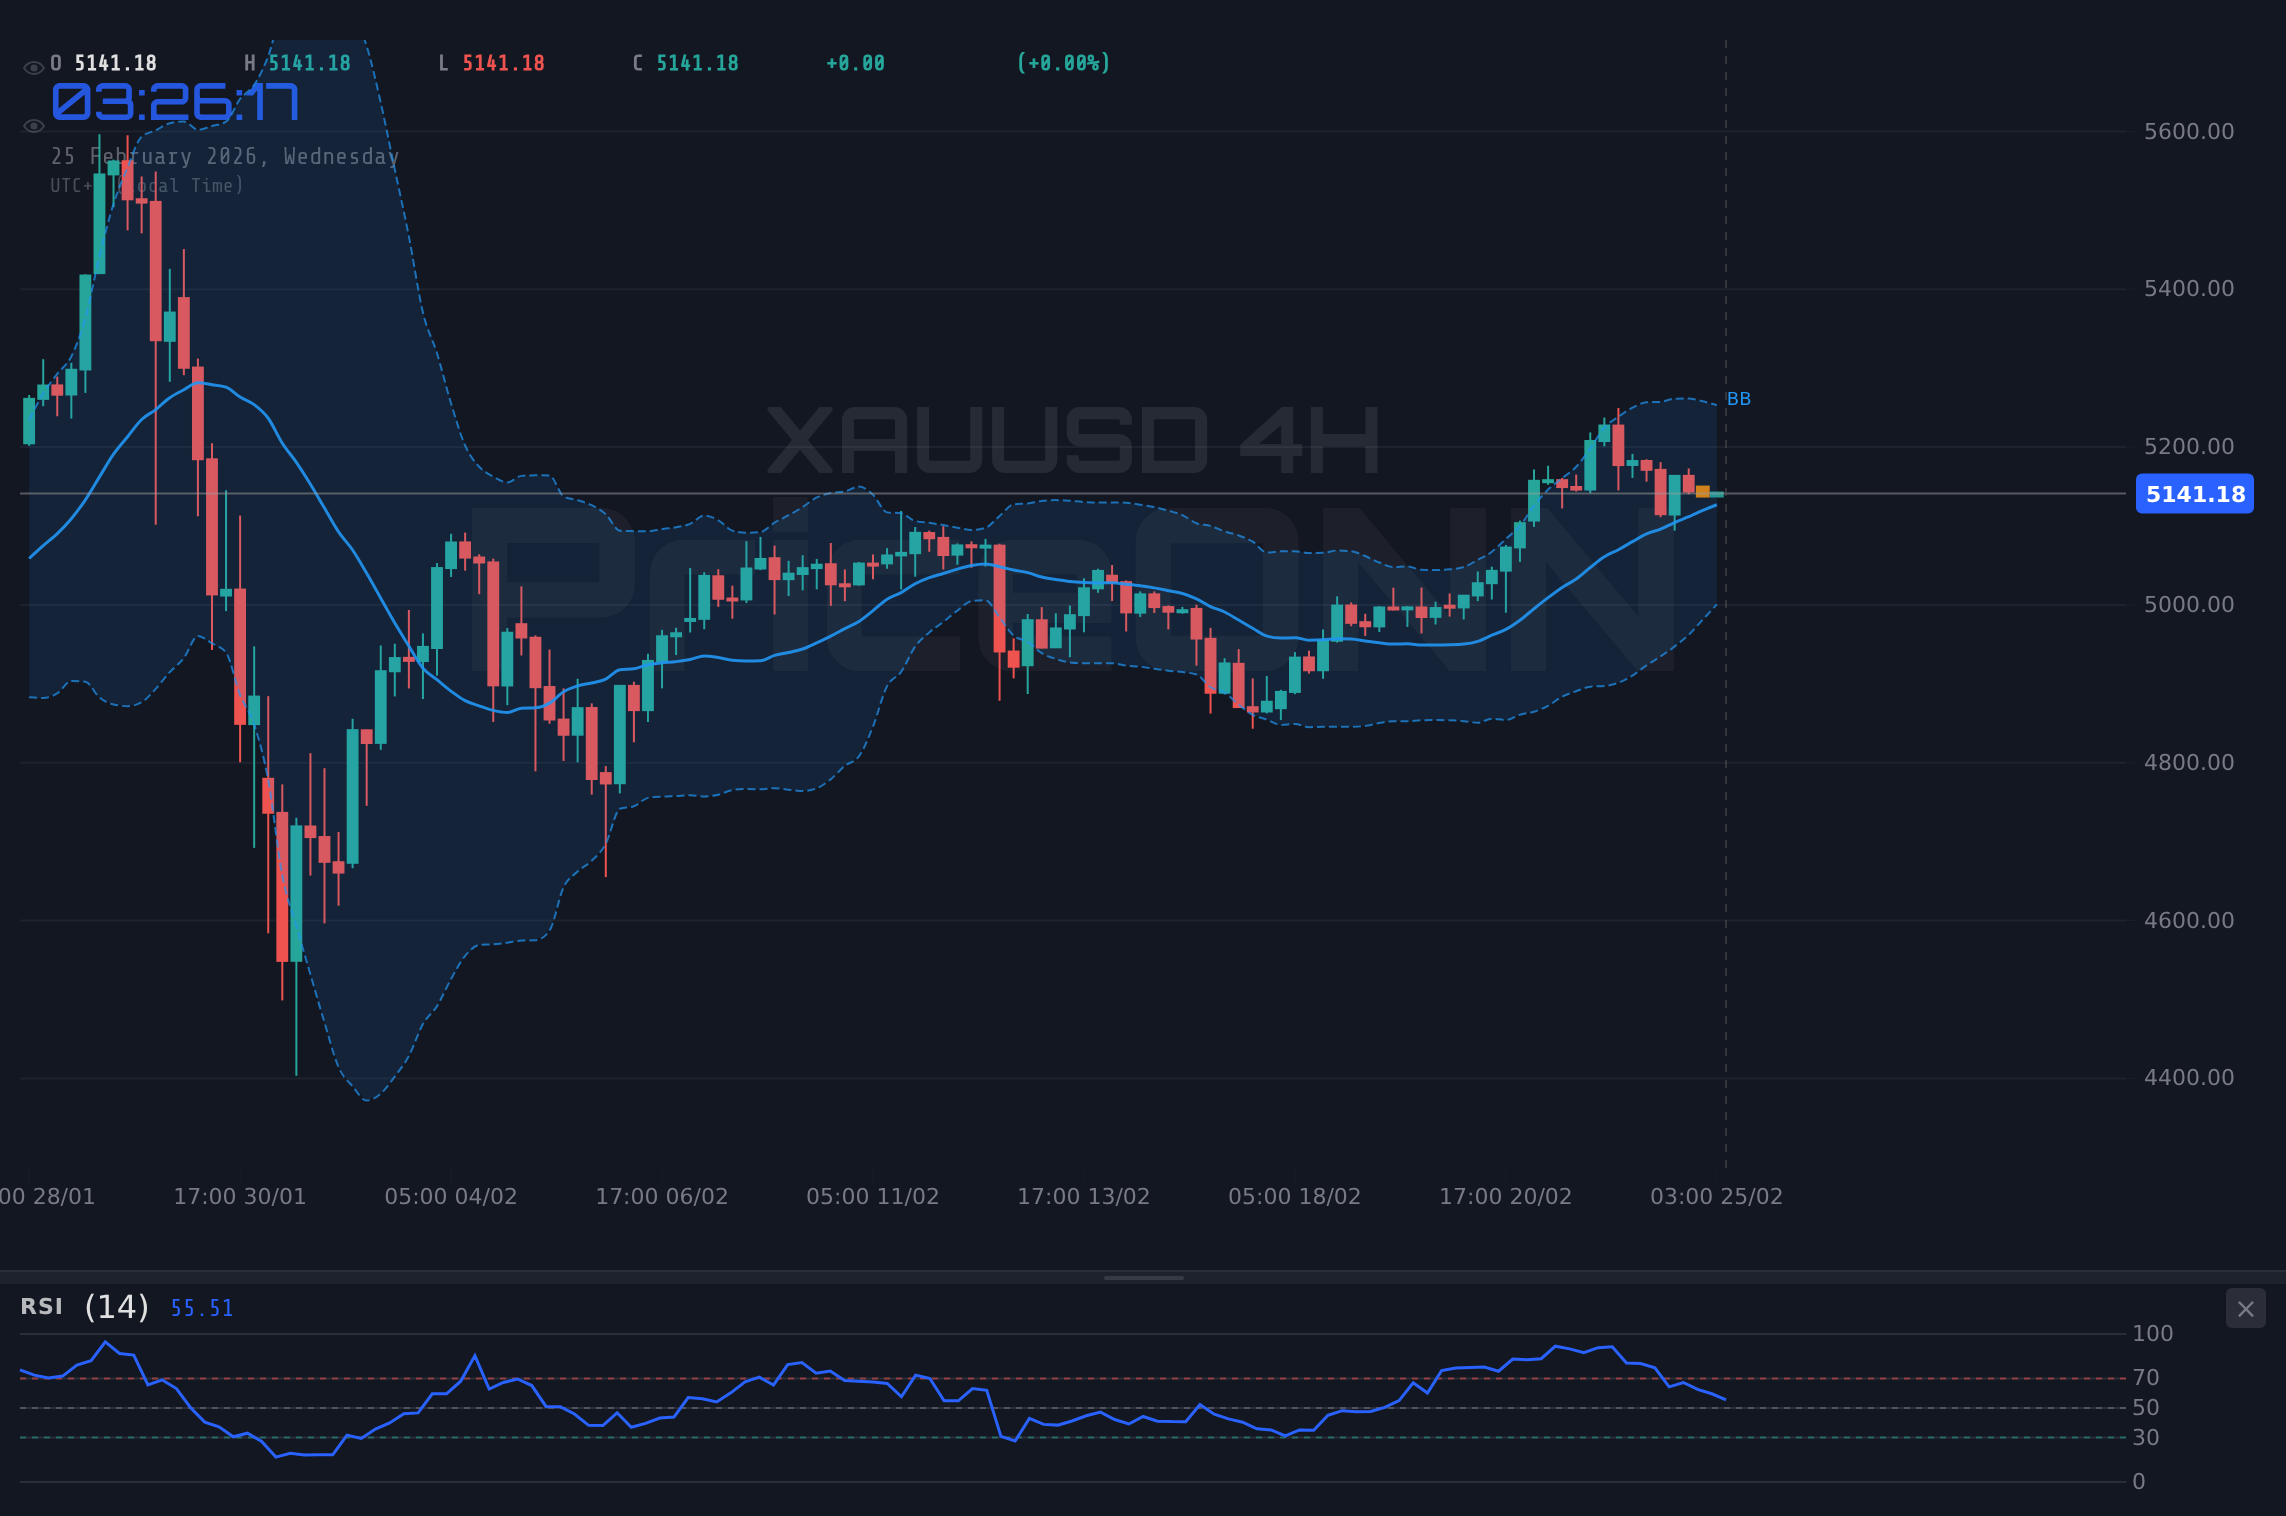
Stepping back to the four-hour chart provides a slightly different perspective. Here, the trend is neutral, and the RSI sits at 56.95. The key resistance level is $5,186.74. A break above this level could signal a shift in momentum and attract further buying interest. However, the MACD is still showing negative momentum, suggesting that the bears are not ready to relinquish control just yet.
The daily chart offers a longer-term view. The overall trend is bullish, but the strength is waning (89%). The RSI at 57.53 remains in neutral territory, and the MACD is showing negative momentum, signaling a potential trend reversal. The first support level to watch on the daily chart is $5,138.31. A break below this level could trigger a more significant correction.
Traders are also closely monitoring economic data releases. The recent USD data, with actual at 91.2 against a forecast of 87.4, bolstered the dollar and added pressure to gold. Looking ahead, traders will be eyeing upcoming data releases that could provide further clues about the Fed's future policy decisions.
The question of whether to buy the dip depends on your trading style and risk tolerance. For scalpers, the near-term volatility may offer opportunities to profit from short-term price swings. However, given the overall bearish trend on the one-hour chart, caution is advised. Swing traders may want to wait for a clear breakout above $5,186.74 on the four-hour chart before initiating long positions. Long-term investors may view the current dip as a chance to accumulate gold at a lower price, but they should be prepared for potential further downside.
Upcoming USD data releases could trigger significant volatility in XAUUSD. Exercise caution and manage your risk accordingly.
Why $5,134 is the Line in the Sand
The $5,134 level is critical for several reasons. Firstly, it represents a confluence of support levels across multiple timeframes. Secondly, a break below this level could trigger stop-loss orders and accelerate the decline. Thirdly, it would invalidate the short-term bullish outlook and open the door for a test of lower support levels.
XAUUSD: Bullish Scenario
If XAUUSD can hold above $5,134.17 and break above $5,159.32, we could see a rally towards $5,174.98 and potentially $5,184.47. This scenario is contingent on a weakening dollar and improving risk sentiment.
XAUUSD: Bearish Scenario
If XAUUSD breaks below $5,134.17, we could see a sharp decline towards $5,124.68 and potentially $5,109.02. This scenario is contingent on continued dollar strength and deteriorating risk sentiment.
Entry Trigger: Wait for a confirmed break above $5,159.32 on the 1H chart. Target 1: $5,174.98. Target 2: $5,184.47. Stop/Invalidation: $5,134.17. This trade setup has a 60% probability based on current technical indicators and market conditions.
Risk/Reward Analysis
The potential reward for this trade setup outweighs the risk. If XAUUSD reaches the first target, the reward is approximately $15 per ounce. If it reaches the second target, the reward is approximately $25 per ounce. The risk is limited to approximately $25 per ounce, making this a favorable risk/reward proposition.
Technical Summary
Here's a quick look at the key technical indicators for XAUUSD:
Technical Outlook Summary
| Indicator | Value | Signal |
|---|---|---|
| RSI (14) | 44.94 | Neutral |
| MACD Histogram | Negative | Bearish |
| Stochastic | K=70.97, D=72.38 | Bearish |
| ADX | 24.98 | Moderate Trend |
| Bollinger | Middle Band | Watch |
Key Levels to Watch
Keep an eye on these key support and resistance levels:
Key Levels
Support Levels
Resistance Levels
Frequently Asked Questions: XAUUSD Analysis
Is XAUUSD a good buy right now?
XAUUSD is experiencing a dip to $5,142.93, presenting a potential buying opportunity if it holds above the key support at $5,134.17. However, negative momentum on the MACD suggests caution, and traders should wait for a confirmed breakout above $5,159.32 before entering long positions.
What is the XAUUSD price forecast for this week?
The XAUUSD price forecast for this week hinges on its ability to hold above $5,134.17. If it does, we could see a rally towards $5,174.98 and potentially $5,184.47, giving this scenario a 60% probability. A break below $5,134.17 could trigger a decline towards $5,124.68 and $5,109.02.
What are the key support and resistance levels for XAUUSD?
Key support levels for XAUUSD are $5,134.17, $5,124.68, and $5,109.02. Key resistance levels are $5,159.32, $5,174.98, and $5,184.47. These levels should be closely monitored for potential breakouts or breakdowns.
Why is XAUUSD moving today?
XAUUSD is moving lower today due to a strengthening dollar index (DXY) and rising treasury yields, which are reducing its appeal as a safe-haven asset. The better than expected USD data also contributed to the dollar's strength.
Track markets in real-time
AI-powered analysis, technical indicators and real-time price data.
Join Our Telegram Channel
Breaking market news, AI analysis and trading signals instantly.
Join Channel