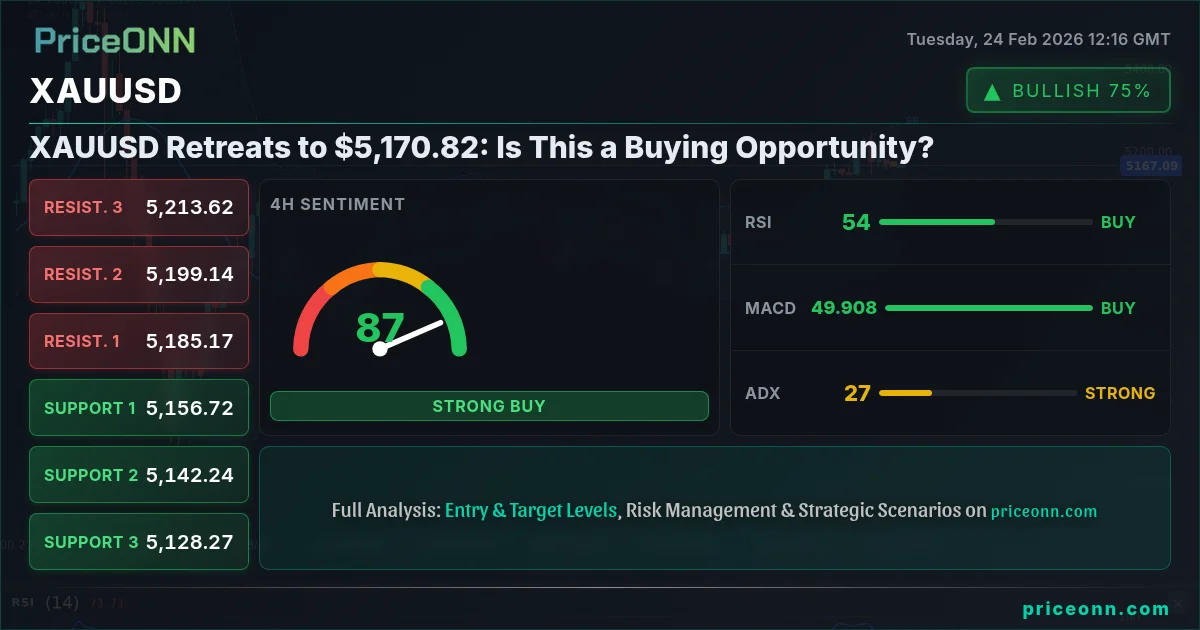
Gold is currently trading at $5,170.82, a slight pullback from recent highs. Is this a buying opportunity or a warning sign? XAUUSD today analysis reveals a complex technical picture that requires careful consideration.
- RSI at 49.44 on the 1H chart suggests neutral momentum, but tilting bearish.
- Key support level to watch is $5,163.55, a break below could signal further downside.
- MACD on the 1H chart indicates negative momentum, signaling potential selling pressure.
- DXY's rise to 97.58 is putting downward pressure on XAUUSD.
Having tracked XAUUSD through various market cycles, I've observed that pullbacks can often present excellent entry points for long-term investors. However, it's crucial to differentiate between a temporary dip and a trend reversal. The current technical setup requires a nuanced approach, blending both bullish and bearish signals to formulate a comprehensive trading strategy.
Decoding XAUUSD's Multi-Timeframe Analysis
Let's delve into a multi-timeframe analysis to gain a clearer perspective. On the 1-hour chart, XAUUSD exhibits a neutral trend, with the ADX at a moderate 22.39. This suggests that the current pullback isn't driven by a strong bearish trend but rather a period of consolidation or profit-taking. However, the RSI at 49.44 hints at weakening bullish momentum. The MACD further supports this notion, indicating negative momentum with the MACD line below the signal line. This is exactly where you need to pay attention. A strong bearish cross could signal further declines.
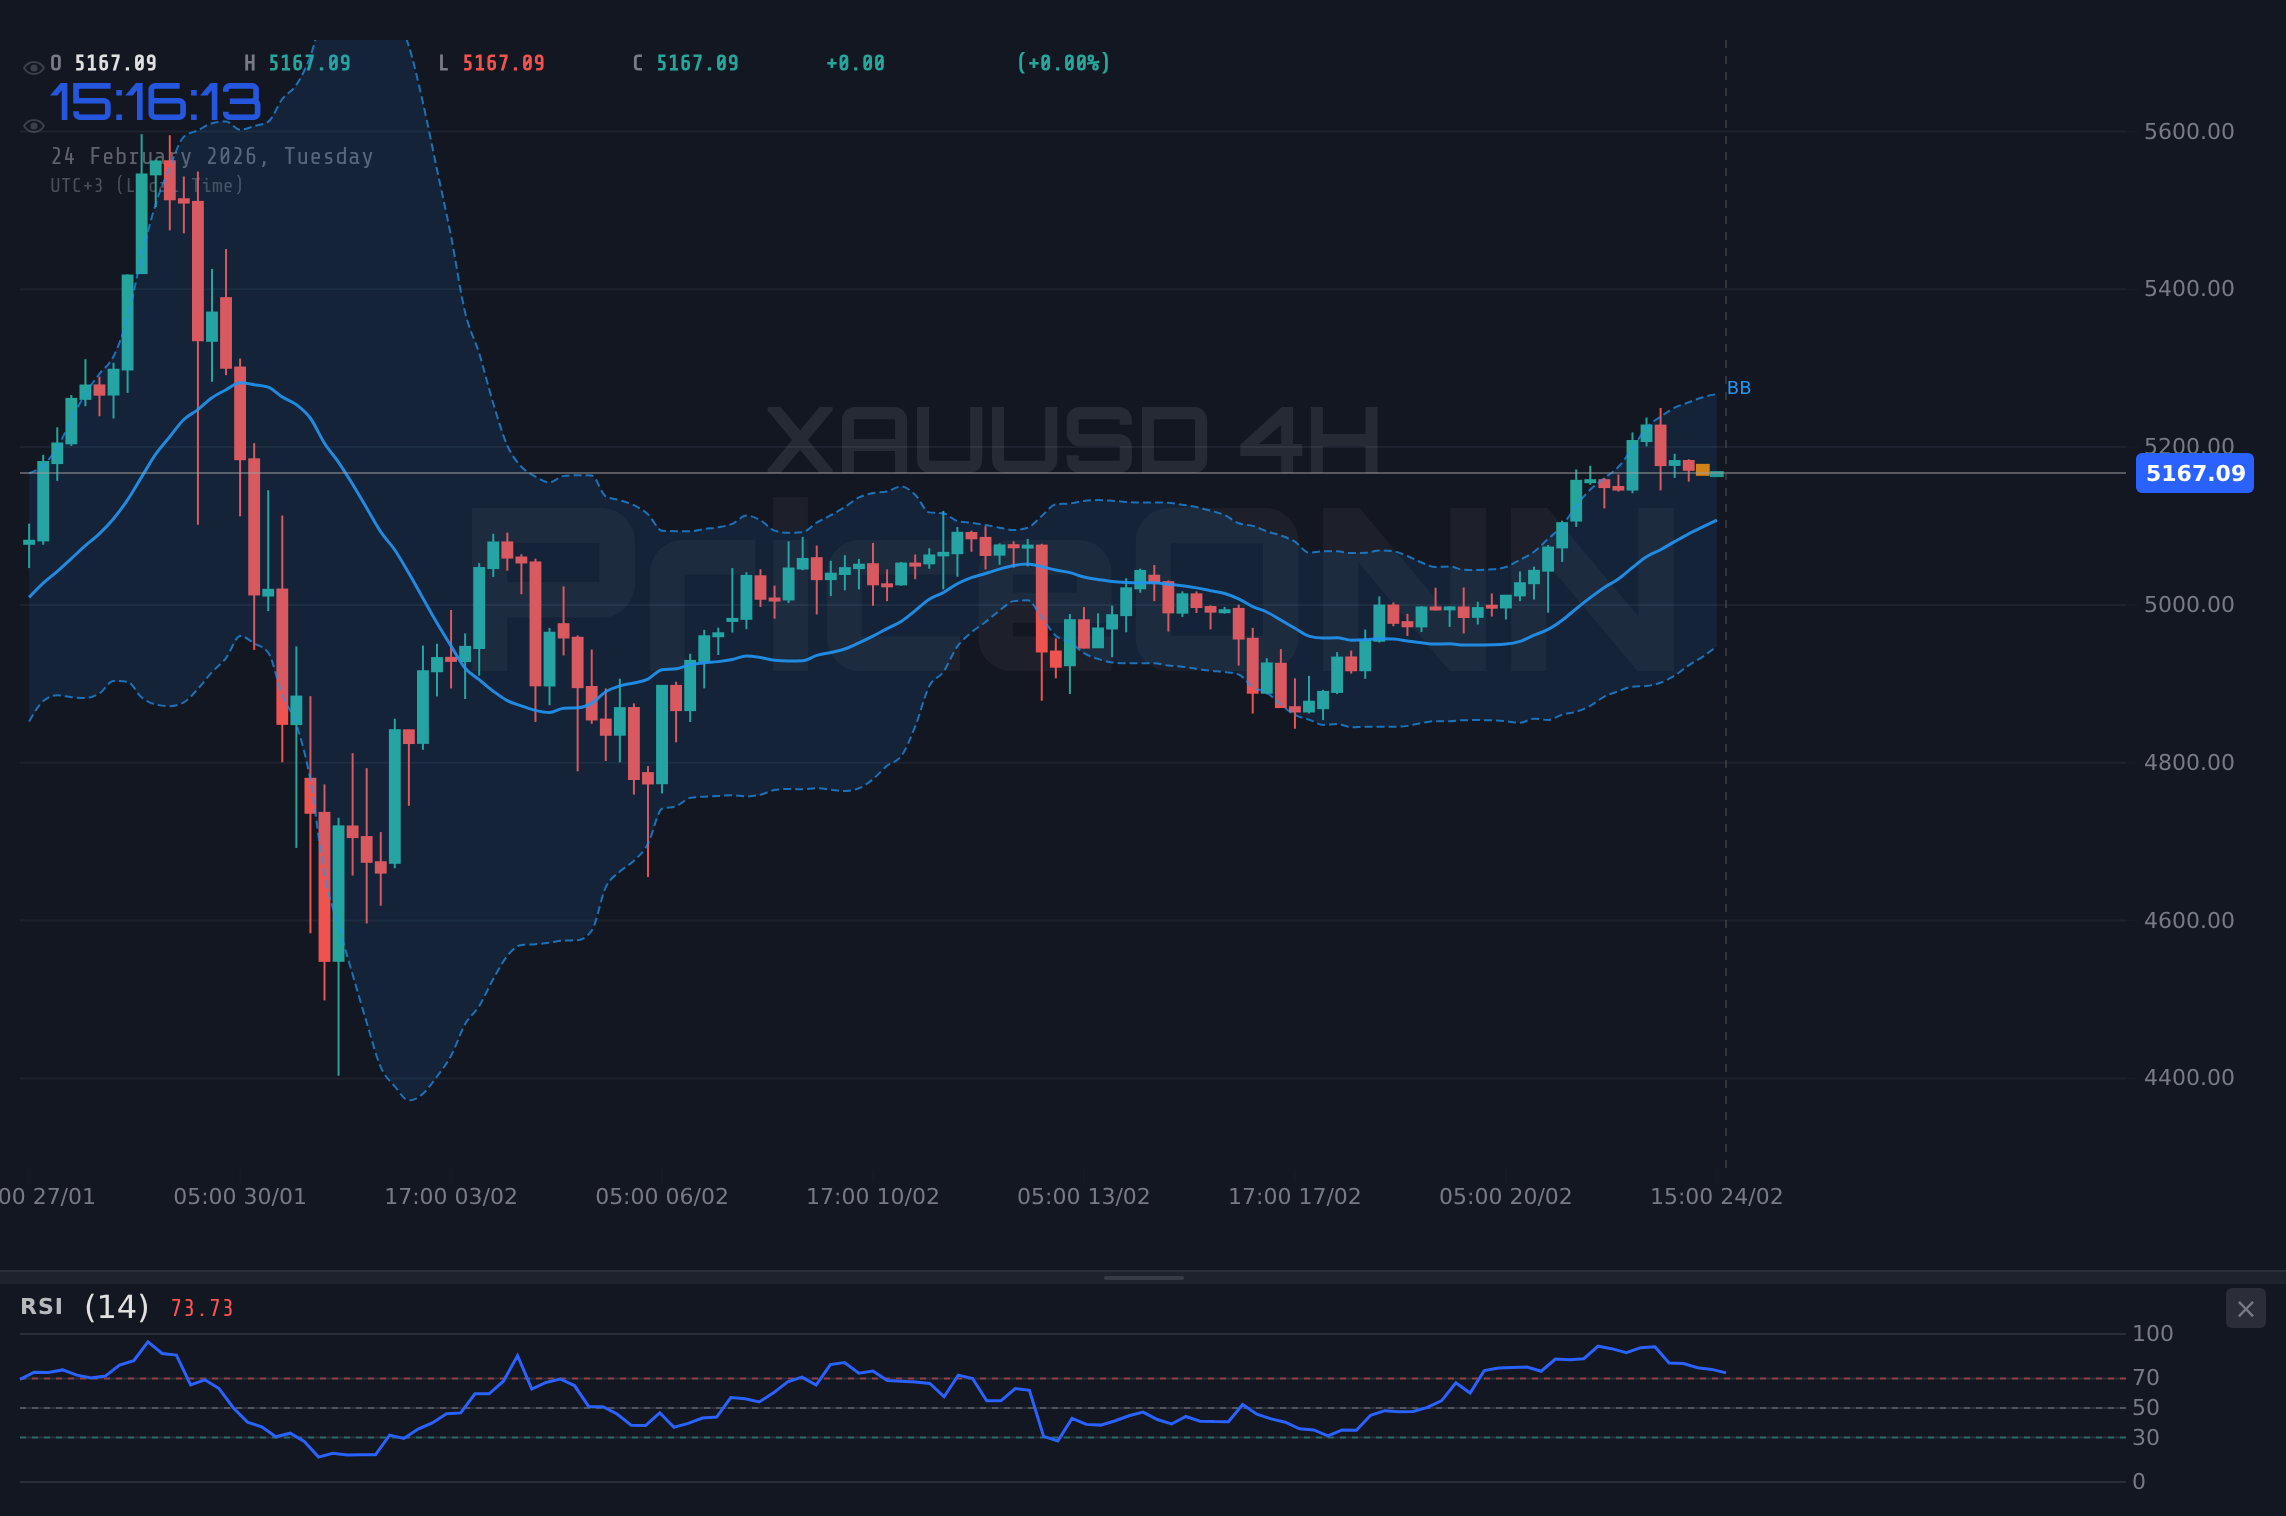
Stepping up to the 4-hour chart reveals a different picture. The trend shifts to bullish, with a robust ADX of 28.28. This indicates a prevailing uptrend that is still in play. The RSI at 64.98, while still in neutral territory, leans towards overbought conditions, suggesting potential for a near-term correction. The MACD remains positive, reinforcing the bullish sentiment on this timeframe.
Zooming out to the daily chart, the bullish trend persists, albeit with a slightly weaker ADX of 18.72. This suggests a fading trend, warranting caution. The RSI at 58.66 remains in neutral territory. The MACD is positive, but the Stochastic oscillator shows %K > %D which is a bullish sign. The indicator conflict warrants caution. Now this is where it gets interesting!
Why $5,163.55 is the Line in the Sand
Key levels are crucial for any technical analysis, and for XAUUSD, the immediate support level to watch is $5,163.55. This level has been tested multiple times in the past, acting as a reliable floor for price action. A decisive break below this level could trigger a cascade of stop-loss orders, leading to a more significant correction towards the next support at $5,154.44. If that level breaks, prepare for a retest of the $5,145.73 area.
On the upside, immediate resistance lies at $5,181.37. A successful breach of this level could pave the way for a retest of the recent highs at $5,190.08 and potentially $5,199.19. This is exactly where you need to pay attention. A decisive breakout above $5,199.19 would confirm the continuation of the bullish trend.
XAUUSD Trend Analysis: Bulls vs. Bears
The bullish scenario hinges on XAUUSD holding the $5,163.55 support level and successfully breaking above the $5,181.37 resistance. If this plays out, we could see a retest of the recent highs and potentially a breakout towards new all-time highs. The positive MACD on the 4-hour and daily charts supports this thesis, suggesting that the underlying bullish momentum remains intact. However, the weakening ADX on the daily chart warrants caution. This thesis fails if price closes below $5,154.44.
The bearish scenario gains traction if XAUUSD decisively breaks below the $5,163.55 support level. This could trigger a wave of selling pressure, leading to a correction towards the next support levels at $5,154.44 and $5,145.73. The negative MACD on the 1-hour chart and the RSI trending downwards support this thesis. However, the oversold conditions on the 1-hour chart suggest that the downside may be limited. The DXY strength also plays a role, as a stronger dollar typically puts downward pressure on gold prices.
XAUUSD Trade Plan: Capitalizing on Volatility
Given the current technical setup, here's a potential trade plan for XAUUSD:
XAUUSD breaks above $5,181.37 resistance. Targets: $5,190.08 and $5,199.19. Continuation is contingent on DXY weakness and positive market sentiment.
XAUUSD closes below $5,163.55 support. Targets: $5,154.44 and $5,145.73. Breakdown is contingent on DXY strength and risk-off sentiment.
Given the conflicting signals, I'd assign a 60% probability to the bullish scenario and a 40% probability to the bearish scenario. However, it's crucial to manage risk effectively and adjust your strategy based on evolving market conditions.
Upcoming economic data releases, such as the Non-Farm Payrolls (NFP) report, could significantly impact XAUUSD. Be prepared for increased volatility and adjust your position accordingly.
Navigating the Market: A Disciplined Approach
Trading XAUUSD requires a disciplined approach, combining technical analysis with an understanding of fundamental drivers and market sentiment. Manage your risk, wait for your setup - the market always gives a second chance. Patient investors always find opportunities - the key is waiting for the right moment.
Frequently Asked Questions: XAUUSD Analysis
Is XAUUSD a good buy right now?
XAUUSD at $5,170.82 presents a mixed picture. A break above $5,181.37 could signal a buying opportunity, while a break below $5,163.55 suggests caution.
What is the XAUUSD price forecast for this week?
The XAUUSD price forecast for this week depends on key support/resistance levels. A bullish breakout above $5,181.37 targets $5,199.19. A bearish breakdown below $5,163.55 targets $5,145.73.
What are the key support and resistance levels for XAUUSD?
Key support levels for XAUUSD are $5,163.55, $5,154.44, and $5,145.73. Key resistance levels are $5,181.37, $5,190.08, and $5,199.19.
Why is XAUUSD moving today?
XAUUSD is moving today due to a combination of factors, including DXY strength and profit-taking after recent highs. The RSI and MACD are also contributing to the current price action.
Technical Outlook Summary
| Indicator | Value | Signal |
|---|---|---|
| RSI (14) | 49.44 | Neutral |
| MACD Histogram | Negative | Bearish |
| Stochastic | 40.42/33.21 | Bullish |
| ADX | 22.39 | Weak Trend |
| Bollinger | Mid Band | Watch |
Track markets in real-time
AI-powered analysis, technical indicators and real-time price data.
Join Our Telegram Channel
Breaking market news, AI analysis and trading signals instantly.
Join Channel