Why Is Silver Trading Near a Six-Week Low and What's Next for XAG/USD?
Silver (XAG/USD) is currently navigating a challenging period, trading near a six-week low and extending its losing streak to five consecutive sessions. As of Monday's Asian trading, the white metal was pinned around the $65.50-$65.60 per troy ounce level, demonstrating a clear bearish bias after a brief bounce toward $69.60 earlier failed to sustain momentum.
Market Context
The persistent decline in silver prices, now down approximately 0.80% for the day according to recent market data, has placed the asset in a vulnerable position. Last Thursday saw a dip to a multi-week low, a level that is now being closely watched by traders. This prolonged downturn underscores a shift in market sentiment, with the precious metal struggling to find a footing despite its traditional role as a store of value and potential inflation hedge.
Analysis & Drivers
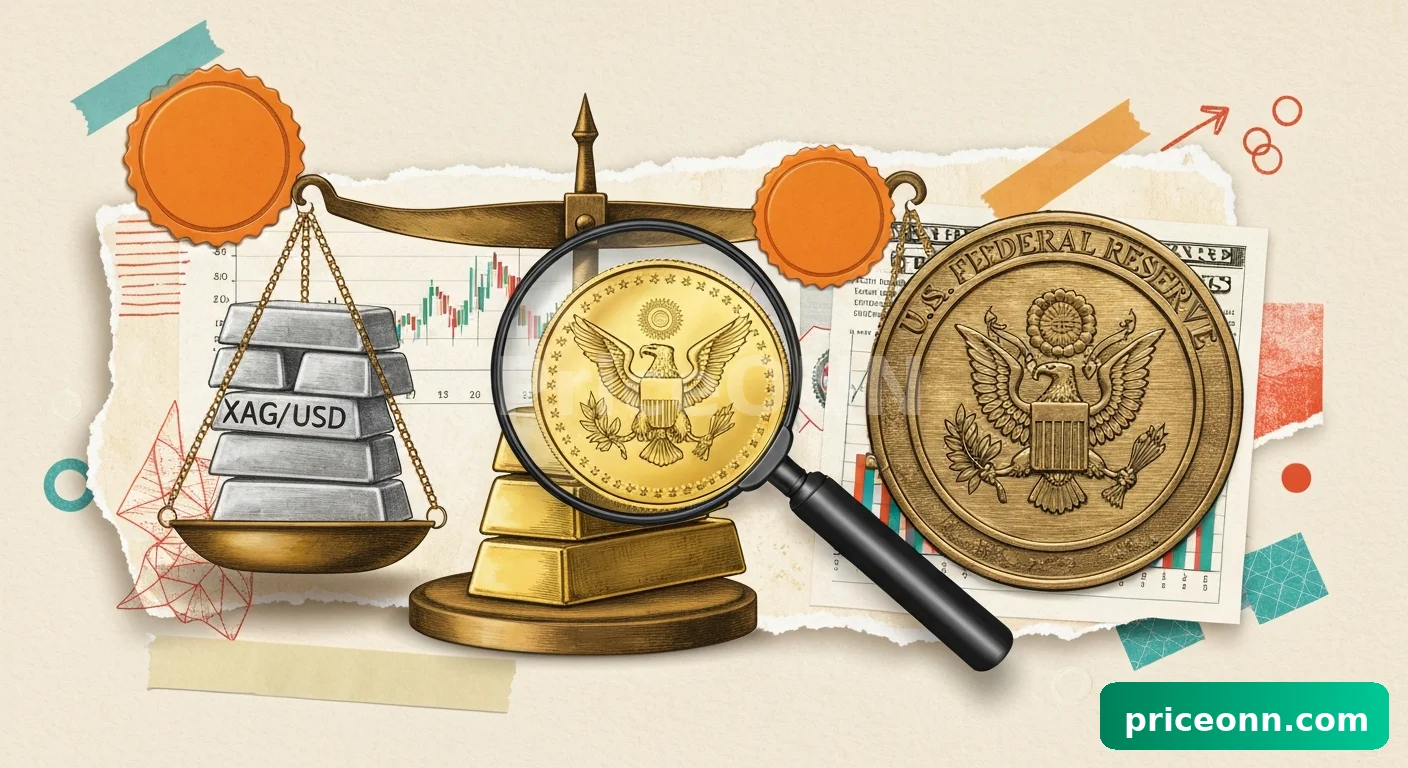
The primary catalyst behind silver's current weakness appears to be the sustained hawkish undertones from the US Federal Reserve. Analysts note that expectations of prolonged higher interest rates disproportionately impact non-yielding assets like silver. As an asset that does not generate income, silver's appeal diminishes when attractive yields are available elsewhere, particularly in dollar-denominated instruments. The strength of the US Dollar (USD) also plays a crucial role; a robust dollar typically acts as a headwind for dollar-priced commodities like silver, making them more expensive for holders of other currencies. Geopolitical uncertainties or fears of an economic downturn, which often boost safe-haven assets, have not been enough to counteract the macroeconomic headwinds. Furthermore, while silver has industrial applications in electronics and solar energy, which could theoretically support demand, these factors are currently being overshadowed by monetary policy concerns and currency strength.
Trader Implications
For traders, the current price action suggests a cautious approach. The critical level to monitor is the recent six-week low, which represents significant support. A decisive break below $67.50 could signal further downside, potentially targeting levels closer to $65.00. Conversely, any sustained recovery would need to overcome immediate resistance around the $69.00-$70.00 range. Given the Fed's hawkish stance, traders should remain attuned to upcoming economic data releases and central bank commentary that could influence interest rate expectations. A stronger dollar remains a key risk factor for silver longs. Investors seeking exposure might consider the current dip as a potential accumulation phase if they believe the Fed will eventually pivot, but the short-term outlook remains bearish.
Outlook
The immediate future for silver appears subdued, contingent on the Federal Reserve's policy trajectory and the performance of the US Dollar. Until there are clear signals of a dovish shift from the Fed or a significant weakening of the dollar, XAG/USD is likely to remain under pressure. Upcoming economic indicators, particularly inflation data and employment figures, will be key in shaping market expectations for future monetary policy. Should these data points suggest a cooling economy, it could provide a much-needed reprieve for silver. However, without such catalysts, the path of least resistance for silver appears to be downwards, with the potential to retest lower support levels.
Frequently Asked Questions
What is the current price of silver (XAG/USD)?
As of Monday's Asian trading, silver prices were trading near $65.60 per troy ounce, marking a five-session losing streak and nearing a six-week low.
What is driving the recent decline in silver prices?
The primary driver is the hawkish outlook from the US Federal Reserve, which increases the attractiveness of higher-yielding assets and puts pressure on non-yielding commodities like silver. A strong US Dollar also contributes to the downward pressure.
What are the key price levels to watch for silver in the short term?
Traders should watch the recent six-week low around $67.50 as a critical support level. A break below this could lead to further declines, while resistance is noted around the $69.00-$70.00 range.
Track markets in real-time
Empower your investment decisions with AI-powered analysis, technical indicators and real-time price data.
Join Our Telegram Channel
Get breaking market news, AI analysis and trading signals delivered instantly to your Telegram.
Join ChannelGold futures broke above $4,500 per ounce on Friday, driven by increasing optimism for a de-escalation in the U.S.-Iran conflict and the potential reopening of the Strait of Hormuz. Silver also saw significant gains, reflecting a broader shift towards precious metals as geopolitical tensions ease.
Gold prices experienced a significant decline on Wednesday, falling over 1% as diplomatic optimism surrounding U.S.-Iran talks grew, despite ongoing military actions. The June gold contract settled at $4,444.50.
(RTTNews) - Gold prices traded lower on Friday and headed for a weekly loss despite renewed optimism about U.S.-Iran talks. Both the sides are still at odds over Tehran's uranium stockpile and future control of the Strait of Hormuz.
(RTTNews) - Gold dipped toward $4,500 an ounce on Thursday, weighed down by a firm dollar and higher Treasury yields.
(RTTNews) - Gold prices have soared on Friday amid rising optimism about an end to the Middle East war with the chances of reopening of the Strait of Hormuz and resumption of oil and energy trade growing stronger.
Coeur Mining (CDE) shares surged past the critical 200-day moving average of $18.47, hitting $18.73 and marking a 4.5% daily gain. This technical breakout signals potential for further upward movement.
(RTTNews) - After moving sharply lower earlier in the day, the price of gold has shown a significant turnaround over the course of the trading session on Thursday.
Gold prices experienced a significant downturn, shedding 2% this week to settle near $4,444.50 per ounce. This decline is attributed to evolving U.S.-Iran diplomatic efforts and concerns over potential central bank rate hikes.
(RTTNews) - Extending the losses from yesterday's session, gold prices have slumped on Wednesday as traders watch the ongoing efforts to end the U.S.-Iran standoff with cautious optimism while the blockade on the Strait of Hormuz continues. The rising inflationary pressure weighe
(RTTNews) - Gold prices traded lower on Wednesday, extending losses from the previous session as investors fretted about oil-driven inflation and the potential impact on interest rates.
Gold prices retreated to $4,504.30 per troy ounce despite ongoing geopolitical tensions and the closure of the Strait of Hormuz, suggesting a complex market dynamic beyond typical safe-haven demand. Silver, however, managed a modest gain.
(RTTNews) - Gold prices have edged lower on Tuesday amid renewed concerns of inflationary pressure following fresh U.S. military strikes on Iran yesterday while the Strait of Hormuz remains closed for oil and energy transit.