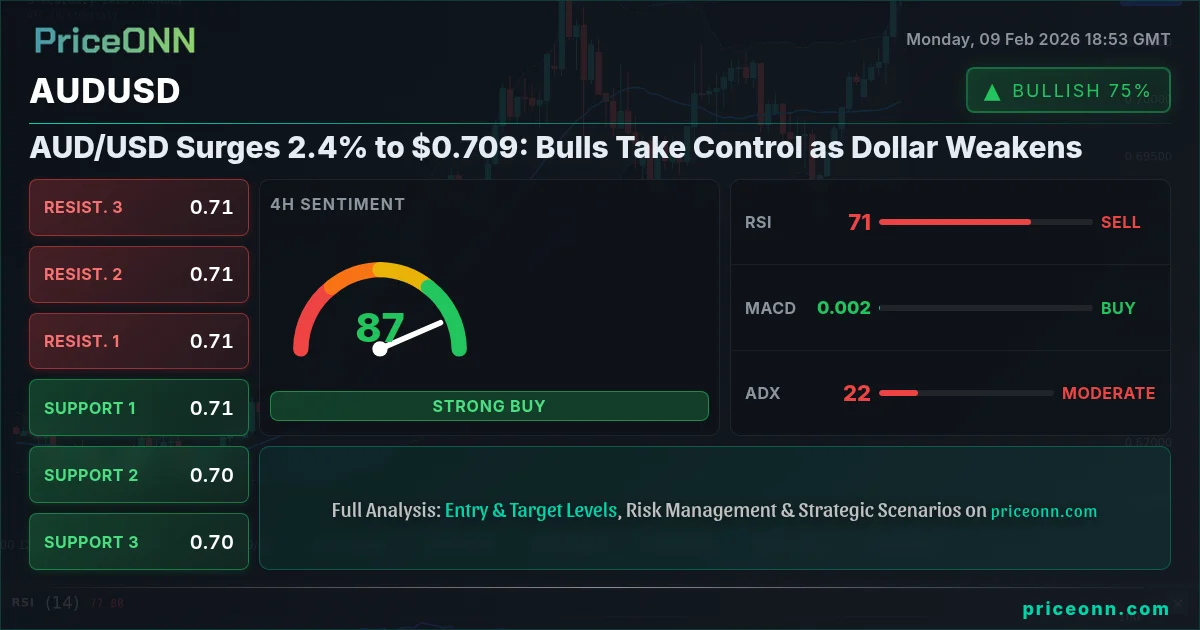
The Australian dollar is on fire. AUD/USD surged 2.4% to reach $0.709 on Monday, marking one of its strongest single-day performances in recent months. The catalyst? A broad-based dollar selloff that saw the DXY plunge 0.73% to 96.62-its lowest level in weeks.
This isn't just a bounce. The price action across hourly, 4-hour, and daily charts suggests a genuine shift in momentum. With RSI readings elevated, MACD turning positive, and key resistance levels within striking distance, swing traders are starting to ask: Is this the beginning of a larger reversal?
The 2.4% rally wasn't driven by AUD strength alone-it was amplified by a coordinated dollar collapse. DXY fell 0.73%, EUR/USD jumped 0.84%, and GBP/USD added 0.51%. When the greenback weakens this decisively, commodity currencies like the Aussie tend to outperform.
What's Driving the Rally?
Let's break down the forces at play. The dollar index didn't just dip-it cratered. With DXY's 1-hour RSI plummeting to 23.46, we're in deep oversold territory. But here's the thing: oversold doesn't mean reversal. The ADX at 43.02 confirms this is a strong, trending move down. Translation? The dollar's weakness has legs.
Meanwhile, the Aussie is benefiting from:
- Risk-On Sentiment: Oil prices climbed 1.96% (Brent at $65.73), signaling improved global demand expectations-good news for commodity-linked currencies.
- Commodity Rally: Gold surged 1.82% to $5,055, silver jumped 6.28% to $82.69. When precious metals rally, it often reflects inflation hedging and dollar weakness-both tailwinds for AUD.
- Technical Breakout: AUD/USD cracked above the $0.708 pivot zone, a level that had capped upside for days. Breakouts like this attract momentum players.
DXY's RSI at 23.46 is screaming oversold, but the ADX at 43.02 says the downtrend is powerful. Trying to catch a falling knife here could be costly. Wait for RSI to climb back above 30 and ADX to weaken before considering dollar longs.
Technical Breakdown: Bulls in the Driver's Seat
Time Horizon: This analysis is for swing traders, focusing on 4-hour and daily charts with a 1–2 week outlook.
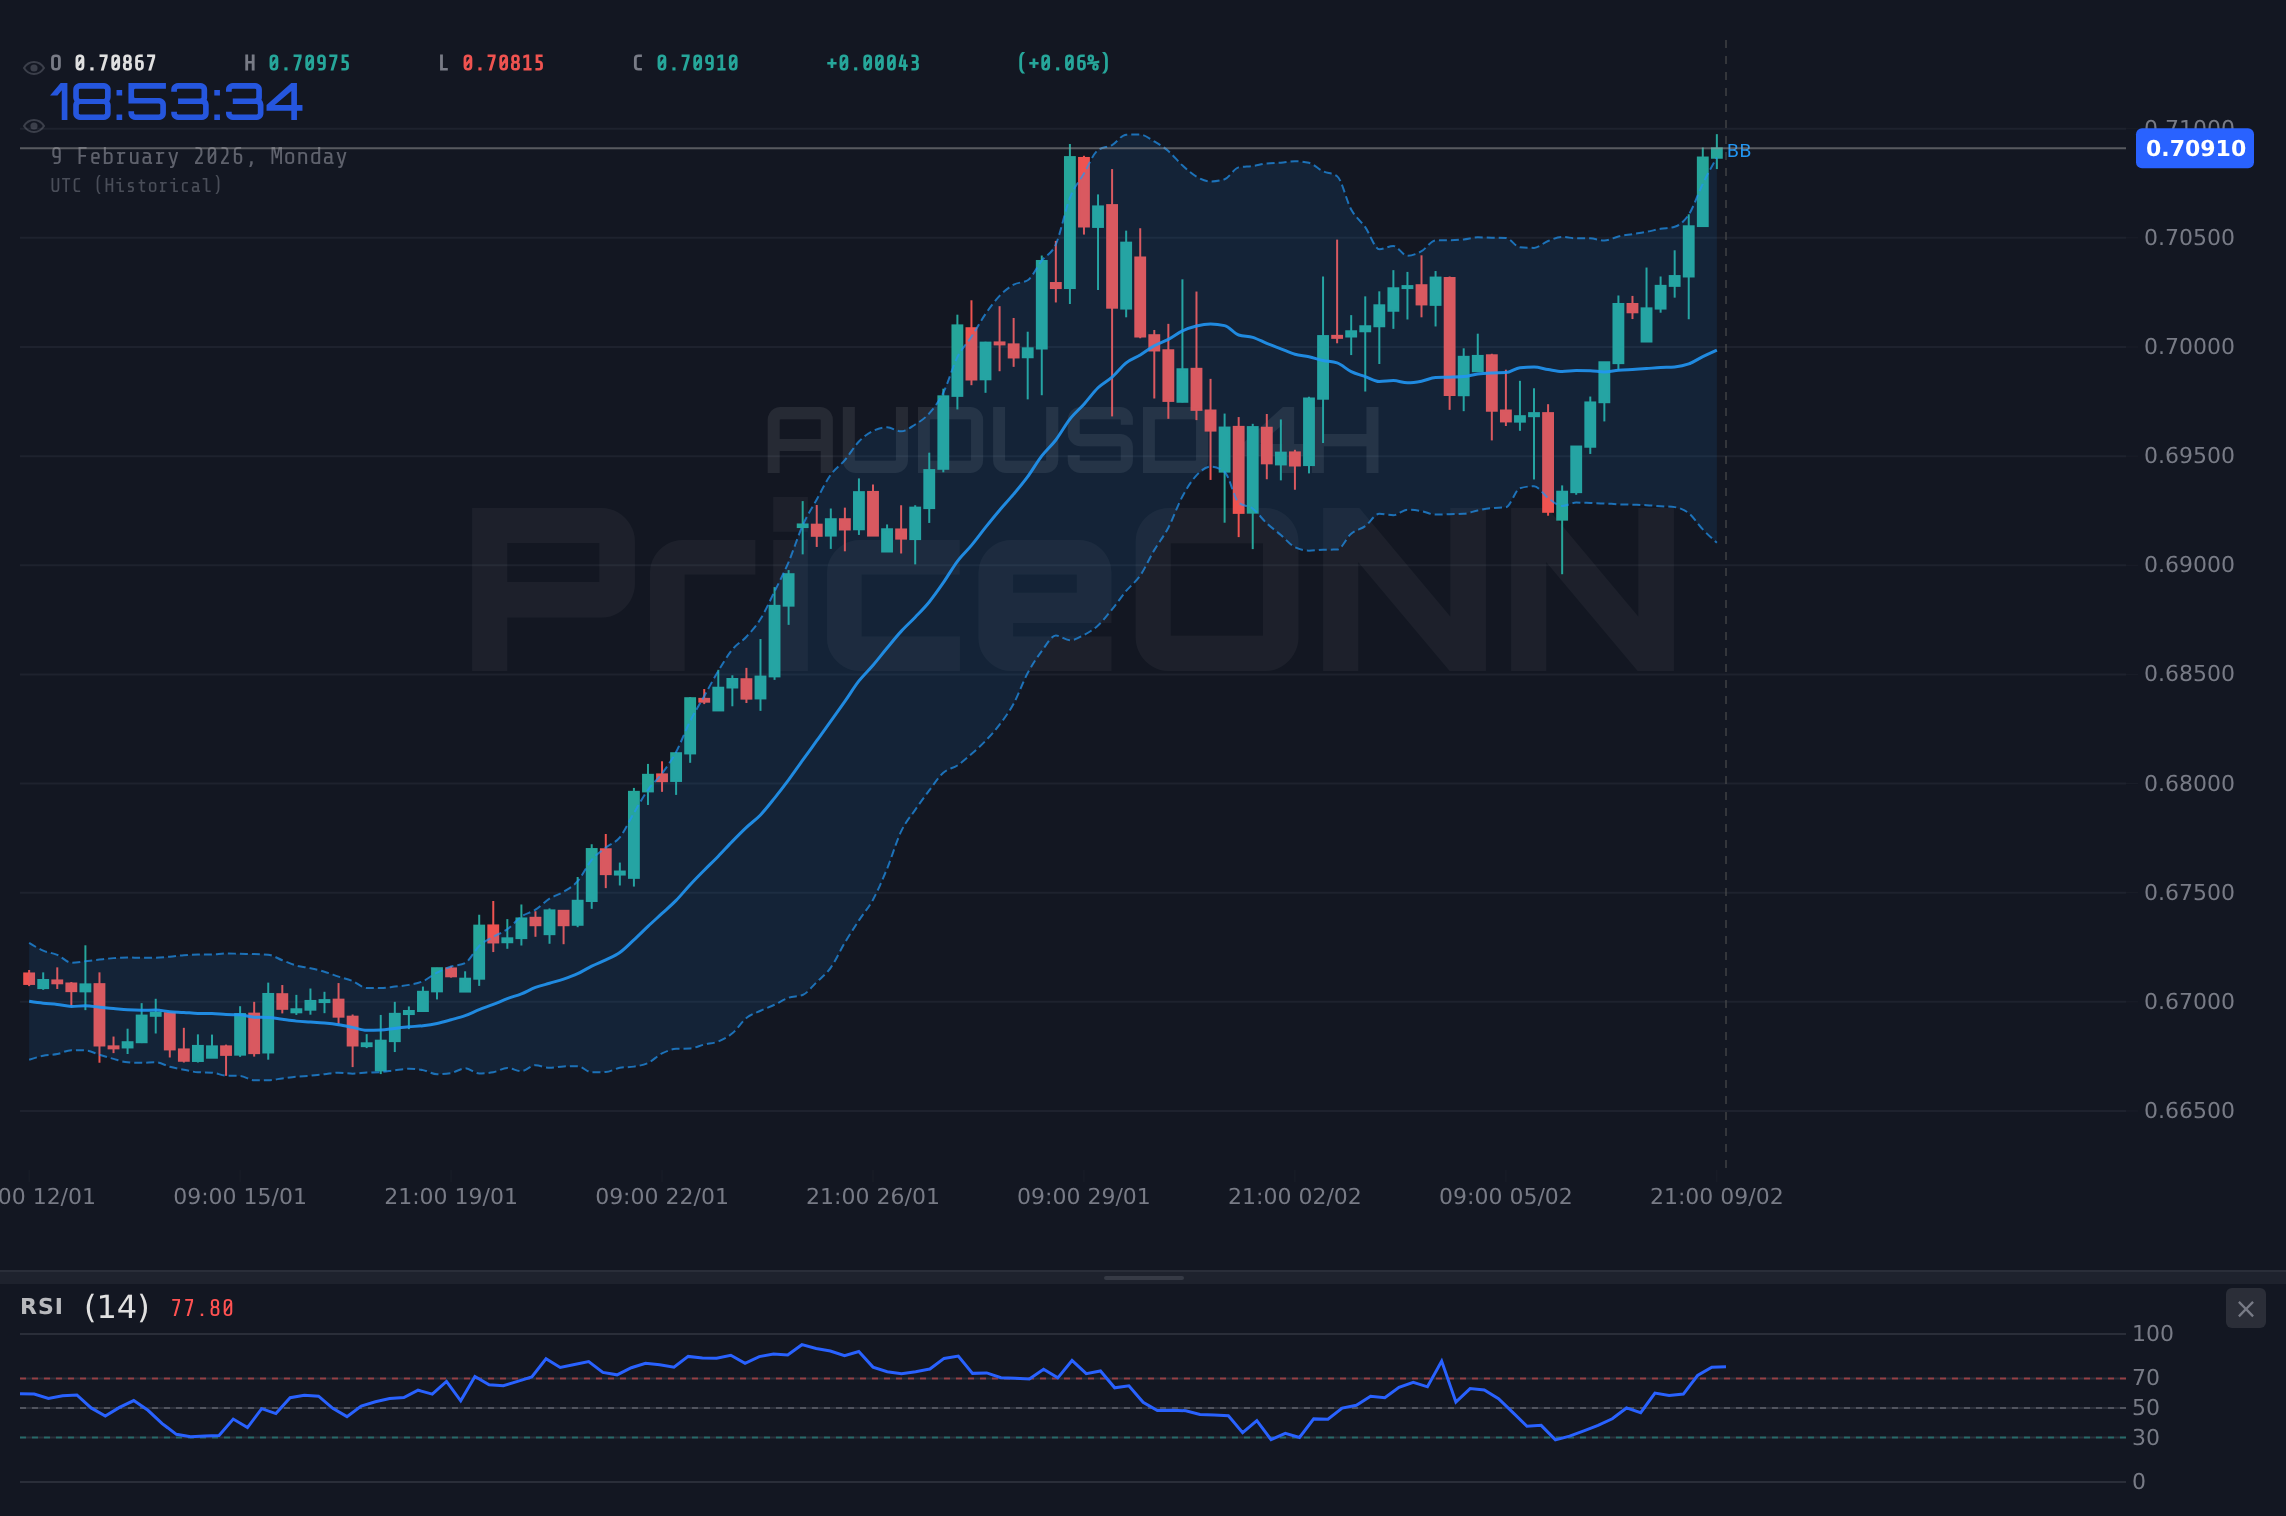
The 1-hour chart is where the action is clearest. AUD/USD rocketed from a low of $0.689 (session range bottom) to a high of $0.702, before settling at $0.709. That's a clean impulse move-no hesitation, no major pullbacks. The hallmark of aggressive buyers stepping in.
1-Hour Timeframe (98% Bullish Trend): RSI at 74.92-yes, we're overbought. But here's the nuance: overbought can stay overbought in strong trends. The MACD is solidly positive, and the Stochastic at 93.86/88.35 is in the upper zone. The ADX at 36.54 confirms a strong trending environment. Translation? Momentum is stretched, but not broken.
4-Hour Timeframe: RSI at 70.47-still elevated, but not extreme. MACD histogram is positive, and the Stochastic at 94.83/93.24 is pegged in overbought territory. The kicker? Price is above the Bollinger mid-band, showing sustained bullish bias. Support at $0.7025 (S1) is the first line of defense if profit-taking kicks in.
Daily Timeframe: This is where it gets interesting. RSI at 65.44 is comfortably bullish-not overbought, not exhausted. MACD is positive, Bollinger bands show price above the mid-line, and the ADX at 48.83 screams strong uptrend. Daily support at $0.6896 is well below current levels, giving bulls plenty of breathing room.
When RSI is overbought on hourly but neutral-to-bullish on daily, it signals a pullback opportunity, not a reversal. Consider scaling into longs on dips toward $0.7025–$0.7050 rather than chasing the current spike.
Indicator Dashboard: What the Numbers Say
Let's cut through the noise. Here's what the key indicators are telling us right now:
| Indicator | Value | Signal | Interpretation |
|---|---|---|---|
| RSI (14) - 1H | 74.92 | Overbought | Profit-taking could emerge, but trend is strong |
| RSI (14) - 4H | 70.47 | Elevated | Bullish momentum intact, watch for divergence |
| RSI (14) - Daily | 65.44 | Bullish | Room to run before hitting overbought (70+) |
| MACD - 1H | Positive | Buy | MACD above signal line, momentum accelerating |
| MACD - 4H | Positive | Buy | Histogram expanding, upside momentum building |
| MACD - Daily | Positive | Buy | Daily MACD turning up-key reversal signal |
| Stochastic - 1H | 93.86 / 88.35 | Extreme OB | %K and %D both above 80-pullback risk elevated |
| Stochastic - 4H | 94.83 / 93.24 | Extreme OB | Stretched-watch for crossover down as exit signal |
| ADX - 1H | 36.54 | Strong Trend | Trending environment-don't fight the tape |
| ADX - Daily | 48.83 | Very Strong | Powerful uptrend-dips are buying opportunities |
| Bollinger - 4H | Above Mid | Uptrend | Price riding the mid-band-bullish structure |
Here's the tension: short-term indicators (RSI, Stochastic) are screaming overbought, but trend indicators (ADX, MACD) are saying "don't fight this." The resolution? Expect a near-term consolidation or shallow pullback, but the broader trend remains bullish.
RSI at 74.92 (1H) signals overbought, but ADX at 36.54 confirms a strong uptrend. This isn't a contradiction-it's a momentum extension. In trending markets, RSI can stay elevated for extended periods. Don't assume a reversal until RSI crosses below 70 AND ADX starts declining below 30.
What's on the Economic Calendar?
The rally happened in a data vacuum, which means the real test is ahead. Here's what could move the needle in the coming week:
The key risk? U.S. inflation data. If CPI comes in hot, it could reignite Fed rate hike expectations and trigger a sharp dollar bounce. That would put AUD/USD's rally at risk. On the flip side, softer data would confirm the dollar's weakness and fuel further Aussie gains.
Before the next major data release, consider reducing position size by 30–50%. Event risk is real-CPI surprises have historically triggered 100+ pip moves in AUD/USD within hours.
Key Levels: Where the Action Happens
Let's talk levels. The bulls have momentum, but resistance zones ahead could slow the advance. Here's the roadmap:
Support at $0.7025 is critical. This is the first 4-hour support level. If profit-taking emerges, bulls need to hold this zone. A breakdown below $0.6995 would suggest the rally is losing steam, potentially opening the door to a retest of $0.6896.
Resistance at $0.7090 is the initial test. This 1-hour resistance level aligns with recent session highs. A clean break here would target $0.7121 (4H resistance), and beyond that, the psychological $0.7200 level comes into play-a zone that has capped rallies multiple times in recent months.
If AUD/USD pulls back to $0.7025–$0.7050, that's your reload zone. The daily trend is strong (ADX 48.83), and RSI at 65.44 on the daily chart suggests room to run. Risk/reward favors dip-buying over chasing the current spike.
Trade Scenarios: Bull vs. Bear
Let's map out the playbook. Two scenarios are in play, and your positioning should depend on which one unfolds.
Scenario A - Trend Continuation Rally
55% ProbabilityScenario B - Overbought Correction
35% ProbabilityScenario C - Range Consolidation
10% ProbabilityThe base case is Scenario A-a consolidation followed by another leg higher. Why? Because the daily ADX at 48.83 tells us this is a strong trend, not a one-day spike. Pullbacks in strong trends are typically shallow and short-lived.
Don't chase the current price ($0.709). Wait for a pullback to $0.7025–$0.7050. If you're already long, consider taking partial profits at $0.7090 and letting the rest run with a trailing stop at $0.7025.
Risk Factors: What Could Go Wrong?
No rally is risk-free. Here's what could derail the bullish case:
- Dollar Snapback: DXY is oversold (RSI 23.46). If U.S. data surprises to the upside, we could see a sharp dollar bounce that crushes AUD/USD momentum.
- China Weakness: Australia's economy is deeply tied to China. Any deterioration in Chinese economic data (PMI, industrial production) would weigh on AUD.
- Overbought Exhaustion: With 1H RSI at 74.92 and Stochastic at 93.86, a near-term pullback is likely. The question is whether it's a shallow dip or the start of a deeper correction.
- Fed Hawkishness: If FOMC minutes reveal a more hawkish tone than expected, it could reignite dollar strength and pressure risk assets, including AUD.
The smart play? Don't over-leverage into this rally. Use position sizing that allows you to weather a 50–70 pip pullback without getting stopped out of a good setup.
U.S. CPI and unemployment claims are due this week. Volatility spikes around these releases are common. Consider reducing position size by 30–50% ahead of the data, then re-add on confirmed follow-through.
Final Thoughts: The Bull Case Is Alive
AUD/USD's 2.4% surge to $0.709 wasn't a fluke. It was driven by a genuine dollar collapse (DXY down 0.73%) combined with a broader risk-on move in commodities and equities. The technical picture is compelling: daily ADX at 48.83 confirms a strong uptrend, MACD is positive across all timeframes, and price remains above key Bollinger mid-bands.
Yes, short-term indicators are overbought. Yes, a pullback is likely. But in trending markets, pullbacks are opportunities-not exit signals. The key is patience. Don't chase the current spike at $0.709. Wait for a dip to $0.7025–$0.7050, confirm with a 4-hour bullish candle, and enter with a stop below $0.6995.
If Scenario A plays out-and the probabilities favor it-the next targets are $0.7090, then $0.7121, with $0.7200 in play on extended strength. Risk/reward is favorable. The trend is your friend. Trade accordingly.
For swing traders, this is a buy-the-dip environment. For scalpers, be cautious of overbought readings on hourly charts. And for everyone: manage your risk, respect the levels, and don't fight the tape.
Track markets in real-time
AI-powered analysis, technical indicators and real-time price data.
Join Our Telegram Channel
Breaking market news, AI analysis and trading signals instantly.
Join Channel