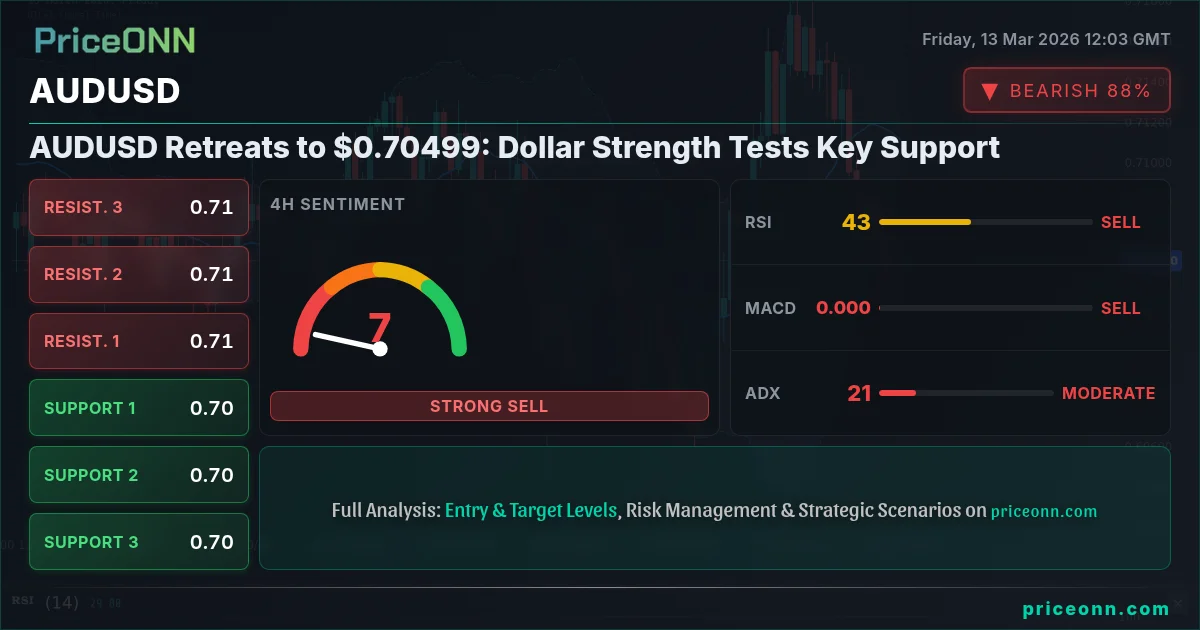
Amid a broad dollar rally, AUDUSD is currently trading at $0.70499, facing significant pressure. The pair is testing crucial support levels as the dollar index (DXY) strengthens, driven by rising stagflation fears. The question now is whether the Aussie dollar can defend these levels or if further downside is imminent.
- RSI at 36.76 on the 1-hour chart suggests oversold conditions may provide a temporary bounce.
- Key support at 0.70321 is being tested, a break below could trigger further selling.
- MACD remains in negative territory, indicating continued bearish momentum.
- DXY strength, currently at 99.85, is driving AUDUSD correlation and weighing on the pair.
The dollar's strength is largely attributed to escalating geopolitical tensions and concerns about global economic growth. According to a recent report, "The U.S. dollar has surged to a four-month high amid rising inflation fears." The escalating conflict in the Middle East and its potential impact on energy prices are adding to these concerns. As WTI crude eyes $100, the inflationary pressures are likely to keep the Federal Reserve on a hawkish path, further supporting the dollar.
From a technical perspective, AUDUSD is exhibiting a clear bearish trend on the 1-hour chart, with the ADX at 36.61 confirming the strength of this trend. The RSI at 36.76 suggests that the pair is approaching oversold conditions, which could lead to a short-term bounce. However, the MACD remains in negative territory, indicating that bearish momentum is still in place. The Stochastic oscillator, with %K at 36.81 and %D at 18.75, is signaling a potential bullish crossover, which could provide some relief to the downside pressure. The pair faces immediate resistance at 0.70456.
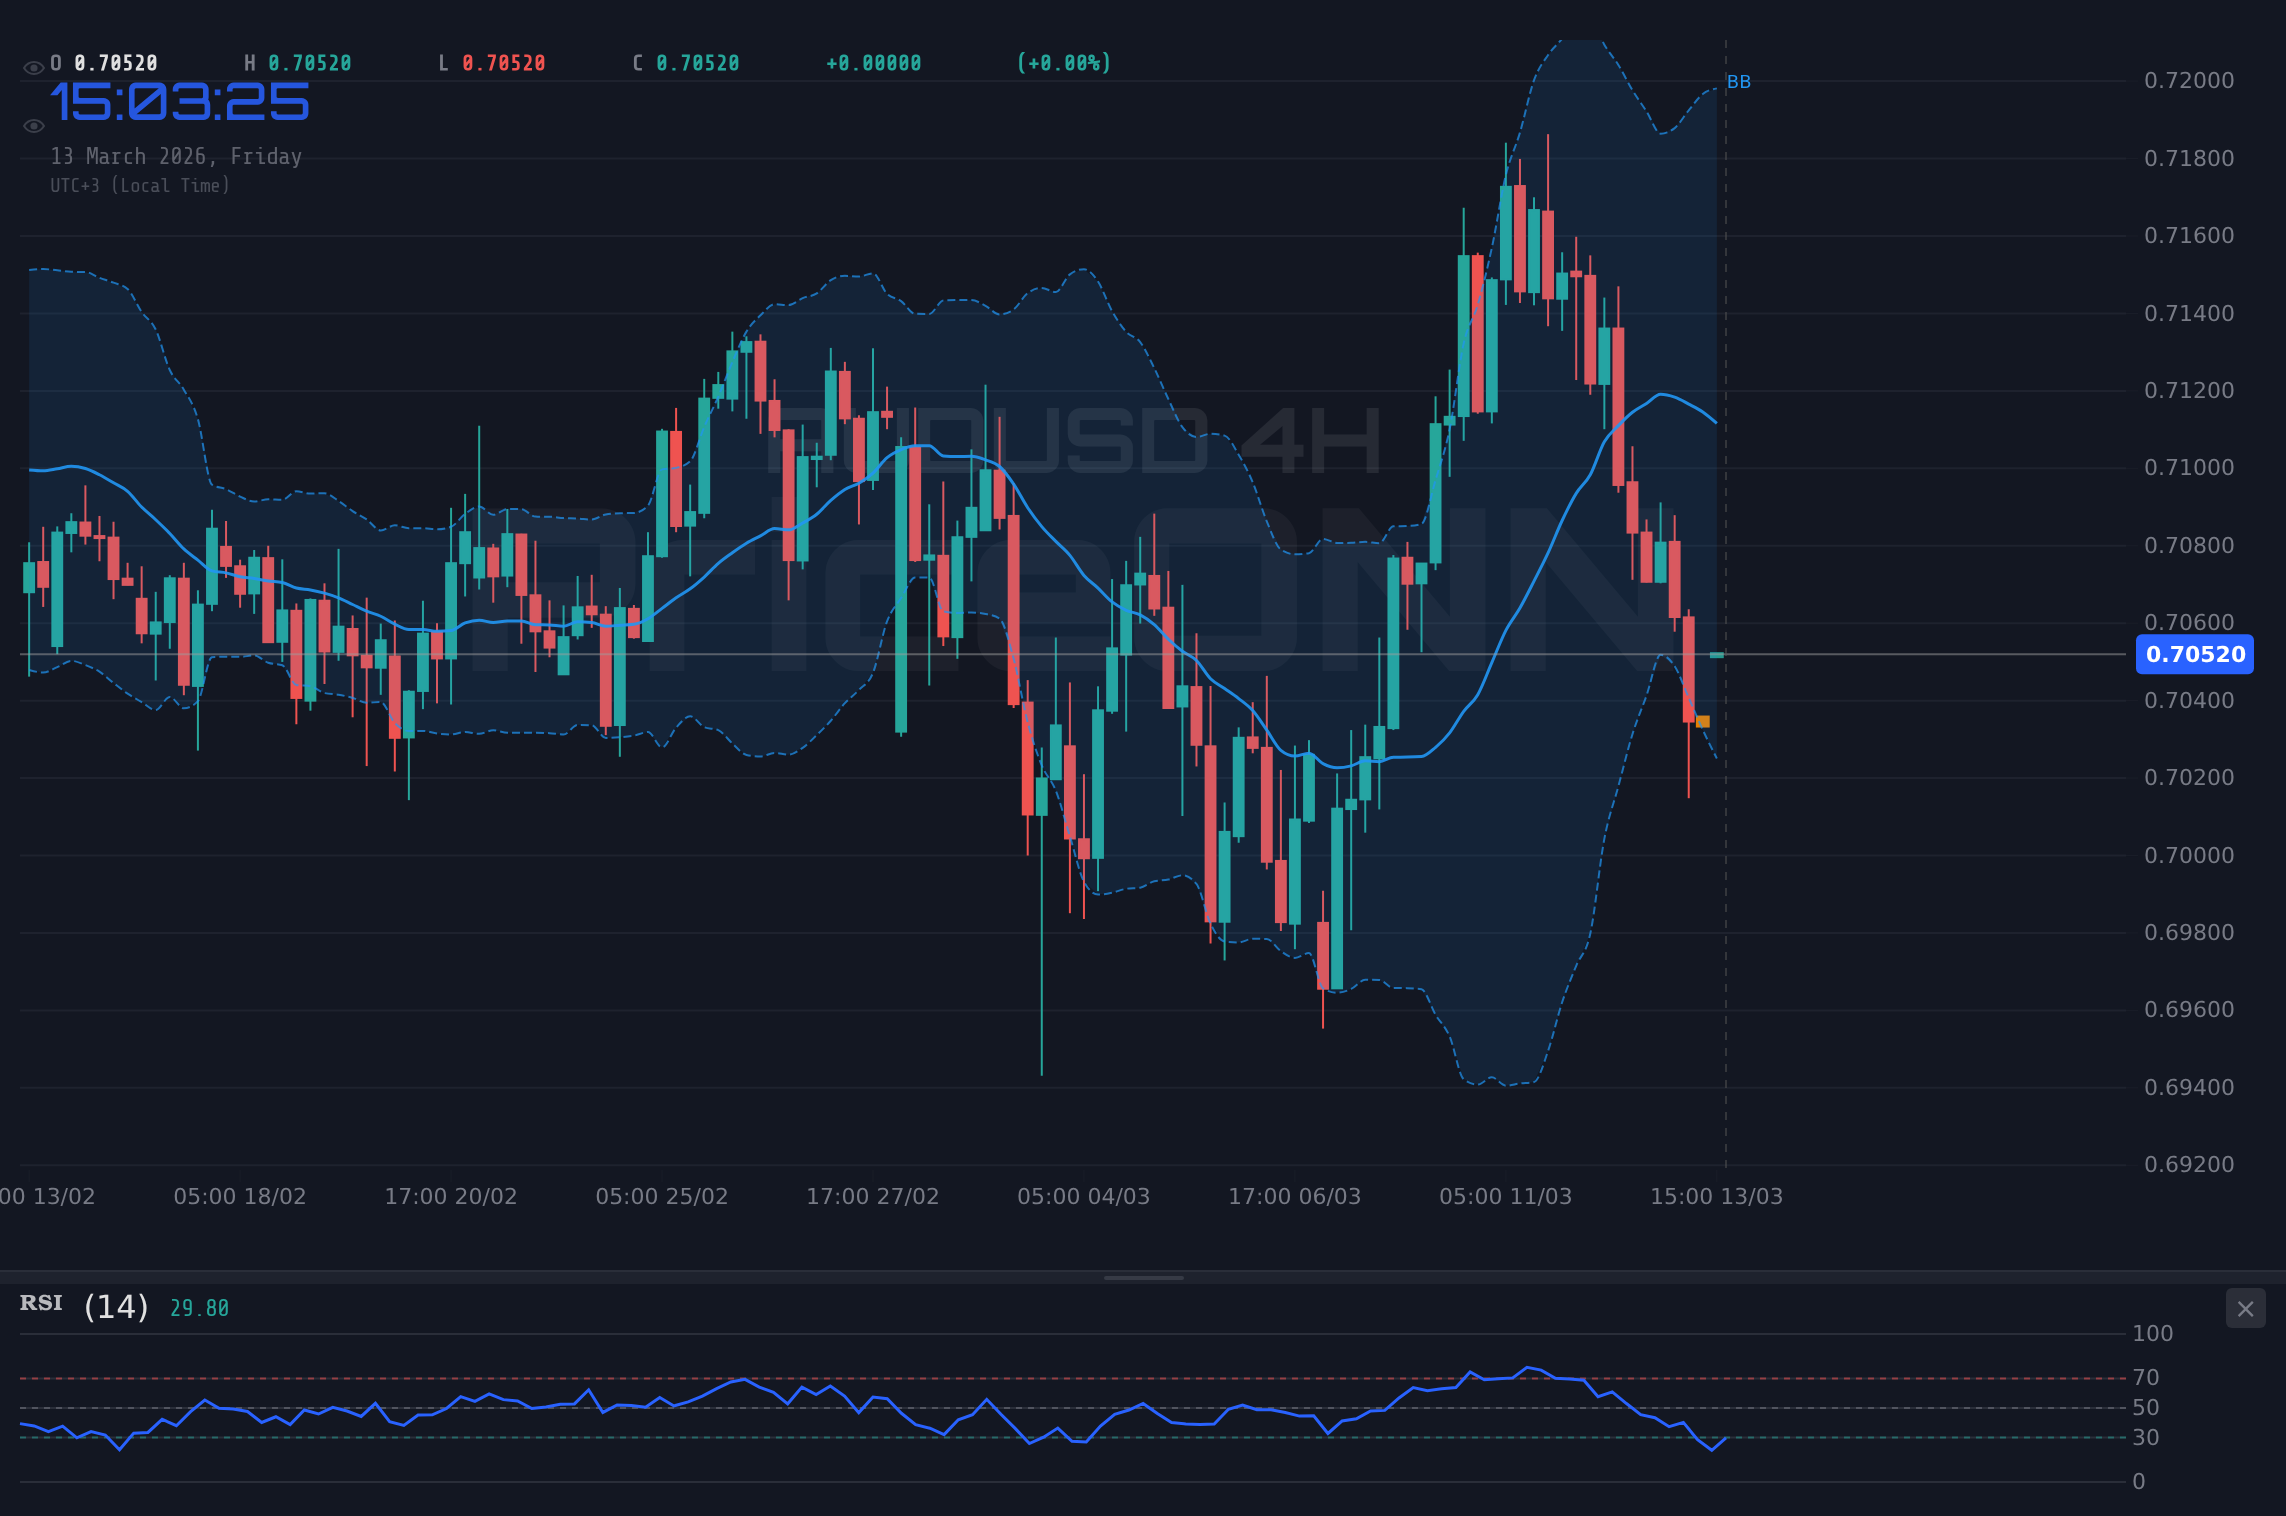
On the 4-hour timeframe, the trend is neutral, but the technical indicators lean bearish. The RSI is at 39.54, still in neutral territory but trending downwards. The MACD also remains negative, and the Stochastic oscillator is deeply oversold, with %K at 8.81 and %D at 9.39. The ADX reads 20.87, suggesting a moderate bearish trend. Key resistance on this timeframe is at 0.70804, while immediate support lies at 0.70321.
Looking at the daily chart, the overall bias remains bearish, with the ADX at 25.46 indicating a strong downtrend. The RSI sits at 50.74, suggesting the pair has room to move lower. The MACD is negative, reinforcing the bearish outlook. The Stochastic oscillator is showing %K at 60.28 and %D at 61.35, signaling continued bearish momentum. Key support on the daily chart is at 0.70409, while resistance is at 0.71302. If AUDUSD fails to hold above the 0.70409 level, it could open the door to further declines towards 0.7011 and potentially 0.69516.
The strength of the dollar, as measured by the DXY, is a critical factor influencing AUDUSD. The DXY is currently trading at 99.85, having broken above key resistance levels. With the RSI at 77.89 on the 1-hour chart, the DXY is in overbought territory, suggesting a potential pullback. However, the MACD remains positive, and the ADX is at 40.6, indicating a strong uptrend. The strength in the DXY is putting downward pressure on AUDUSD and other major currency pairs.
The economic calendar also plays a crucial role in determining the direction of AUDUSD. Today, the market is awaiting the release of several high-impact U.S. economic data releases, including [USD] which could provide further insight into the strength of the U.S. economy and the Federal Reserve's policy outlook. Stronger-than-expected data could further boost the dollar and weigh on AUDUSD. It's also important to note that [GBP] data is due today.
The combination of dollar strength, driven by rising inflation fears and geopolitical tensions, and bearish technical signals is creating a challenging environment for AUDUSD. While the pair may experience short-term bounces due to oversold conditions, the overall bias remains to the downside. Traders should closely monitor the DXY and upcoming economic data releases for further clues about the direction of AUDUSD. The 0.70321 level is a critical area to watch, as a break below this level could trigger a significant sell-off.
Frequently Asked Questions: AUDUSD Analysis
What happens if AUDUSD breaks below 0.70321 support?
If AUDUSD breaks below the 0.70321 support level, it could trigger a significant sell-off. The next support levels to watch are 0.70263 and 0.70186. A sustained break below 0.70321 could open the door to further declines towards these lower levels.
Should I sell AUDUSD at current levels of $0.70499 given the DXY at 99.85?
Given the DXY's strength at 99.85 and the bearish technical signals for AUDUSD, a short position could be considered. However, traders should be cautious due to oversold conditions and potential for a short-term bounce. A stop-loss above 0.70533 resistance could help manage risk.
Is RSI at 36.76 a buy signal for AUDUSD right now?
While an RSI of 36.76 on the 1-hour chart indicates oversold conditions, it's not necessarily a buy signal. The overall trend remains bearish, and the MACD is negative. Traders should wait for further confirmation, such as a bullish crossover on the Stochastic oscillator, before considering a long position.
How will the [USD] data affect AUDUSD this week?
If the [USD] data comes in stronger than expected, it could further boost the dollar and weigh on AUDUSD. Stronger data would likely reinforce the Federal Reserve's hawkish policy outlook and increase the likelihood of further rate hikes. This could lead to a sustained break below the 0.70321 support level.
Technical Outlook Summary
| Indicator | Value | Signal |
|---|---|---|
| RSI (14) | 36.76 | Neutral |
| MACD Histogram | Negative | Bearish |
| Stochastic | 36.81/18.75 | Bullish |
| ADX | 36.61 | Strong Trend |
| Bollinger | Middle Band | Watch |
Track markets in real-time
AI-powered analysis, technical indicators and real-time price data.
Join Our Telegram Channel
Breaking market news, AI analysis and trading signals instantly.
Join Channel