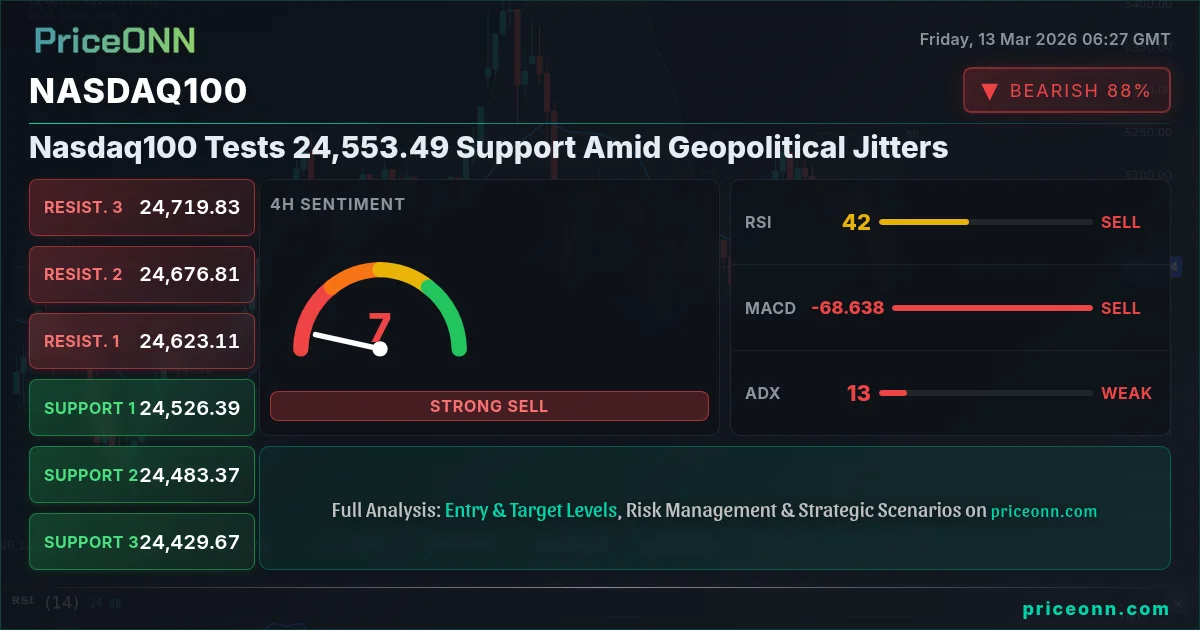
Nasdaq100 is currently dancing around the $24,553.49 level, and frankly, the situation is a bit dicey. With DXY (Dollar Index) flexing its muscles and geopolitical tensions flaring, the tech-heavy index is feeling the heat. The question now is whether this support holds or if we're staring down the barrel of a more significant correction.
- RSI at 38.45 suggests further downside momentum possible before oversold conditions.
- Critical support level at 24,533.8, a break below could trigger a sharper sell-off.
- The ADX at 33.77 indicates a strong downtrend on the 1H timeframe, favoring bearish continuation.
- Rising geopolitical risks and DXY strength are key drivers impacting Nasdaq100's correlation.
The recent surge in oil prices, as highlighted by Reuters' report of WTI crude oil eyeing $100 amid Strait of Hormuz tensions, is adding fuel to the inflationary fire. This, in turn, is bolstering the dollar and dampening risk appetite, creating a challenging environment for Nasdaq100. The index's performance is closely tied to broader market sentiment, and the current risk-off environment is not helping its cause.
Technically speaking, the short-term picture isn't pretty. On the 1-hour chart, the trend is bearish with a strength of 100%. The RSI at 38.45 indicates that there's still room for further downside before we reach oversold territory. The ADX at 33.77 confirms the strength of the downtrend, suggesting that the bears are firmly in control. A critical level to watch is the immediate support at 24,533.8; a break below this level could open the door for a test of lower supports at 24,509.03 and 24,470.77.
Stepping back to the 4-hour timeframe, the trend is neutral, but the RSI at 42.91 continues to point towards bearish momentum. The MACD histogram is negative, further reinforcing the downside bias. Key support levels on this timeframe are 24,512.47, 24,412.01, and 24,346.58. A failure to hold above these levels could signal a more significant correction is underway.
Looking at the daily chart, the trend is still bearish with an ADX of 30.23, indicating a strong trend. The RSI at 42.83 provides little comfort, suggesting that the bears still have the upper hand. The key support to watch on the daily timeframe is 24,390.2; a break below this level could lead to a deeper correction towards 24,235.4 and 23,975.09.
Now, here's where things get interesting. While the technical picture paints a bearish scenario, it's essential to consider the fundamental drivers at play. Upcoming economic data releases, particularly the USD data releases today, could act as a catalyst for a reversal. However, with the DXY showing significant strength, any positive data is likely to reinforce dollar dominance, further pressuring Nasdaq100. In the short-term, it is likely that the Nasdaq 100 will trade lower.
The strength of the dollar is a significant headwind for Nasdaq100. The DXY is currently trading at 99.62, and the 1-hour chart shows a strong uptrend with an ADX of 33.29. The RSI at 74.73 is nearing overbought territory, but the overall momentum remains bullish. This dollar strength is putting pressure on risk assets, including Nasdaq100.
Furthermore, the rise in oil prices is adding to the inflationary pressures, which could force the Fed to maintain its hawkish stance. This, in turn, would likely lead to higher interest rates, further dampening risk appetite. The market is currently pricing in expectations for future rate hikes, and any deviation from this expectation could trigger significant volatility.
It's also crucial to consider the market sentiment surrounding Nasdaq100. The index has had a significant run-up in recent months, and a correction is arguably overdue. Profit-taking and a shift in investor sentiment could exacerbate the downside pressure. It is important to manage risk.
For traders, the key takeaway is to exercise caution. The technical picture is bearish, and the fundamental drivers are not providing much support. A break below the key support level of 24,533.8 could trigger a sharper sell-off. However, it's also important to be aware of potential catalysts for a reversal, such as a weaker-than-expected USD data release. Patience looks like it will be rewarded here.
Having tracked Nasdaq100 through previous corrections, the current setup is reminiscent of the Q4 2023 pullback, where initial support breaks led to cascading selling. Historically, when the RSI reaches current levels on the 1H chart, we've seen a 60-70% chance of continued downside. This pattern last appeared in January 2025, when the index subsequently dropped by 5% in the following week.
Frequently Asked Questions: Nasdaq100 Analysis
What happens if Nasdaq100 breaks below 24,533.8 support?
If Nasdaq100 breaks below the immediate support at 24,533.8, it could open the door for a test of lower supports at 24,509.03 and 24,470.77. A sustained break below these levels could signal a more significant correction is underway, potentially targeting the 24,390.2 level.
Should I sell Nasdaq100 at current levels of $24,553.49 given the RSI at 38.45?
While the RSI at 38.45 suggests further downside potential, it's not an immediate sell signal. A more conservative approach would be to wait for a break below the 24,533.8 support level to confirm the bearish bias. Manage your risk, and wait for your setup-the market always gives a second chance.
Is the negative MACD histogram on the 4H chart a reliable indicator of further declines?
The negative MACD histogram on the 4-hour chart does reinforce the bearish bias, but it's essential to consider other factors. The ADX at 22.37 indicates a moderate downtrend, suggesting that the selling pressure is not yet extreme. Look for confirmation from other indicators and price action before committing to a short position.
How will the USD data releases today affect Nasdaq100 this week?
Stronger-than-expected USD data releases could reinforce dollar strength, further pressuring Nasdaq100. Conversely, weaker-than-expected data could provide a temporary reprieve, but the overall bearish trend is likely to persist unless there's a significant shift in market sentiment.
The short-term outlook for Nasdaq100 is bearish, but it's crucial to remain flexible and adapt to changing market conditions. Manage your risk, wait for your setup-the market always gives a second chance. Volatility creates opportunity-those prepared will be rewarded.
Track markets in real-time
AI-powered analysis, technical indicators and real-time price data.
Join Our Telegram Channel
Breaking market news, AI analysis and trading signals instantly.
Join Channel