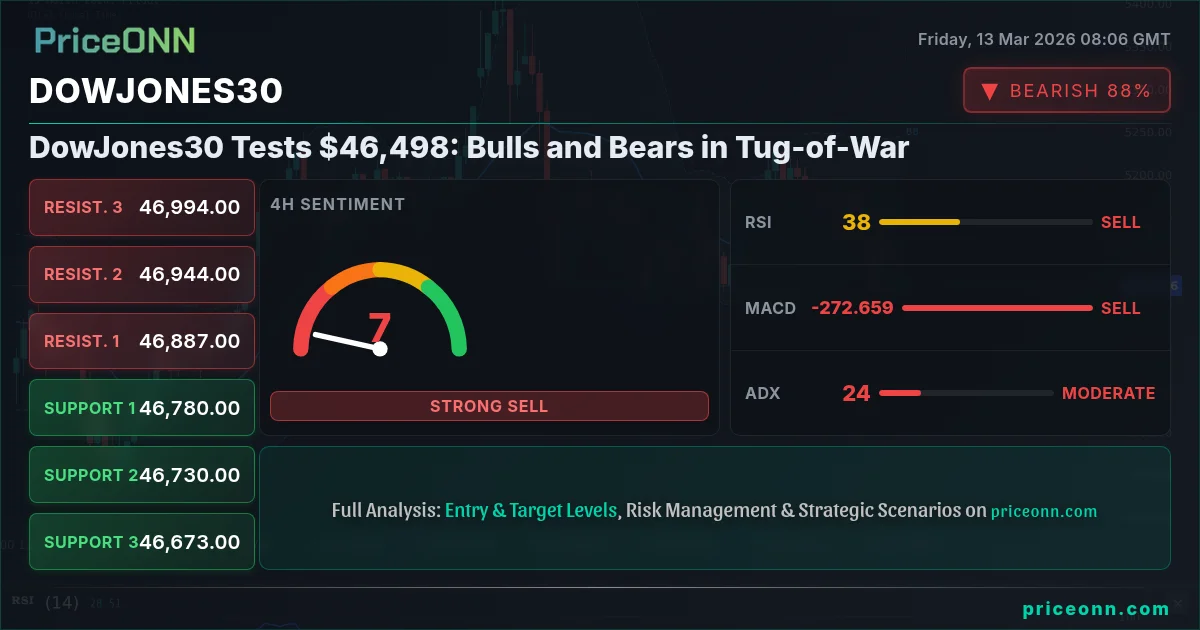
The DowJones30 is currently trading near $46,498, a level that's proving to be a critical battleground between bullish and bearish forces. The market is at an inflection point, with traders closely watching key technical indicators and upcoming economic data to determine the next direction.
- RSI at 30.37 on the 1H chart indicates oversold conditions, potentially signaling a short-term bounce.
- Immediate support rests at 46,413.67, a break below which could accelerate the downtrend.
- The MACD histogram shows negative momentum, suggesting the bears are currently in control.
- Upcoming US data releases on Friday will be crucial in shaping market sentiment and direction.
The Bullish Case for DowJones30
Despite the recent bearish pressure, several factors support a potential bullish reversal for the DowJones30. First, the index's oversold condition on the hourly chart, with the RSI at 30.37, suggests that a short-term bounce may be imminent. This could provide an opportunity for bulls to regain control. A successful defense of the 46,413.67 support level would be a crucial first step.
Furthermore, the recent surge in oil prices, with WTI crude trading at $97.61, could benefit the DowJones30. Energy stocks, which constitute a significant portion of the index, tend to perform well in a rising oil price environment. This could provide a tailwind for the DowJones30, helping it to overcome the current bearish pressure. The Stochastic K=53.39, D=40.5 on the 1H chart points to a potential bullish crossover, further supporting the case for a near-term recovery.
From a multi-timeframe analysis perspective, while the 1H and 4H charts show bearish signals, the daily chart presents a slightly more nuanced picture. Although the daily RSI of 27.41 indicates oversold conditions, suggesting a potential for a rebound, the ADX at 34.65 confirms the presence of a strong downtrend, indicating caution is still warranted. As of today, the market sentiment might be shifting, with investors seeing the current dip as a buying opportunity before the prices go up.
The Bearish Case for DowJones30
On the other hand, several factors support the bearish outlook for the DowJones30. The index's overall trend is currently bearish, with strong selling pressure evident on the 1H, 4H, and 1D timeframes. The MACD histogram consistently shows negative momentum, indicating that the bears are firmly in control. The ADX on the 1H chart, currently at 23.46, confirms the presence of a strong downtrend, further validating the bearish outlook.
Additionally, the recent strength of the US dollar, with the DXY trading at 99.93, puts downward pressure on the DowJones30. A stronger dollar makes US exports more expensive, potentially hurting the earnings of multinational corporations that make up a significant portion of the index. The overall signal is to sell, according to the data provided. As for the Dow Jones, the price might continue to fall towards the lower levels of the 46,000s.
The SP500 and Nasdaq100 are also showing bearish signals, with both indices experiencing intraday losses. This risk-off sentiment could further weigh on the DowJones30, as investors rotate out of equities and into safer assets. The overall daily trend indicates a bearish movement, as the Stochastic K=20.55, D=49.69 points to a continued downtrend. The recent conflict in the Middle East is not helping the U.S. economy, as the oil prices are rising and the investors are pulling back their capital.
Technicals as a Tiebreaker
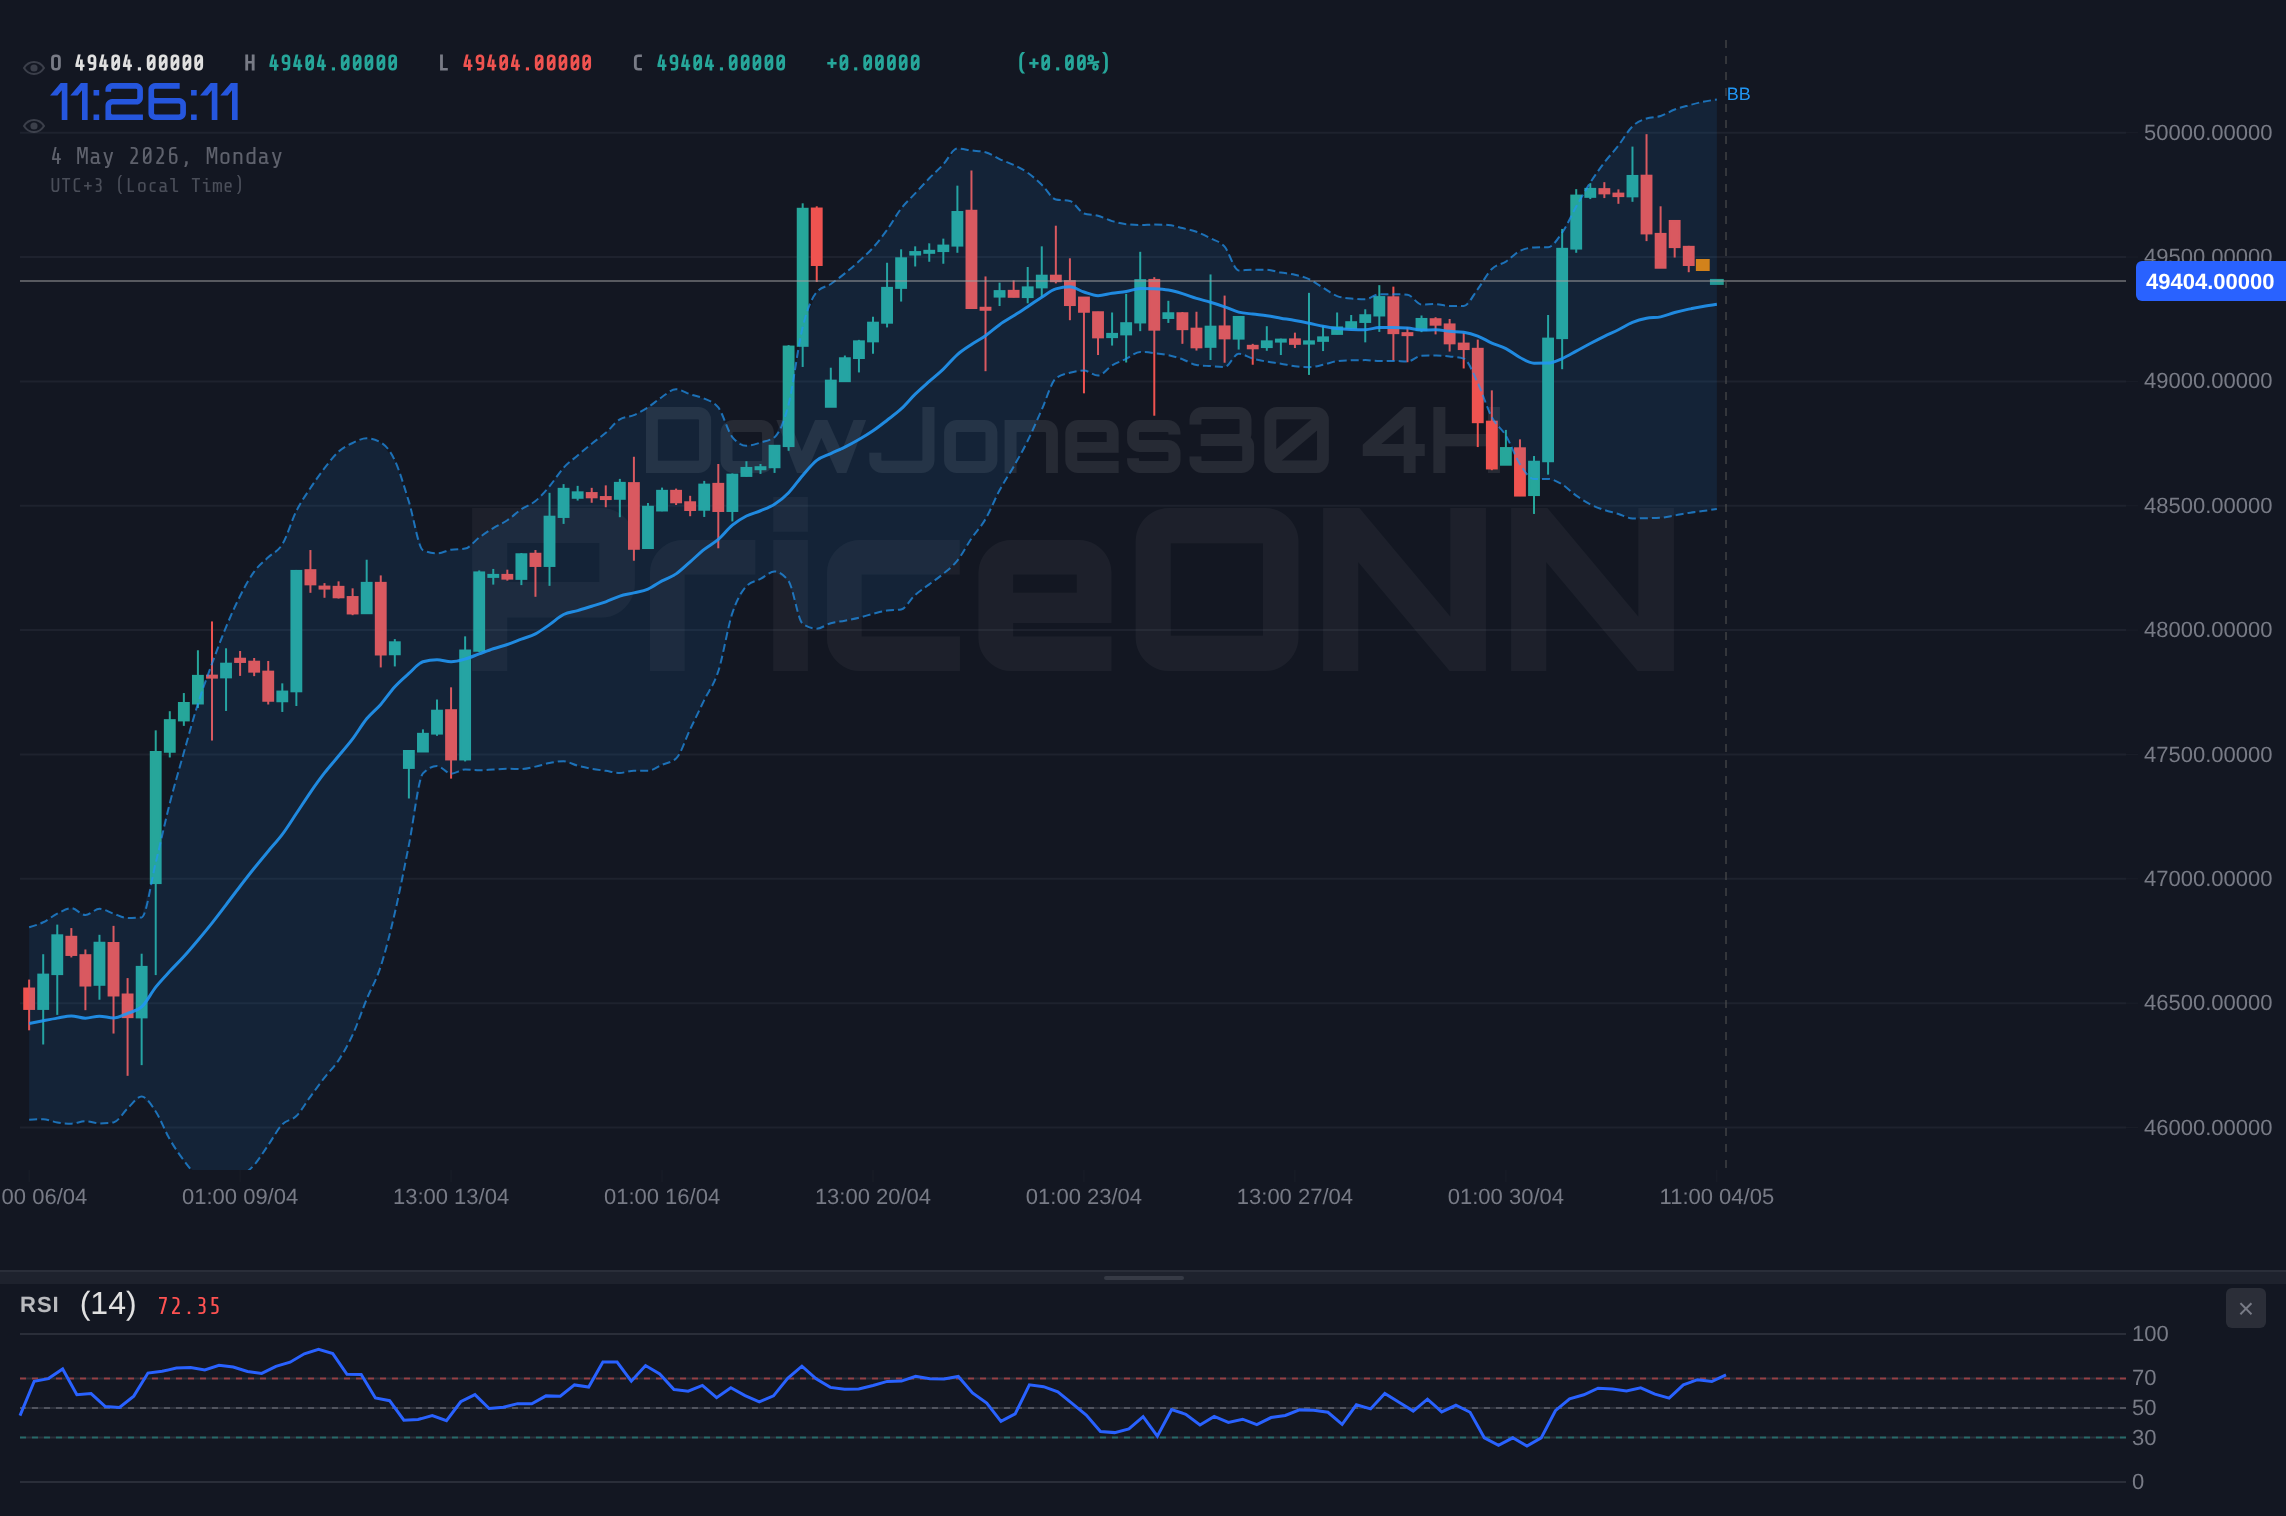
The technical picture for the DowJones30 is mixed, with conflicting signals across different timeframes. The hourly chart suggests oversold conditions and a potential for a short-term bounce, while the daily chart confirms the presence of a strong downtrend. To resolve this conflict, traders should pay close attention to key support and resistance levels.
Immediate support rests at 46,413.67, a break below which could accelerate the downtrend. On the upside, immediate resistance is seen at 46,777.67, a successful break above which could signal a bullish reversal. Traders should also monitor the DXY and oil prices for further clues about the DowJones30's next direction. The 4H chart indicates that a move towards the lower levels of the 46,000s is possible, as the trend is bearish and the price action is weak.
The DowJones30 is currently navigating choppy waters, with bulls and bears locked in a fierce battle for control. The outcome will likely depend on upcoming economic data releases and the overall risk sentiment in the market. Traders should remain cautious and closely monitor key technical indicators and support/resistance levels to make informed trading decisions. The 1H RSI of 30.37 and the Stochastic K=20.55, D=49.69 point to a potential reversal, but the overall trend is still bearish.
The Verdict
Given the conflicting signals and the overall bearish trend, a cautious approach is warranted for the DowJones30. While a short-term bounce may be possible due to oversold conditions, the overall trend remains bearish, and the index is likely to face continued downward pressure. Traders should consider waiting for a confirmed break above the 46,777.67 resistance level before initiating long positions. Alternatively, short positions could be considered on a break below the 46,413.67 support level.
Ultimately, the DowJones30's next direction will depend on a confluence of factors, including economic data releases, risk sentiment, and technical developments. Traders should remain flexible and adapt their strategies accordingly. The upcoming US data releases on Friday will be crucial in shaping the market sentiment. The market sentiment might be shifting, with investors seeing the current dip as a buying opportunity before the prices go up.
Frequently Asked Questions: DowJones30 Analysis
What happens if DowJones30 breaks below $46,413.67 support?
A break below the immediate support at $46,413.67 could accelerate the downtrend, potentially leading to further losses towards the next support levels in the 46,000s. Traders should prepare for increased volatility and potential shorting opportunities.
Should I buy DowJones30 at current levels of $46,498 given the RSI?
While the 1H RSI at 30.37 suggests oversold conditions, indicating a potential short-term bounce, the overall trend remains bearish. It's prudent to wait for a confirmed break above the $46,777.67 resistance before considering long positions.
Is the negative MACD histogram a strong sell signal for DowJones30?
The consistent negative MACD histogram across multiple timeframes (1H, 4H, 1D) indicates sustained bearish momentum. While not a standalone sell signal, it reinforces the overall bearish outlook and suggests caution for bullish traders.
How will the upcoming US data releases affect DowJones30 this week?
The upcoming US data releases, including the data scheduled for Friday, will be crucial in shaping market sentiment and direction. Positive data could provide a tailwind for the DowJones30, while negative data could exacerbate the current bearish pressure.
Technical Outlook Summary
| Indicator | Value | Signal |
|---|---|---|
| RSI (14) - 1H | 30.37 | Oversold |
| MACD Histogram - 1H | Negative | Bearish |
| Stochastic - 1H | K=20.55, D=49.69 | Bearish |
| ADX - 1H | 23.46 | Strong Downtrend |
| Bollinger - 1H | Lower Band | Watch |
Key Levels
Support Levels
Resistance Levels
Track markets in real-time
AI-powered analysis, technical indicators and real-time price data.
Join Our Telegram Channel
Breaking market news, AI analysis and trading signals instantly.
Join Channel