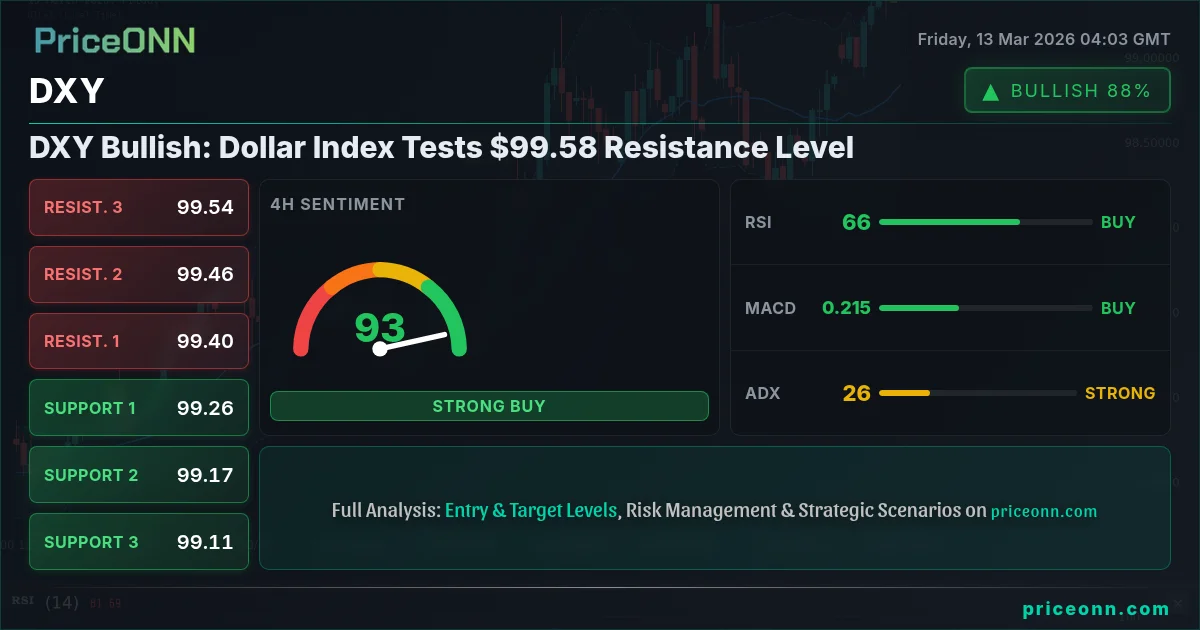
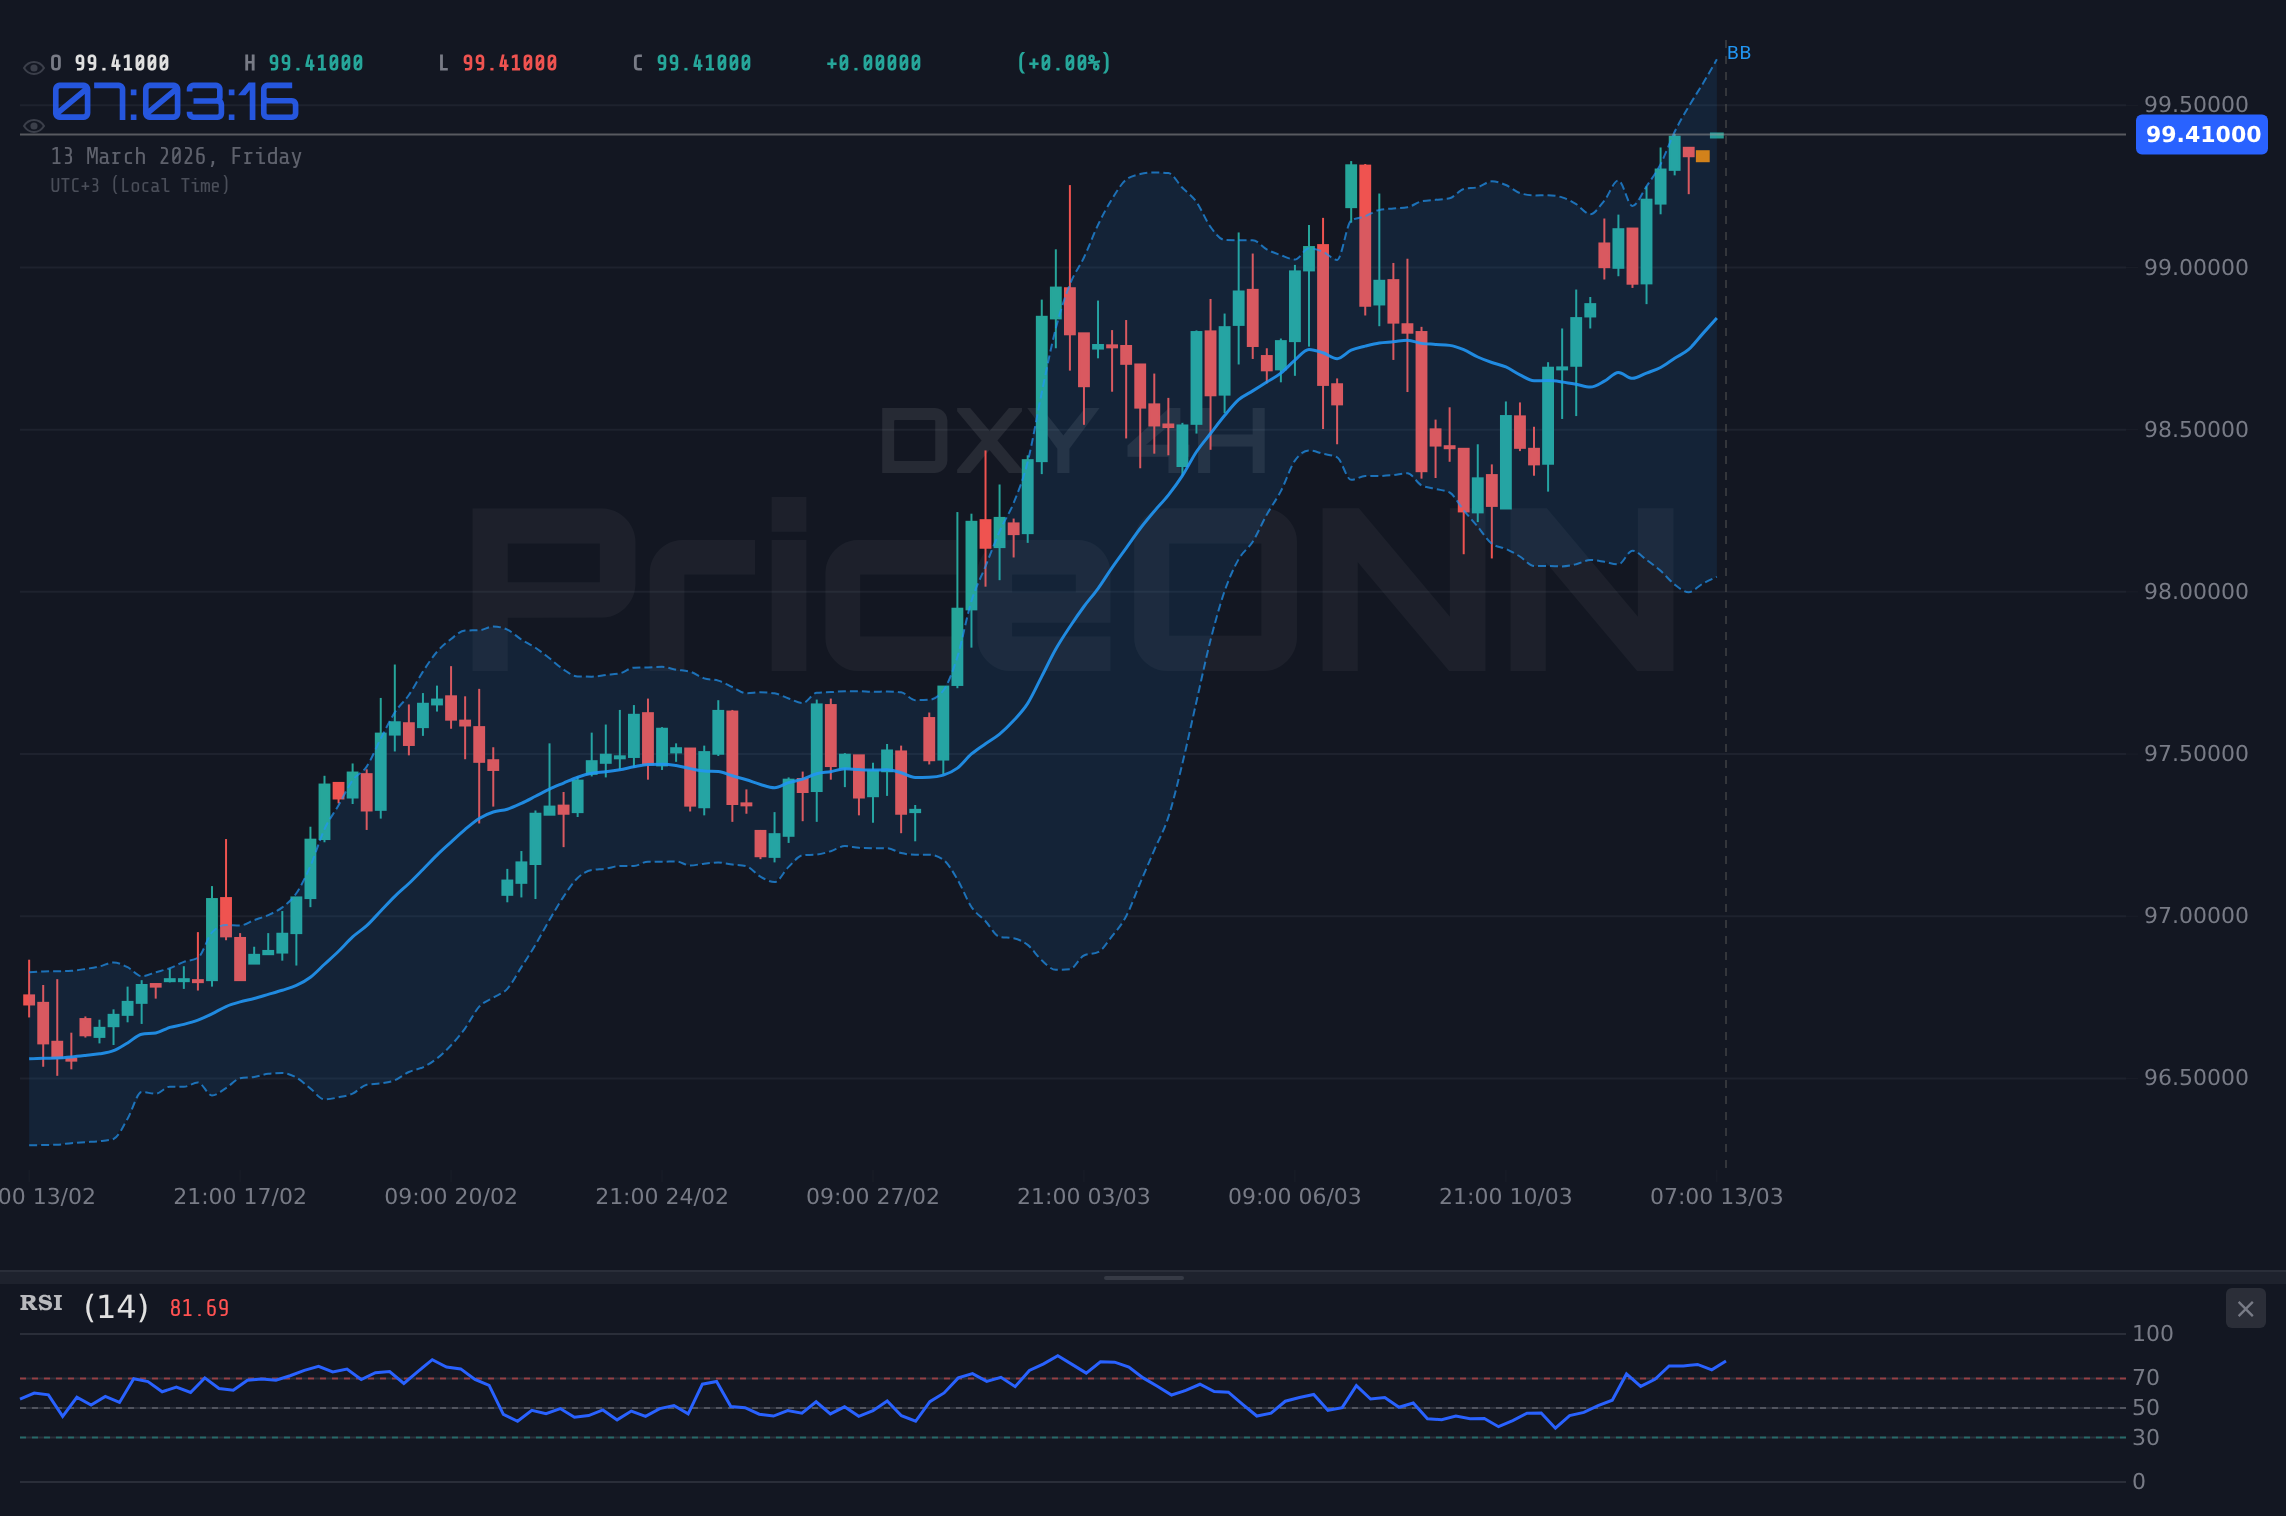
The Dollar Index (DXY) is currently trading at $99.54, edging closer to the resistance level of $99.58. The index has been on a bullish trajectory, fueled by geopolitical tensions in the Middle East and a reassessment of the Federal Reserve's future policy path. The key question now is whether the DXY can sustain this momentum and break through the $99.58 resistance, potentially opening the door for further gains.
- RSI at 71.83 in the 1H timeframe indicates overbought conditions, suggesting potential for short-term pullback.
- Key resistance level at $99.58, a break above which could signal further bullish momentum.
- The DXY's correlation with rising oil prices due to Middle East tensions is providing additional support.
- Investors are closely watching upcoming USD economic data releases for confirmation of the DXY's bullish trend.
The Bull's Roadmap: Breaking $99.58 and Beyond
The bullish scenario for the DXY hinges on a successful breach of the $99.58 resistance level. If the index can decisively close above this point, it could target the next resistance levels at $99.76 and $100.1, as indicated by the daily timeframe analysis. This move would likely be supported by continued geopolitical tensions and hawkish signals from the Federal Reserve. The 1H and 4H timeframes show a strong uptrend, with ADX values at 32.47 and 25.94 respectively, indicating sustained bullish momentum. A breakout above $99.58 within the next week could see the DXY testing $100.1. The Stochastic oscillator in the 1D timeframe shows a K value of 92.85, which is high, but the D value is at 73.26, indicating there is still room for upside.
Potential Triggers for the Bullish Scenario
Several factors could trigger this bullish breakout. Stronger-than-expected US economic data, such as the upcoming reports, could bolster the dollar's appeal. Further escalation of geopolitical tensions in the Middle East, as highlighted by recent news of rising oil prices due to Strait of Hormuz tensions, would also likely drive safe-haven demand for the dollar. According to Reuters, Fed officials are closely monitoring inflation data, and hawkish comments suggesting continued rate hikes could further strengthen the DXY.
Where Bears Take Control: A Retreat Below $99.31
The bearish scenario for the DXY would involve a failure to break above $99.58, followed by a retreat below the support level of $99.31. A sustained move below this level could trigger a further decline towards the next support levels at $99.25 and $99.21, as identified in the 1H timeframe analysis. This scenario could unfold if economic data disappoints, leading to a reassessment of the Fed's rate hike expectations. The 1H RSI at 71.83 suggests that the DXY is overbought, increasing the likelihood of a pullback. Furthermore, easing geopolitical tensions could reduce the demand for safe-haven assets, weighing on the dollar. This scenario could play out within the next few days if the immediate support breaks. The fact that the MACD shows positive momentum in the 1H timeframe could be a sign of weakness, as a reversal from this level would be a strong bearish signal.
Factors Enabling the Bearish Reversal
Weaker-than-expected US economic data releases, especially the upcoming data, could trigger a bearish reversal. A dovish shift in the Federal Reserve's rhetoric, signaling a potential pause in rate hikes, would also weigh on the dollar. Furthermore, a de-escalation of geopolitical tensions in the Middle East, reducing the demand for safe-haven assets, could contribute to a bearish outlook for the DXY. According to Bloomberg, some analysts believe that the dollar's strength is overextended, and a correction is overdue.
The Waiting Game: A Range-Bound Scenario
A neutral scenario for the DXY would involve the index remaining range-bound between the support level of $99.31 and the resistance level of $99.58. This scenario could occur if economic data releases are mixed, providing no clear direction for the Federal Reserve's policy path. The lack of a clear catalyst could keep the DXY trading within this range for the next week or two. The ADX value of 15.45 in the 1H timeframe indicates a weak trend, supporting the possibility of a range-bound scenario. The Stochastic oscillator in the 1H timeframe shows a K value of 84.38 and a D value of 84.93, both in the overbought region. This could indicate that the bulls are losing steam, but the lack of a clear bearish trigger could prevent a significant pullback.
Conditions for a Range-Bound DXY
Mixed economic data releases, creating uncertainty about the Federal Reserve's future policy path, would likely contribute to a range-bound scenario. A lack of significant geopolitical developments, preventing a surge in safe-haven demand, would also support this outlook. Furthermore, a wait-and-see approach from market participants, awaiting further clarity on the economic outlook, could keep the DXY trading within a narrow range.
Assessing the Most Likely Path for the Dollar Index
Considering the current market conditions, the most likely scenario for the DXY is a bullish breakout above $99.58 (60% probability). The strong uptrend in the 1H and 4H timeframes, coupled with ongoing geopolitical tensions and the potential for hawkish signals from the Federal Reserve, supports this outlook. However, traders should closely monitor the upcoming economic data releases and be prepared for a potential bearish reversal if data disappoints. A neutral or range-bound scenario has a 30% probability, while a bearish reversal has a 10% probability.
Trading involves risk. Always use appropriate risk management techniques, including stop-loss orders, and never invest more than you can afford to lose.
Key Triggers to Watch This Week
Several key events and data releases could significantly impact the DXY's trajectory this week. These include:
- The upcoming data, which could provide further clues about the strength of the US economy and the Federal Reserve's policy path.
- Developments in the Middle East, as any escalation of tensions could drive further safe-haven demand for the dollar.
- Federal Reserve officials' speeches and comments, as any hawkish or dovish signals could significantly influence market expectations.
Technical Outlook Summary
| Indicator | Value | Signal |
|---|---|---|
| RSI (14) | 71.83 (1H) | Neutral |
| MACD Histogram | Positive (1H) | Bullish |
| Stochastic | 84.38/84.93 (1H) | Overbought |
| ADX | 32.47 (1H) | Strong Trend |
| Bollinger | Upper Band (1H) | Watch |
Key Levels
Support Levels
Resistance Levels
Frequently Asked Questions: DXY Analysis
What happens if DXY breaks above $99.58 resistance?
If the DXY decisively breaks above the $99.58 resistance, it could target the next resistance levels at $99.76 and $100.1, signaling further bullish momentum. This breakout would likely be supported by continued geopolitical tensions and hawkish signals from the Federal Reserve.
Should I buy DXY at current $99.54 levels given RSI at 71.83?
While the DXY is currently trading near $99.54 and the 1H RSI is at 71.83, indicating overbought conditions, a conservative approach would be to wait for a confirmed breakout above $99.58 before considering a long position. A stop-loss order below $99.31 would help manage risk.
Is RSI at 71.83 a sell signal for DXY right now?
An RSI of 71.83 in the 1H timeframe suggests the DXY is overbought, increasing the likelihood of a short-term pullback. However, a sell signal should be confirmed by other indicators or a break below the $99.31 support level, as the overall trend remains bullish.
How will the upcoming data affect DXY this week?
The upcoming data will be crucial for determining the DXY's trajectory this week. Stronger-than-expected data could reinforce the Federal Reserve's hawkish stance and push the DXY higher, while weaker-than-expected data could lead to a reassessment of rate hike expectations and a potential bearish reversal.
Track markets in real-time
AI-powered analysis, technical indicators and real-time price data.
Join Our Telegram Channel
Breaking market news, AI analysis and trading signals instantly.
Join Channel