The S&P 500 is feeling the heat, currently trading at $6,698.15, a level that's being closely watched by traders and analysts alike. The broader market is experiencing a bout of jitters, and the SP500 isn't immune to the pressure. Let's dive into the technicals and fundamentals to understand what's driving this move and what to expect next.
- RSI at 44.26 on the 1H chart suggests further downside potential in the short term.
- Critical support sits at 6,676.4; a break below could trigger a steeper decline.
- MACD histogram on the 1D chart shows decreasing negative momentum, potentially hinting at a bottom.
- Fed rate expectations and geopolitical tensions are key drivers for SP500's correlation with DXY.
Looking at the hourly chart, the S&P 500's trend is neutral, but the overall signal is leaning bearish. The RSI(14) sits at 44.26, suggesting there's still room for further downside before the index becomes oversold. The MACD, while showing positive momentum, is struggling to maintain its upward trajectory, adding to the cautious outlook. The ADX, currently at 23.12, suggests a moderately strong downtrend. This combination of indicators paints a picture of an index under pressure, with limited signs of an immediate reversal.
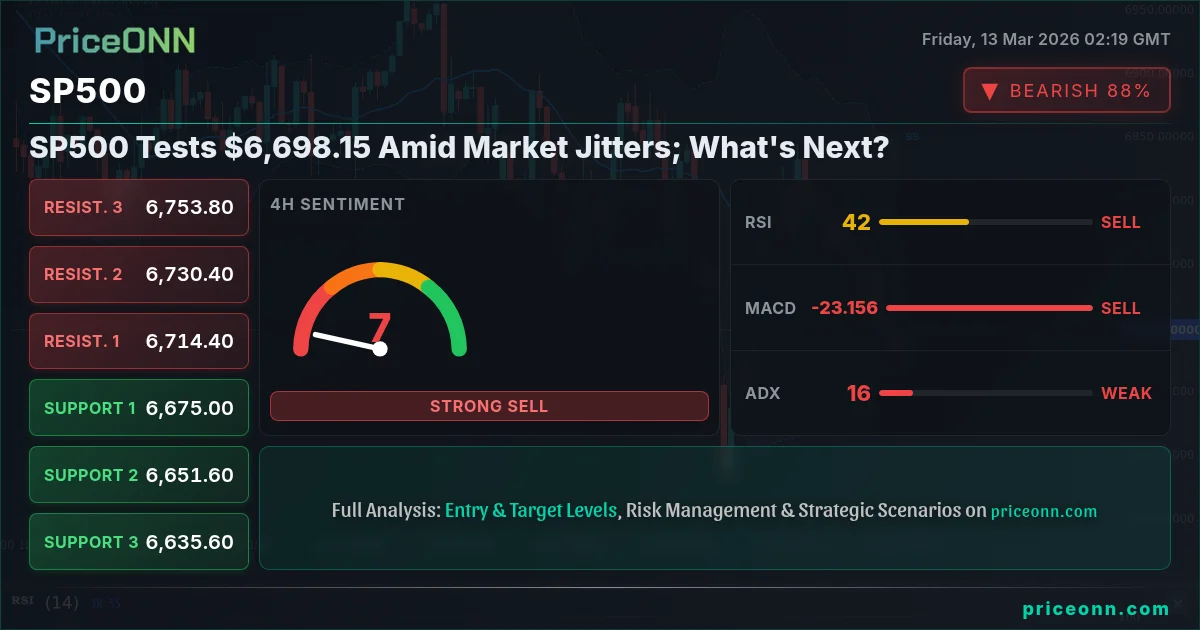
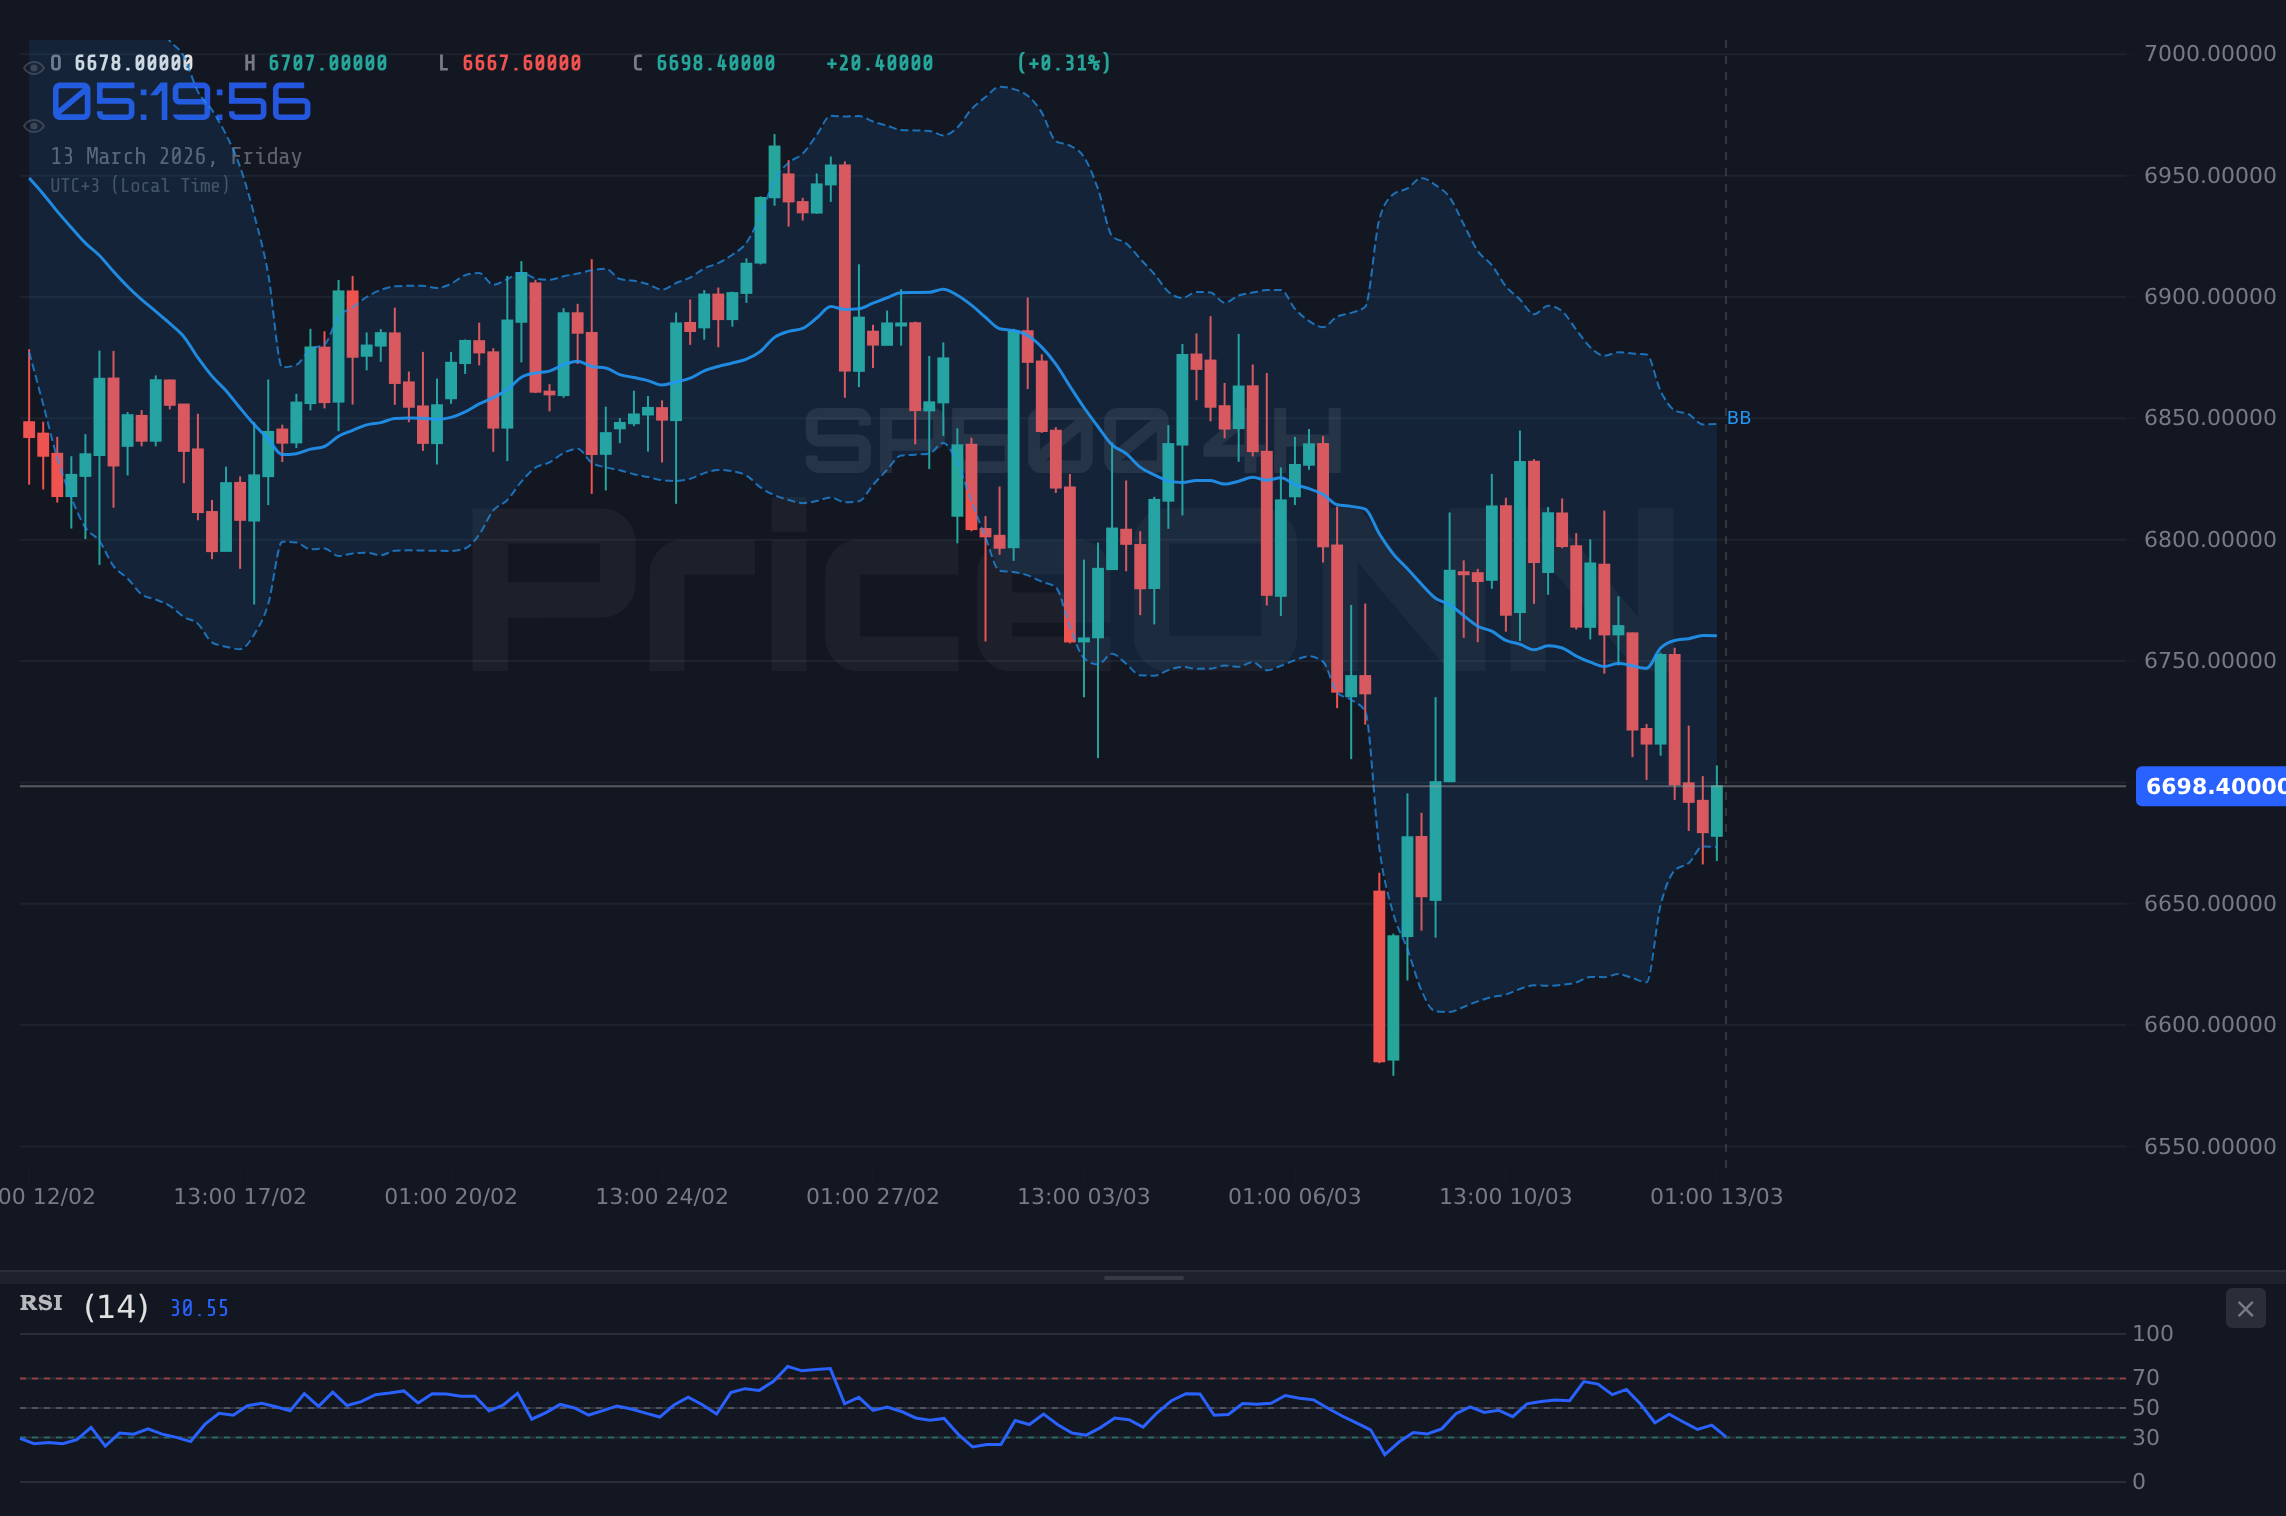
Stepping back to the 4-hour timeframe, the bearish sentiment becomes more pronounced. The RSI(14) is at 43.09, mirroring the hourly chart's indication of further downside potential. The MACD histogram has flipped negative, signaling a shift in momentum. The ADX reading of 16.11 confirms the lack of a strong trend in either direction. The Stochastic, with %K at 13.38 and %D at 15.92, indicates oversold conditions. However, the overall technical picture suggests that the downward momentum may persist.
On the daily chart, the S&P 500 trend is bearish, but some indicators suggest a potential for a change in direction. The RSI(14) stands at 37.74, indicating the index is approaching oversold territory, which could attract buyers. The Stochastic shows %K at 50.06 and %D at 44.28, suggesting a bullish crossover. The ADX shows a strong downtrend, with a value of 35.92. The MACD histogram, while still negative, is showing signs of decreasing downward momentum, hinting at a possible trend reversal.
Key support levels to watch on the S&P 500 include 6,676.4, 6,654.3 and 6,641. These levels could act as potential bounce points, but a break below could open the door for a deeper correction. On the upside, resistance levels are located at 6,711.8, 6,725.1 and 6,747.2. A sustained move above these levels would be needed to shift the short-term outlook to bullish. The S&P 500 is currently below the middle band of the Bollinger indicator on the 1H and 4H charts, pointing to continued bearish pressure.
The DXY (Dollar Index) is currently trading at 99.46, up 0.58% on the day. A stronger dollar is generally seen as a headwind for risk assets like equities, including the SP500. Rising geopolitical tensions, particularly in the Middle East, are fueling safe-haven demand for the dollar, further exacerbating the pressure on the SP500. The energy sector is also adding to the inflation concerns, with WTI crude oil trading near $95.49. According to Reuters, Fed officials remain concerned about "stubborn" inflation, potentially delaying any rate cuts. These factors combined are creating a challenging environment for the S&P 500.
The recent news of the Dow Jones Industrial Average plunging 1.5% adds another layer of concern. This broad sell-off in North American markets highlights the risk-off sentiment dominating investor behavior. According to Bloomberg, the US Dollar Index is eyeing 100 as geopolitical risk fuels safe-haven demand. This flight to safety is further weighing on the S&P 500. The recent strength in oil prices, driven by Middle East conflict, is also contributing to inflation fears, which could prompt the Federal Reserve to maintain its hawkish stance.
From a trader's perspective, the SP500 is currently in a precarious position. Short-term traders may look for opportunities to fade rallies towards resistance levels, while longer-term investors might consider waiting for a deeper pullback before adding to their positions. The key is to manage risk carefully and avoid chasing the market. The upcoming economic data releases, particularly the U.S. employment data scheduled for release today, will be crucial in determining the next direction for the S&P 500.
The S&P 500's trend is affected by several factors, including the strength of the dollar, the outlook for interest rates, and the overall risk appetite of investors. The ongoing geopolitical tensions in the Middle East and the rise in oil prices are adding to the uncertainty. The market is likely to remain volatile in the near term, with the S&P 500 potentially testing lower support levels.
The economic calendar also plays a significant role in shaping market sentiment. Investors are closely monitoring the latest economic data releases, including the U.S. employment data scheduled for release today. Any surprises in the data could trigger sharp moves in the S&P 500. According to the economic calendar, the GBP data releases today will also be important. Moreover, market participants are awaiting more data release in the coming days. These data points will provide further clues about the health of the global economy and the outlook for interest rates.
Frequently Asked Questions: SP500 Analysis
What happens if SP500 breaks below the 6,676.4 support?
A break below the 6,676.4 support level could trigger a steeper decline, potentially leading to a test of the next support levels at 6,654.3 and 6,641. This scenario would likely be driven by increased selling pressure and a further deterioration in market sentiment.
Should I sell SP500 at current $6,698.15 levels given RSI near 44?
With the RSI at 44.26 on the 1H chart, the SP500 isn't yet oversold, suggesting further downside potential. However, the Stochastic indicator shows some bullish crossover. Therefore, consider shorting pullbacks to 6,711.8 resistance with a stop-loss above this level.
Is the MACD signal bullish or bearish for SP500 trend analysis?
The MACD on the hourly chart shows positive momentum, while the 4H chart shows negative momentum, creating mixed signals. The MACD histogram on the daily chart is showing decreasing downward momentum, hinting at a possible trend reversal; therefore, more confirmation is needed.
How will the US employment data affect SP500 today?
Stronger-than-expected employment data could reinforce the Fed's hawkish stance, potentially leading to further downside pressure on the S&P 500. Conversely, weaker-than-expected data could ease concerns about inflation and prompt a relief rally.
The S&P 500 is currently facing a challenging environment, with a combination of technical and fundamental factors weighing on the index. While the short-term outlook appears bearish, some indicators suggest the potential for a bottom to form. Investors and traders should closely monitor key support and resistance levels, as well as upcoming economic data releases, to navigate the market effectively. Volatility creates opportunity-those prepared will be rewarded.
Track markets in real-time
AI-powered analysis, technical indicators and real-time price data.
Join Our Telegram Channel
Breaking market news, AI analysis and trading signals instantly.
Join Channel