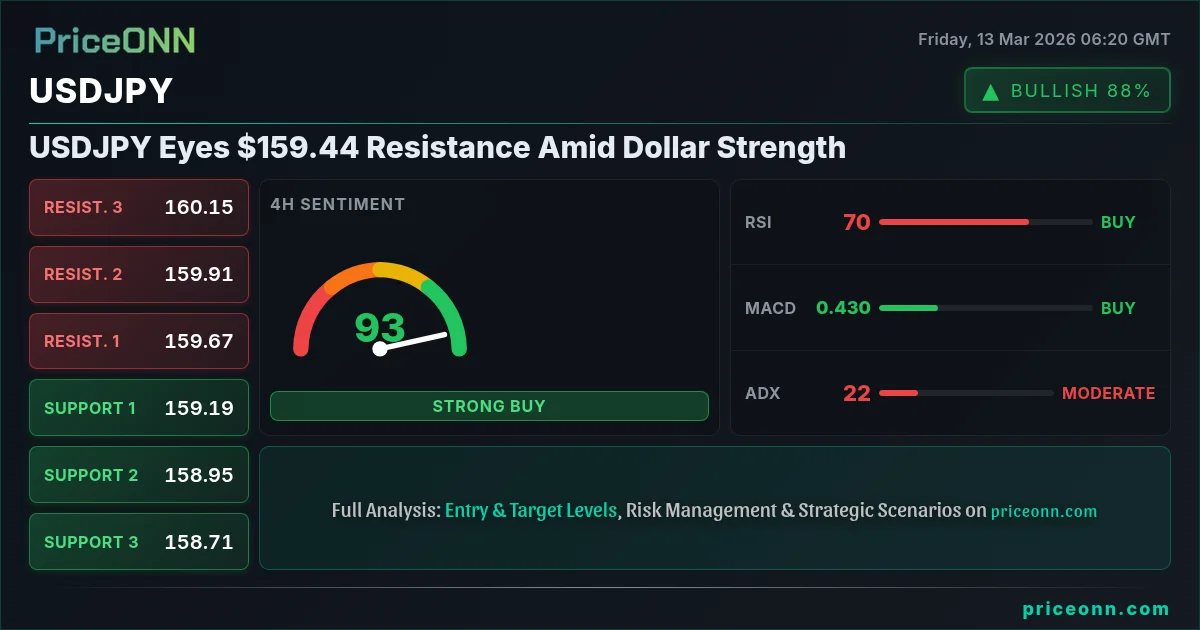
USDJPY is currently trading around $159.44, a level that has proven to be a significant hurdle in recent sessions. The pair's struggle to decisively break above this mark comes amid a broader strengthening of the US dollar, as reflected in the DXY (Dollar Index), which currently sits at 99.62. The interplay between dollar strength and yen weakness is creating a complex dynamic for USDJPY traders.
- USDJPY is testing resistance at $159.44, a key level to watch for potential breakouts.
- The Dollar Index (DXY) at 99.62 is strengthening, putting pressure on USDJPY.
- A strong USD jobs report today could propel USDJPY through resistance, but a weak report could see a pullback.
- RSI on the daily chart is nearing overbought territory, suggesting a possible pause or pullback.
The dollar's ascent is being fueled by a combination of factors, including increased geopolitical risk and a repricing of Federal Reserve rate hike expectations. According to recent news, rising tensions in the Middle East, particularly surrounding Iran's threats to block the Strait of Hormuz, have boosted demand for safe-haven assets like the US dollar. At the same time, stronger-than-expected economic data in the US has led some investors to believe that the Fed may need to maintain a more hawkish stance on monetary policy, further supporting the greenback. The Canadian dollar is under pressure as the nation's trade deficit balloons to $3.6 billion, overshadowing a surge in crude.
From a technical perspective, the 1-hour chart reveals a rising trend with 84% strength, but the ADX at 17.09 indicates a weak trend, suggesting the current rally may lack conviction. A break above the immediate resistance at 159.669 could open the door to further gains, with subsequent targets at 159.837 and 160.001. However, the RSI on the 1-hour chart, currently at 63.42, suggests that the pair is approaching overbought territory, which could lead to a short-term pullback. The Stochastic oscillator, with %K at 73.92 and %D at 57.9, confirms the bullish momentum, but also hints at the possibility of a correction.

Zooming out to the 4-hour timeframe, the bullish trend remains intact with 81% strength. The RSI at 69.31 is also approaching overbought levels, while the Stochastic oscillator is already in overbought territory, with %K at 84.86 and %D at 84.46. The MACD histogram shows positive momentum, but a potential crossover could signal a weakening of the uptrend. Key support levels to watch on the 4-hour chart include 159.04, 158.817 and 158.627. A break below these levels could trigger a deeper correction.
On the daily chart, the bullish trend is even more pronounced, with 90% strength. However, the RSI at 68.86 is nearing overbought territory, and the Stochastic oscillator is deep in overbought territory, with %K at 95.13 and %D at 84.79. The ADX at 20.96 suggests a moderate-strength uptrend, but the high RSI and Stochastic readings indicate that the pair may be due for a breather. Key resistance to watch on the daily chart is 159.633, followed by 159.961 and 160.498. Meanwhile, support levels to monitor include 158.768, 158.231 and 157.903.
Looking at the economic calendar, the market's focus will be on today's (Friday) high-impact USD data releases. These releases, including the jobs report, will be crucial in determining the near-term direction of USDJPY. A strong jobs report could provide further impetus for the dollar, potentially pushing USDJPY through resistance at $159.44. Conversely, a weak jobs report could weigh on the dollar, leading to a pullback in USDJPY. Given that the 1D RSI is approaching overbought territory, the pair may be due for a breather. The previous reading on USD Unemployment Claims was 4.3, and any significant deviation from this number could cause volatility.
The surge in WTI crude oil above $94 a barrel, fueled by escalating tensions in the Middle East, could also have implications for USDJPY. Rising oil prices tend to be inflationary, which could prompt the Federal Reserve to maintain a more hawkish stance on monetary policy, further supporting the dollar. However, it's worth noting that Japan is a major importer of oil, so higher oil prices could also weigh on the Japanese economy, potentially offsetting some of the positive impact on USDJPY.
For traders, the key level to watch remains $159.44. A decisive break above this level, confirmed by strong volume and positive momentum, could signal the start of a more sustained uptrend. However, given the overbought conditions on the daily chart, it's prudent to exercise caution and wait for confirmation before initiating new long positions. Alternatively, a pullback from current levels could present an opportunity to buy USDJPY at lower prices, particularly if support levels at 159.337 (1H), 159.04 (4H) and 158.768 (1D) hold firm.
Having tracked USDJPY through various economic cycles, the current setup presents a unique blend of technical and fundamental factors. Historically, when RSI reaches similar levels on the daily chart, the pair has often experienced a period of consolidation or a pullback. This pattern last appeared in early 2025, when price consolidated for nearly two weeks before continuing its uptrend. The correlation with DXY remains a key factor, with USDJPY generally moving in tandem with the dollar index. However, occasional decoupling can occur due to idiosyncratic factors affecting the Japanese yen, such as changes in Bank of Japan monetary policy.
From a multi-timeframe analysis perspective, the bullish trend is most evident on the 1-day chart, while the 1-hour and 4-hour charts show signs of potential overbought conditions. This suggests that scalpers and day traders may want to focus on short-term pullback opportunities, while swing traders and long-term investors may want to wait for a more decisive break above $159.44 before adding to their positions. The current ADX value is 19.19, which indicates low trend strength.
Until the impact of today's data releases resolves this uncertainty, caution is warranted. The combination of a strong dollar and a relatively weak yen suggests that the upside potential for USDJPY may be limited in the near term. Therefore, it may be prudent to wait for a more decisive break above $159.44, confirmed by increased volume and positive momentum, before initiating new long positions. Alternatively, a pullback from current levels could present an opportunity to buy USDJPY at lower prices, particularly if support levels at 159.337, 159.04, and 158.768 hold firm.
Frequently Asked Questions: USDJPY Analysis
What happens if USDJPY breaks above $159.63 resistance?
A decisive break above $159.63, confirmed by strong volume, could signal the start of a more sustained uptrend. The subsequent resistance levels to watch would be $159.96 and $160.50.
Should I buy USDJPY at current levels of $159.44 given the approaching overbought RSI?
Given the overbought conditions on the daily chart, it's prudent to exercise caution before initiating new long positions. A pullback from current levels could present a better opportunity to buy USDJPY at lower prices, particularly if support levels at 159.34, 159.04 and 158.77 hold.
Is RSI at 68.86 a sell signal for USDJPY right now?
While an RSI of 68.86 suggests that USDJPY is approaching overbought territory, it's not necessarily a sell signal in itself. It's important to consider other factors, such as the overall trend, momentum and key support and resistance levels before making a trading decision.
How will the US jobs report today affect USDJPY this week?
The US jobs report today will be crucial in determining the near-term direction of USDJPY. A strong jobs report could provide further impetus for the dollar, potentially pushing USDJPY through resistance at $159.44. Conversely, a weak jobs report could weigh on the dollar, leading to a pullback in USDJPY.
Volatility creates opportunity- those prepared will be rewarded.
Track markets in real-time
AI-powered analysis, technical indicators and real-time price data.
Join Our Telegram Channel
Breaking market news, AI analysis and trading signals instantly.
Join Channel