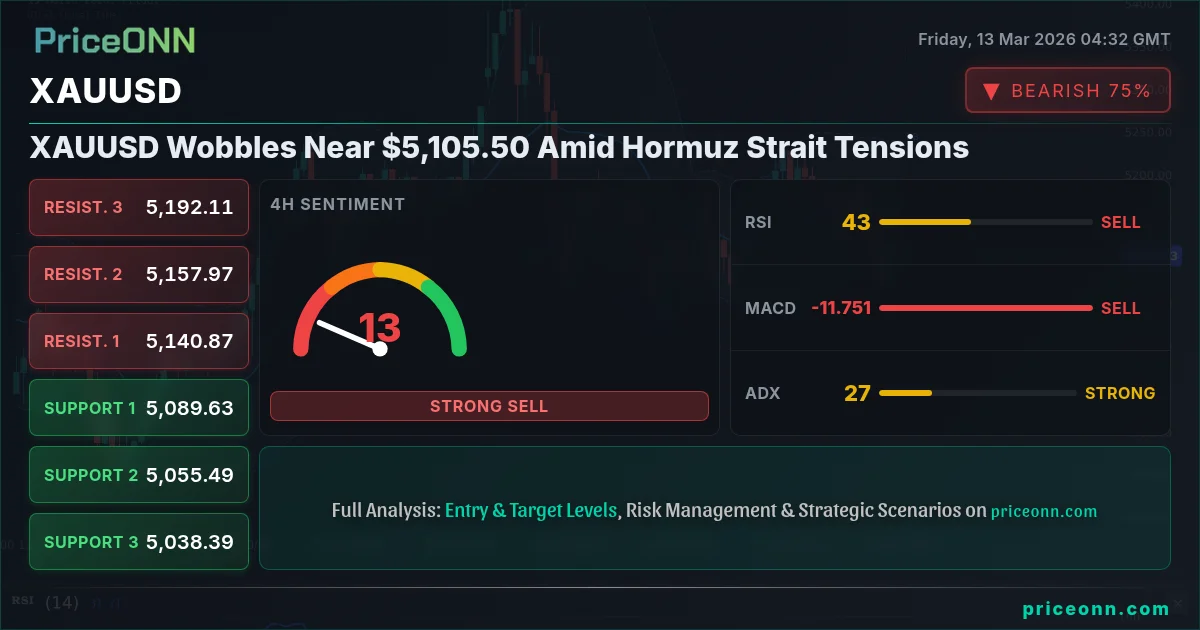
Gold (XAUUSD) is currently hovering near $5,105.50, a level that's proving to be a critical pivot point amid escalating geopolitical tensions and rising oil prices. The market is reacting to renewed uncertainty in the Middle East, with Iran's threat to the Strait of Hormuz adding fuel to the fire. This situation is creating a complex interplay of factors influencing gold's price action, warranting a closer look at the technicals and fundamentals.
- RSI at 40.41 on the 1H chart indicates neutral momentum with a slight downward bias.
- Key resistance level for XAUUSD sits at $5,123.34, a break above which could signal further upside.
- ADX at 39.04 on the 1H chart suggests a strong downtrend, but the overall signal is neutral across longer timeframes.
- Escalating tensions around the Strait of Hormuz are driving oil prices higher, impacting inflation expectations and gold's appeal.
From a technical perspective, XAUUSD's performance across different timeframes presents a mixed picture. On the 1-hour chart, the trend is neutral with 50% strength, the RSI stands at 40.41, indicating a neutral zone with a slight downward inclination. The MACD shows positive momentum, suggesting a potential for upward movement, but the Bollinger Bands indicate a price below the middle band, hinting at bearish pressure. The ADX, a measure of trend strength, registers 39.04, signaling a strong downtrend. However, the Stochastic indicator offers a contrasting view, with K=76.12 and D=51.08 pointing towards a bullish signal.
Zooming out to the 4-hour timeframe, the trend remains neutral, but the RSI dips to 42.83, reinforcing the downward bias. The MACD shifts to negative momentum, aligning with the Bollinger Bands that also show a price below the middle band. The Stochastic indicator further corroborates this bearish sentiment, with K=18.38 and D=29.97 indicating a downward signal. The ADX at 26.43 continues to suggest a strong downtrend. When we analyze the daily timeframe, the trend remains neutral, with the RSI at 51.6 showing a slight bullish inclination. However, the MACD continues to show negative momentum, and the Bollinger Bands still indicate a price below the middle band. Even with the Stochastic reading of K=30.07 and D=35.17 confirming the downward signal, the ADX at 11.86 signals a weak trend, suggesting a period of consolidation.
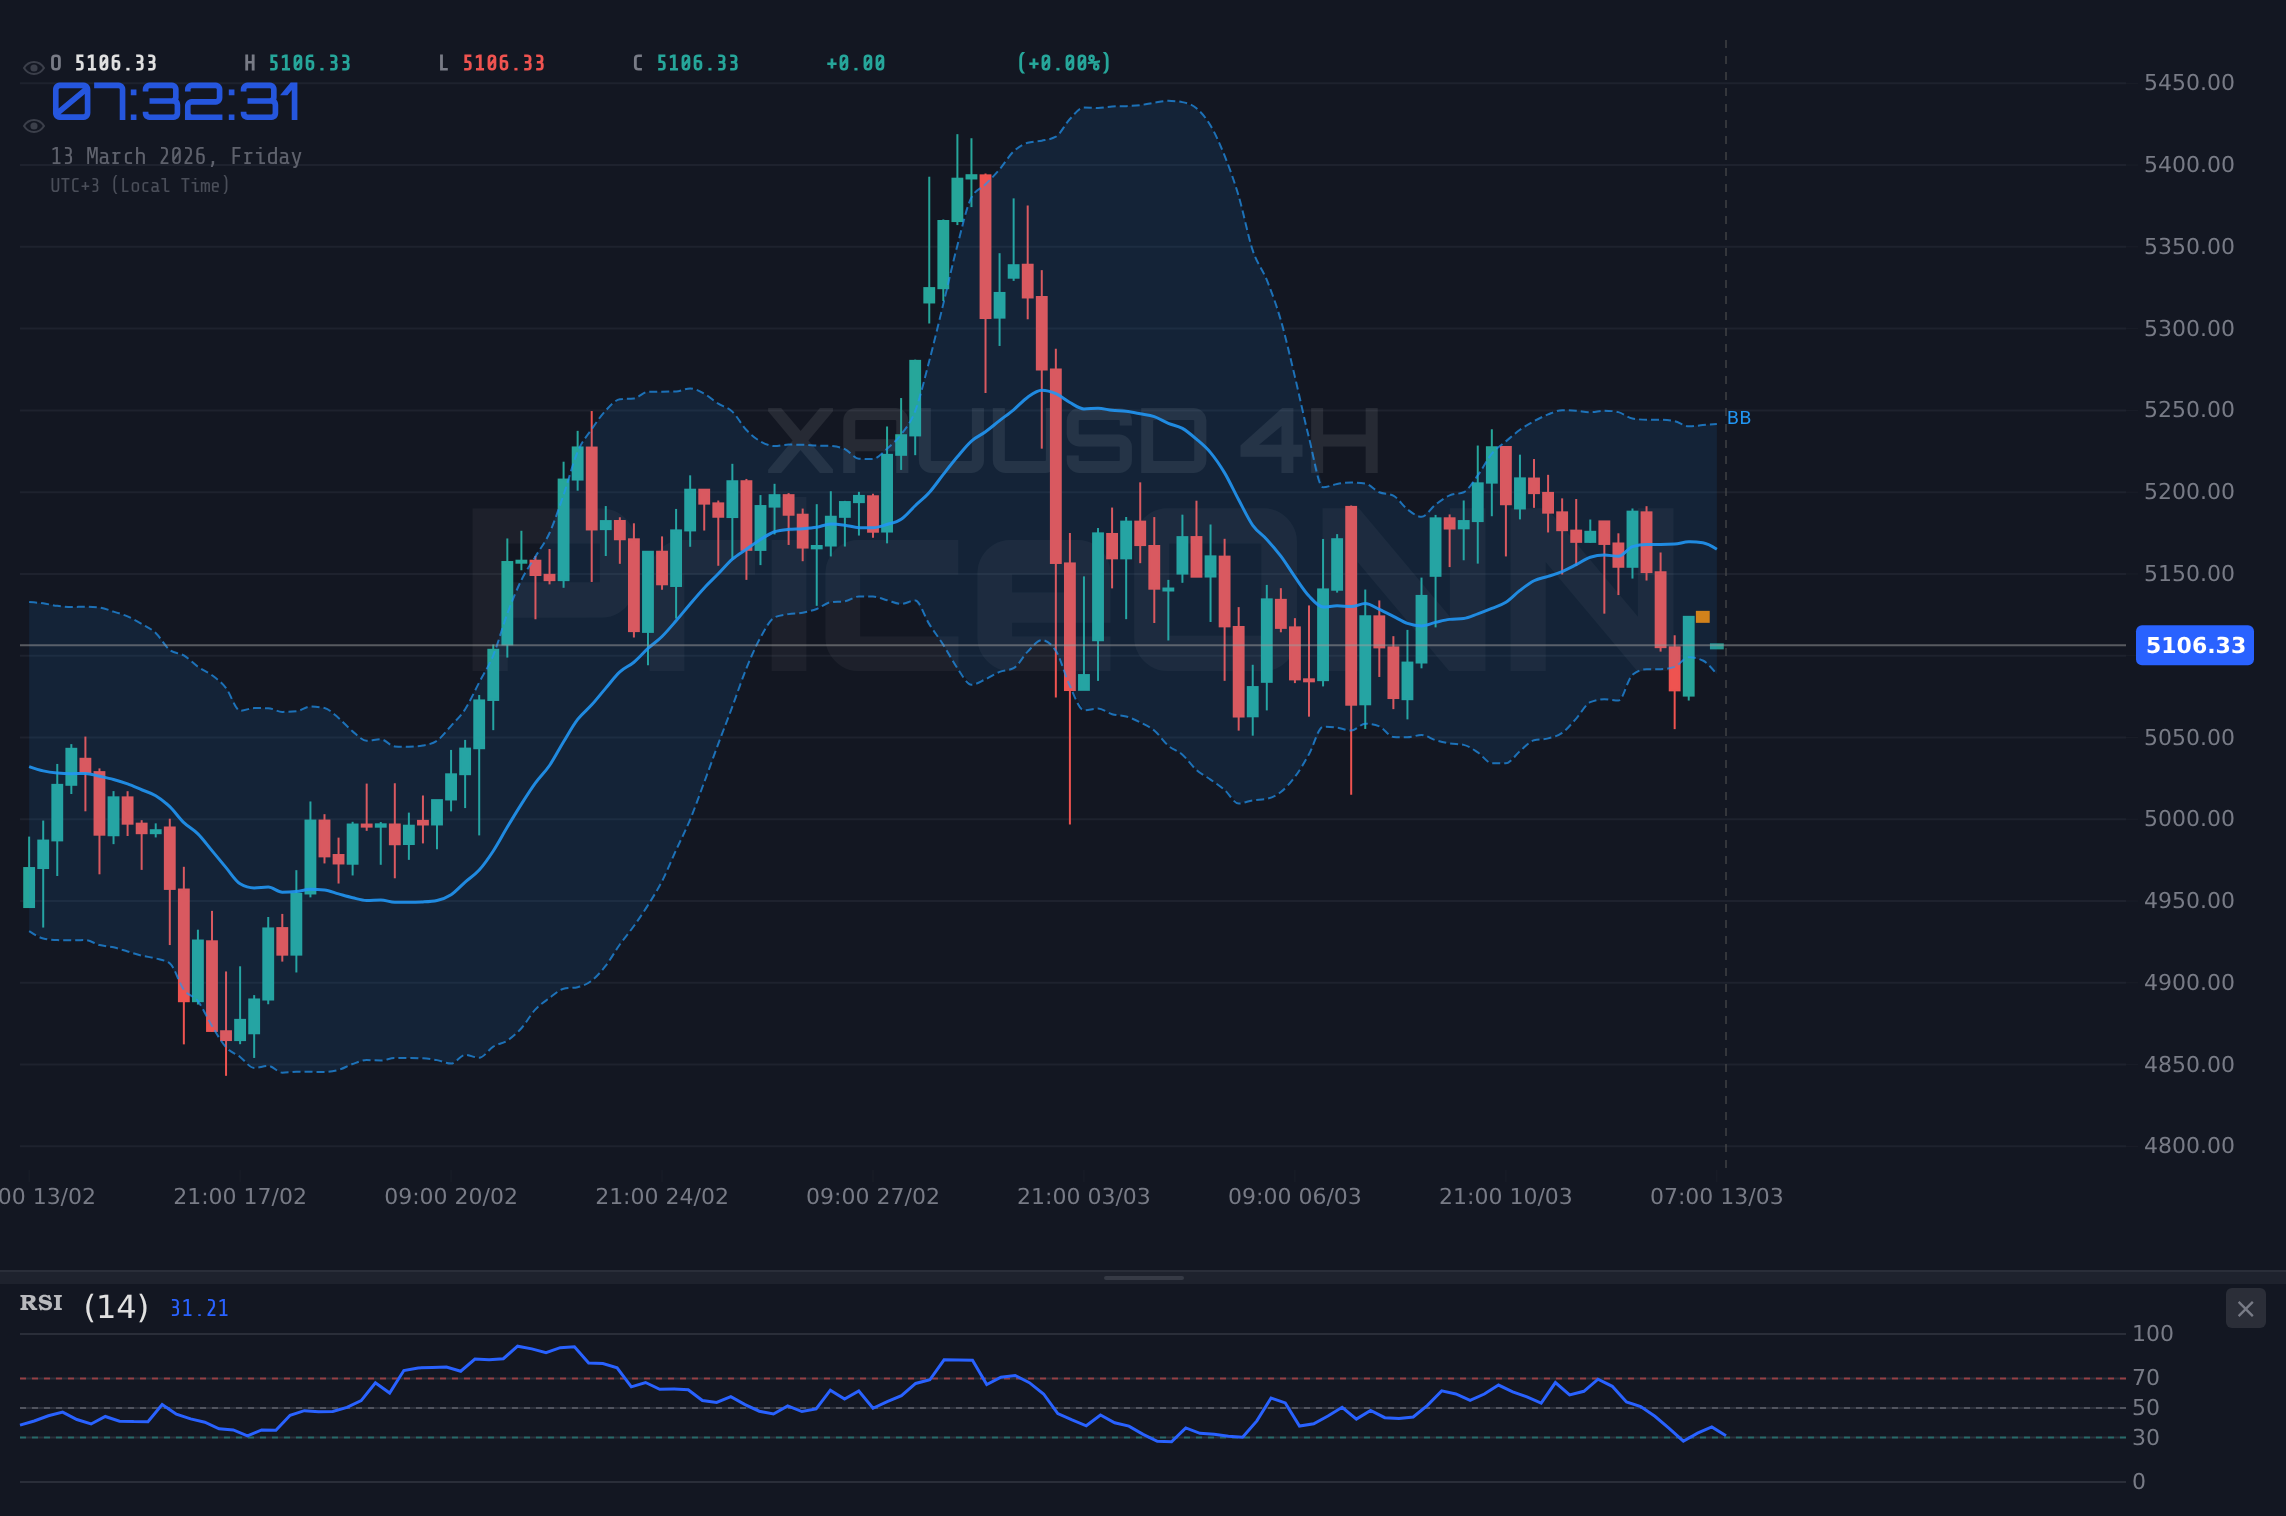
Key levels to watch for XAUUSD include the immediate support at $5,105.29 and $5,098.75 on the 1-hour timeframe. A break below these levels could open the door for a test of $5,087.24. On the upside, resistance is seen at $5,123.34, followed by $5,134.85 and $5,141.39. A decisive move above $5,123.34 could signal a shift in momentum and potentially lead to further gains. The 4H timeframe paints a broader picture, with support at $5,051.78, $5,024.74, and $4,994.38 and resistance at $5,109.18, $5,139.54, and $5,166.58. The daily chart provides even wider boundaries, with support at $5,025.47, $4,972.12, and $4,889.14 and resistance at $5,161.8, $5,244.78, and $5,298.13.
The current market sentiment appears to be heavily influenced by geopolitical factors, particularly the escalating tensions in the Middle East. According to recent reports, Iran is threatening to block the Strait of Hormuz, a critical chokepoint for global oil supplies. This threat has sent Brent crude oil prices above $100 a barrel, as the market anticipates potential supply disruptions. As a safe-haven asset, gold often benefits from geopolitical uncertainty, but the rising oil prices are also stoking inflation concerns, which can weigh on gold's appeal as an inflation hedge. The DXY (Dollar Index) is currently trading at 99.58, showing an upward trend, which typically exerts downward pressure on gold. With the RSI at 72.97 on the 1H chart, DXY is approaching overbought conditions, which could signal a potential reversal and provide some relief for gold.
The economic calendar is relatively light today, with only a few high-impact events scheduled. This gives the market ample time to digest the geopolitical news and reassess its positions. However, traders should remain vigilant for any surprise announcements or developments that could further escalate tensions in the Middle East. Looking ahead, the market will be closely watching upcoming economic data releases, including inflation figures and central bank policy statements, for further clues about the direction of interest rates and the overall economic outlook. Any hawkish signals from the Federal Reserve could strengthen the dollar and weigh on gold, while dovish signals could provide support.
For scalpers, the key is to watch for short-term breakouts and breakdowns around the immediate support and resistance levels mentioned above. The 1-hour chart provides the most relevant signals for this trading style. Swing traders may want to focus on the 4-hour chart, looking for confirmation of trend reversals or continuations. A break above $5,109.18 or below $5,051.78 could trigger a significant move. Long-term investors should pay closer attention to the daily chart, assessing the overall trend and looking for opportunities to accumulate gold at attractive levels during periods of weakness.
A historical perspective reveals that gold has often served as a hedge against geopolitical risks and economic uncertainty. During past crises, such as the Gulf War and the 2008 financial crisis, gold prices surged as investors sought refuge from market volatility. However, it's important to note that gold's performance can also be influenced by other factors, such as interest rates, inflation, and currency movements. Therefore, a comprehensive analysis that takes into account all of these variables is essential for making informed investment decisions. The current situation echoes similar patterns seen in the past, but the unique combination of factors warrants careful monitoring.
The correlation analysis reveals a complex interplay of forces. The rising DXY is generally negative for gold, but the escalating tensions in the Middle East are providing support. The SP500 is currently trading at 6689.45, showing a slight upward trend, suggesting that risk appetite is still relatively strong. However, a significant decline in the SP500 could trigger a flight to safety and boost demand for gold. Oil prices are also playing a crucial role, as higher energy costs can lead to inflation concerns, which can impact gold's appeal as an inflation hedge. The price of Brent crude is currently at $100.63, and WTI crude is at $95.59, both elevated levels that are contributing to inflationary pressures.
From a European perspective, the situation is particularly relevant, as the Eurozone is highly dependent on imported energy. Higher oil prices could exacerbate inflationary pressures in the Eurozone and potentially force the European Central Bank (ECB) to adopt a more hawkish stance. This could strengthen the euro and potentially offset some of the negative impact from the rising dollar on gold. The ECB's policy decisions will be closely watched in the coming months, as the central bank navigates the delicate balance between controlling inflation and supporting economic growth.
| Indicator | Value | Signal | Interpretation |
|---|---|---|---|
| RSI (1H) | 40.41 | Neutral | Slight downward bias, not oversold |
| MACD (1H) | Positive | Bullish | Potential for upward movement |
| Stochastic (1H) | K=76.12, D=51.08 | Bullish | Potential for short-term gains |
| ADX (1H) | 39.04 | Strong Downtrend | Confirms the downtrend strength |
| Bollinger Bands (1H) | Below Middle Band | Bearish | Price under pressure |
Frequently Asked Questions: XAUUSD Analysis
What happens if XAUUSD breaks above $5,123.34 resistance?
A break above the $5,123.34 resistance level could signal a shift in momentum and potentially lead to further gains, targeting the next resistance levels at $5,134.85 and $5,141.39, according to the 1H chart data. This scenario would likely be supported by a weakening DXY and a stabilization of geopolitical tensions.
Should I buy XAUUSD at current $5,105.50 levels given RSI at 40.41?
Given the RSI at 40.41 on the 1H chart, which indicates neutral momentum with a slight downward bias, a cautious approach is warranted at the current $5,105.50 level. Traders might consider waiting for a confirmed break above $5,123.34 or a pullback to a key support level before initiating a long position.
Is ADX at 39.04 on the 1H chart a reliable sell signal for XAUUSD?
While an ADX of 39.04 on the 1H chart suggests a strong downtrend, it should not be considered in isolation as a reliable sell signal. Traders should also consider other indicators, such as the MACD and Stochastic, as well as the overall geopolitical context, before making a decision.
How will the upcoming oil prices impact XAUUSD this week?
Rising oil prices, driven by escalating tensions in the Middle East, could lead to increased inflation expectations, which can weigh on gold's appeal as an inflation hedge. However, geopolitical uncertainty could also provide support for gold as a safe-haven asset, creating a complex interplay of factors influencing its price.
Track markets in real-time
AI-powered analysis, technical indicators and real-time price data.
Join Our Telegram Channel
Breaking market news, AI analysis and trading signals instantly.
Join Channel