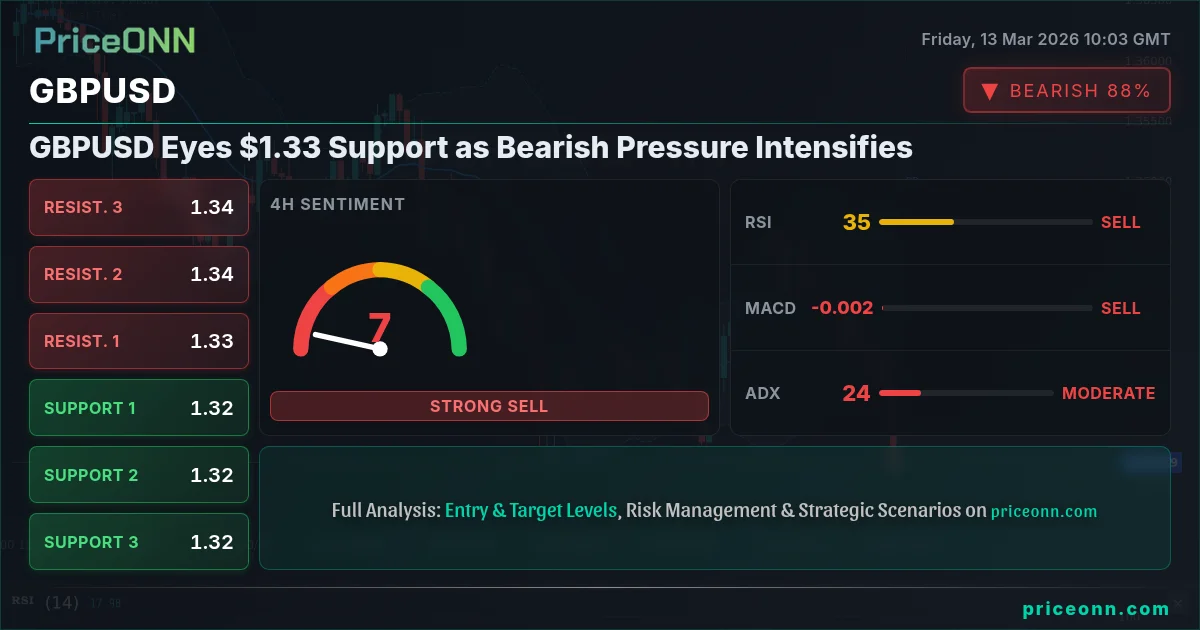
GBPUSD is currently testing a critical support level around $1.33, a level that has been defended multiple times in recent weeks. The question now is whether this support will hold amid increasing bearish signals or if a breakdown is imminent.
- GBPUSD is testing key support at $1.33 as of March 13, 2026.
- RSI at 20.95 on the 1H chart signals oversold conditions, but the overall trend remains bearish.
- A break below 1.32494 could trigger a sharp decline towards the next support level.
- Dollar strength and risk-off sentiment are contributing to the downside pressure on GBPUSD.
The bearish sentiment surrounding GBPUSD is fueled by a combination of factors, including a strengthening US dollar and concerns about the UK's economic outlook. The Dollar Index (DXY) is currently trading at 99.91, up 0.51% on the day, putting significant pressure on major currency pairs. This strength is largely attributed to safe-haven demand amid escalating geopolitical tensions, particularly in the Middle East. The recent news of WTI crude oil soaring above $95 a barrel due to Strait of Hormuz tensions, as reported earlier today, is further exacerbating risk aversion. These events are increasing the attractiveness of the US dollar as a safe haven, driving capital flows away from riskier assets and currencies like the British pound.
From a technical perspective, GBPUSD is exhibiting several bearish signals across multiple timeframes. On the 1-hour chart, the trend is firmly down, with a trend strength of 100%. The RSI is at 20.95, indicating oversold conditions, which could lead to a short-term bounce. However, the MACD remains negative, suggesting that bearish momentum is still in play. The Stochastic oscillator is also in oversold territory, with %K at 5.44 and %D at 10.71. The ADX at 35.63 confirms the strength of the current downtrend. The immediate resistance is at 1.32743, and a break above this level would be needed to alleviate some of the bearish pressure.
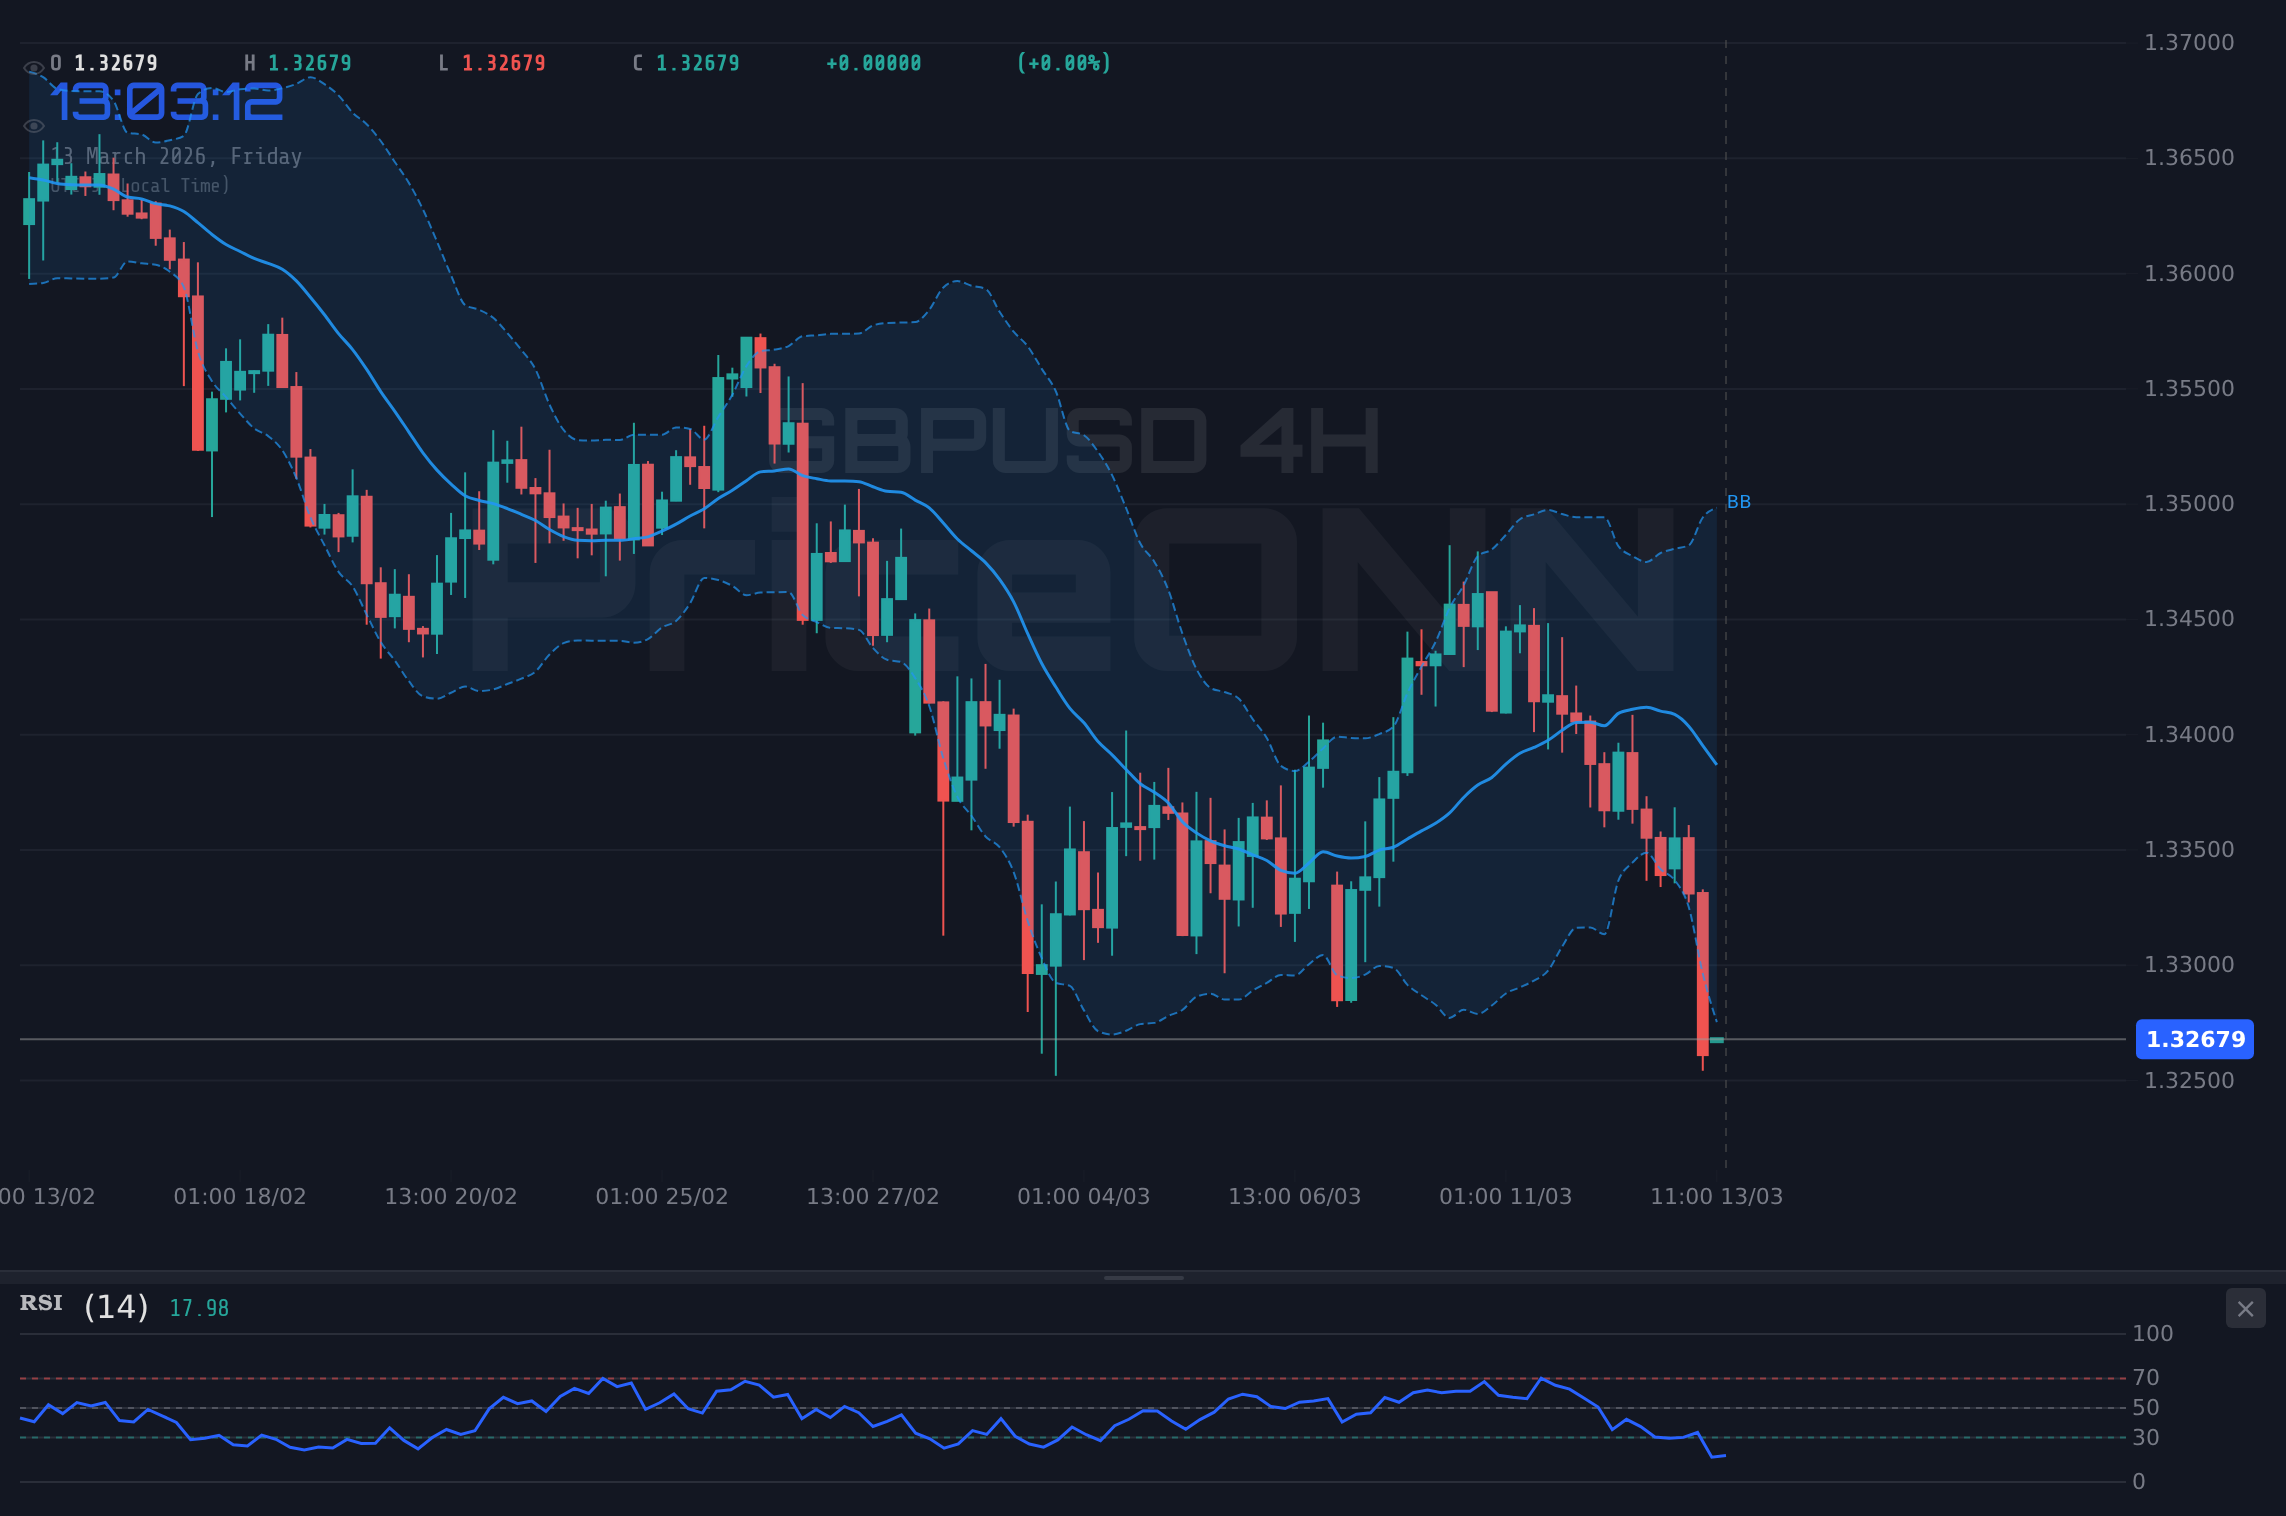
The 4-hour chart paints a similar picture, with a neutral trend but a bearish bias. The RSI is slightly higher at 31.56, still indicating bearish momentum. The MACD remains negative, and the Stochastic oscillator is also in oversold territory. The ADX at 22.36 suggests a moderate downtrend. Key resistance on this timeframe is at 1.33522. On the daily chart, the trend is bearish with a strength of 94%. The RSI is at 32.74, and the MACD remains negative. The Stochastic oscillator is also signaling a downtrend, with %K at 34.13 and %D at 45.11. The ADX at 28.94 confirms the strength of the downtrend. The immediate support level to watch is 1.33125, a break of which could accelerate the sell-off.
The upcoming economic data releases will be crucial in determining the next move for GBPUSD. While there are no specific high-impact events for GBP or USD listed in today's economic calendar, the market is likely to be sensitive to any surprise announcements or policy statements from central bank officials. The overall market sentiment is leaning towards caution, with investors closely monitoring geopolitical developments and economic indicators for further clues about the future direction of monetary policy. The fact that EUR/CHF slipped below 0.97 as the Swiss National Bank stands pat amid geopolitical risks, as reported earlier today, highlights the broader risk-off sentiment in the market.
One of the key macroeconomic factors to consider is the divergence in monetary policy between the Federal Reserve and the Bank of England. The Fed is widely expected to maintain its hawkish stance, while the Bank of England is perceived to be more dovish due to concerns about the UK's economic growth prospects. This divergence is putting downward pressure on GBPUSD, as investors favor the higher-yielding US dollar. The GBP is further pressured as the most recent GSC keyword intelligence results show traders are already looking at GBPUSD macroeconomic factors for March 2026.
Having tracked GBPUSD through the 2024 rate cycle, it's clear that the pair is highly sensitive to changes in interest rate expectations. Historically, when RSI reaches current levels on GBPUSD, the outcome has been a short-term bounce followed by a continuation of the downtrend. This pattern suggests that while a temporary pullback is possible, the overall bearish trend is likely to persist. Experienced traders know that patience will be rewarded here. Manage your risk, wait for your setup-the market always gives a second chance.
From a market sentiment perspective, there is a clear preference for short positions on GBPUSD. This is reflected in the overall signal from the 1-hour, 4-hour, and daily timeframes, which is consistently bearish. The fact that AUD/USD is defending key support as RBA rate hike bets rise, as reported earlier today, further underscores the broader risk-off sentiment in the market. Investors are seeking safety in the US dollar and other safe-haven assets, putting pressure on riskier currencies like the British pound and the Australian dollar.
Now this is where it gets interesting! The current technical setup on GBPUSD presents a potential opportunity for traders looking to capitalize on the downtrend. However, it is crucial to exercise caution and wait for confirmation before entering any positions. A break below the immediate support level of 1.32494 on the 1-hour chart could trigger a sharp decline towards the next support level, but it is essential to consider the risks associated with trading in a volatile market. The ADX at 35.63 is the real story here. A strong-trend reading like this means the breakout has committed; it could go either way.
Look, this level is absolutely critical: the 1.33 support. If this level breaks, we could see a significant move lower. The key is to watch for confirmation signals, such as a close below this level on the 4-hour chart or a break below the 1.32394 support on the 1-hour timeframe. If these conditions play out, we could see a great setup! Patience looks like it will be rewarded here. Manage your risk, wait for your setup-the market always gives a second chance.
One potential trading strategy is to wait for a retest of the 1.33 level after a breakdown and then enter a short position with a stop-loss order placed above the recent high. This would allow traders to capitalize on the downtrend while limiting their potential losses. Another strategy is to use a trailing stop-loss order to protect profits as the price moves lower. This would allow traders to stay in the trade as long as the downtrend persists while minimizing the risk of giving back profits.
Frequently Asked Questions: GBPUSD Analysis
What happens if GBPUSD breaks below 1.32494 support?
A break below the 1.32494 support on the 1-hour chart could trigger a sharp decline towards the next support level, potentially accelerating the downtrend. This is a key level to watch for confirmation of further bearish momentum.
Should I short GBPUSD at current $1.33 levels given RSI at 20.95?
While RSI at 20.95 signals oversold conditions, it's crucial to consider the overall bearish trend. A short entry could be considered after a confirmed break below 1.32494 with a stop-loss above the recent high to manage risk.
Is RSI at 20.95 a buy signal for GBPUSD?
Although RSI at 20.95 indicates oversold conditions, it's not a definitive buy signal. The overall trend is bearish, and a short-term bounce is more likely than a sustained reversal. Traders should look for other confirming signals before entering a long position.
How will the upcoming economic data affect GBPUSD this week?
While there are no high-impact GBP or USD events listed today, any unexpected policy statements or surprise announcements could significantly impact GBPUSD. Market participants should closely monitor economic indicators and central bank communications for potential catalysts.
The technical picture for GBPUSD remains bearish, with the pair currently testing a critical support level around $1.33. The combination of a strengthening US dollar, geopolitical tensions, and concerns about the UK's economic outlook is putting downward pressure on GBPUSD. Traders should exercise caution and wait for confirmation signals before entering any positions. With disciplined risk management, these choppy waters can be navigated safely.
Track markets in real-time
AI-powered analysis, technical indicators and real-time price data.
Join Our Telegram Channel
Breaking market news, AI analysis and trading signals instantly.
Join Channel