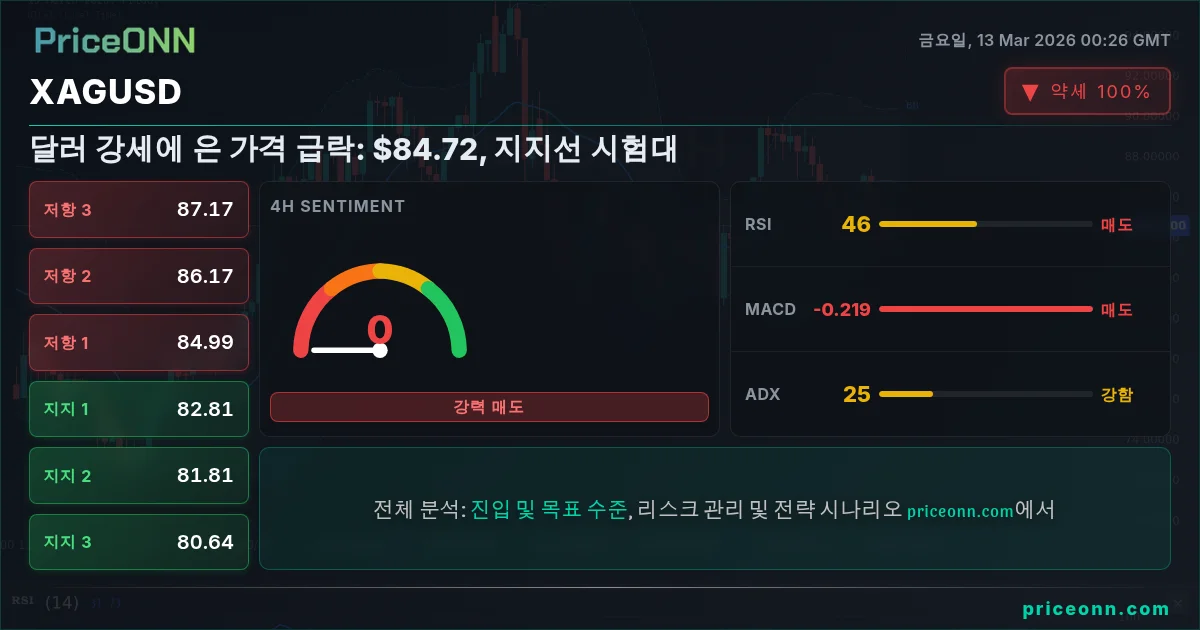
매매 기회를 놓치는 압박감을 느껴본 적이 있나요? 은(XAGUSD) 거래자들은 오늘 달러 강세 속에 귀금속 가격이 $84.72까지 하락하면서 비슷한 상황에 직면하고 있습니다. 이제 문제는 지지선이 유지될 수 있을지, 아니면 약세가 계속될지 여부입니다. 오늘 은 가격 분석 은 하락세에 초점이 맞춰져 있습니다.
현재 은 가격의 약세는 주로 미국 달러 지수(DXY)의 강세에 기인하며, DXY는 현재 99.38에 거래되고 있으며, 이는 당일 0.5% 상승한 수치입니다. 일반적으로 DXY 상승은 다른 통화 보유자에게 귀금속 가격을 더 비싸게 만들기 때문에 귀금속에 압력을 가합니다. 이 역 상관관계는 XAGUSD 거래자가 주목해야 할 핵심 역학입니다. 달러가 강세를 보이면 은 가격은 종종 약세를 보이고 그 반대도 마찬가지입니다.
기술적 관점에서 1시간 차트는 은 가격에 대한 약세 그림을 그리고 있습니다. ADX(평균 방향 지수)는 34.49로 강한 하락 추세를 나타냅니다. 이는 현재 하락 모멘텀이 계속될 가능성이 높다는 것을 의미합니다. RSI(상대 강도 지수)는 43.24로 여전히 중립 영역에 있어 은 가격이 과매도되기 전에 추가 하락 여지가 있음을 시사합니다. 그러나 Stochastic oscillator는 K=33.22 및 D=17.79로 잠재적인 강세 신호를 보여줍니다. 지표 간의 이러한 차이는 현재 시장의 우유부단함을 강조합니다. 단기 반등과 전반적인 약세 압력 간의 싸움입니다.
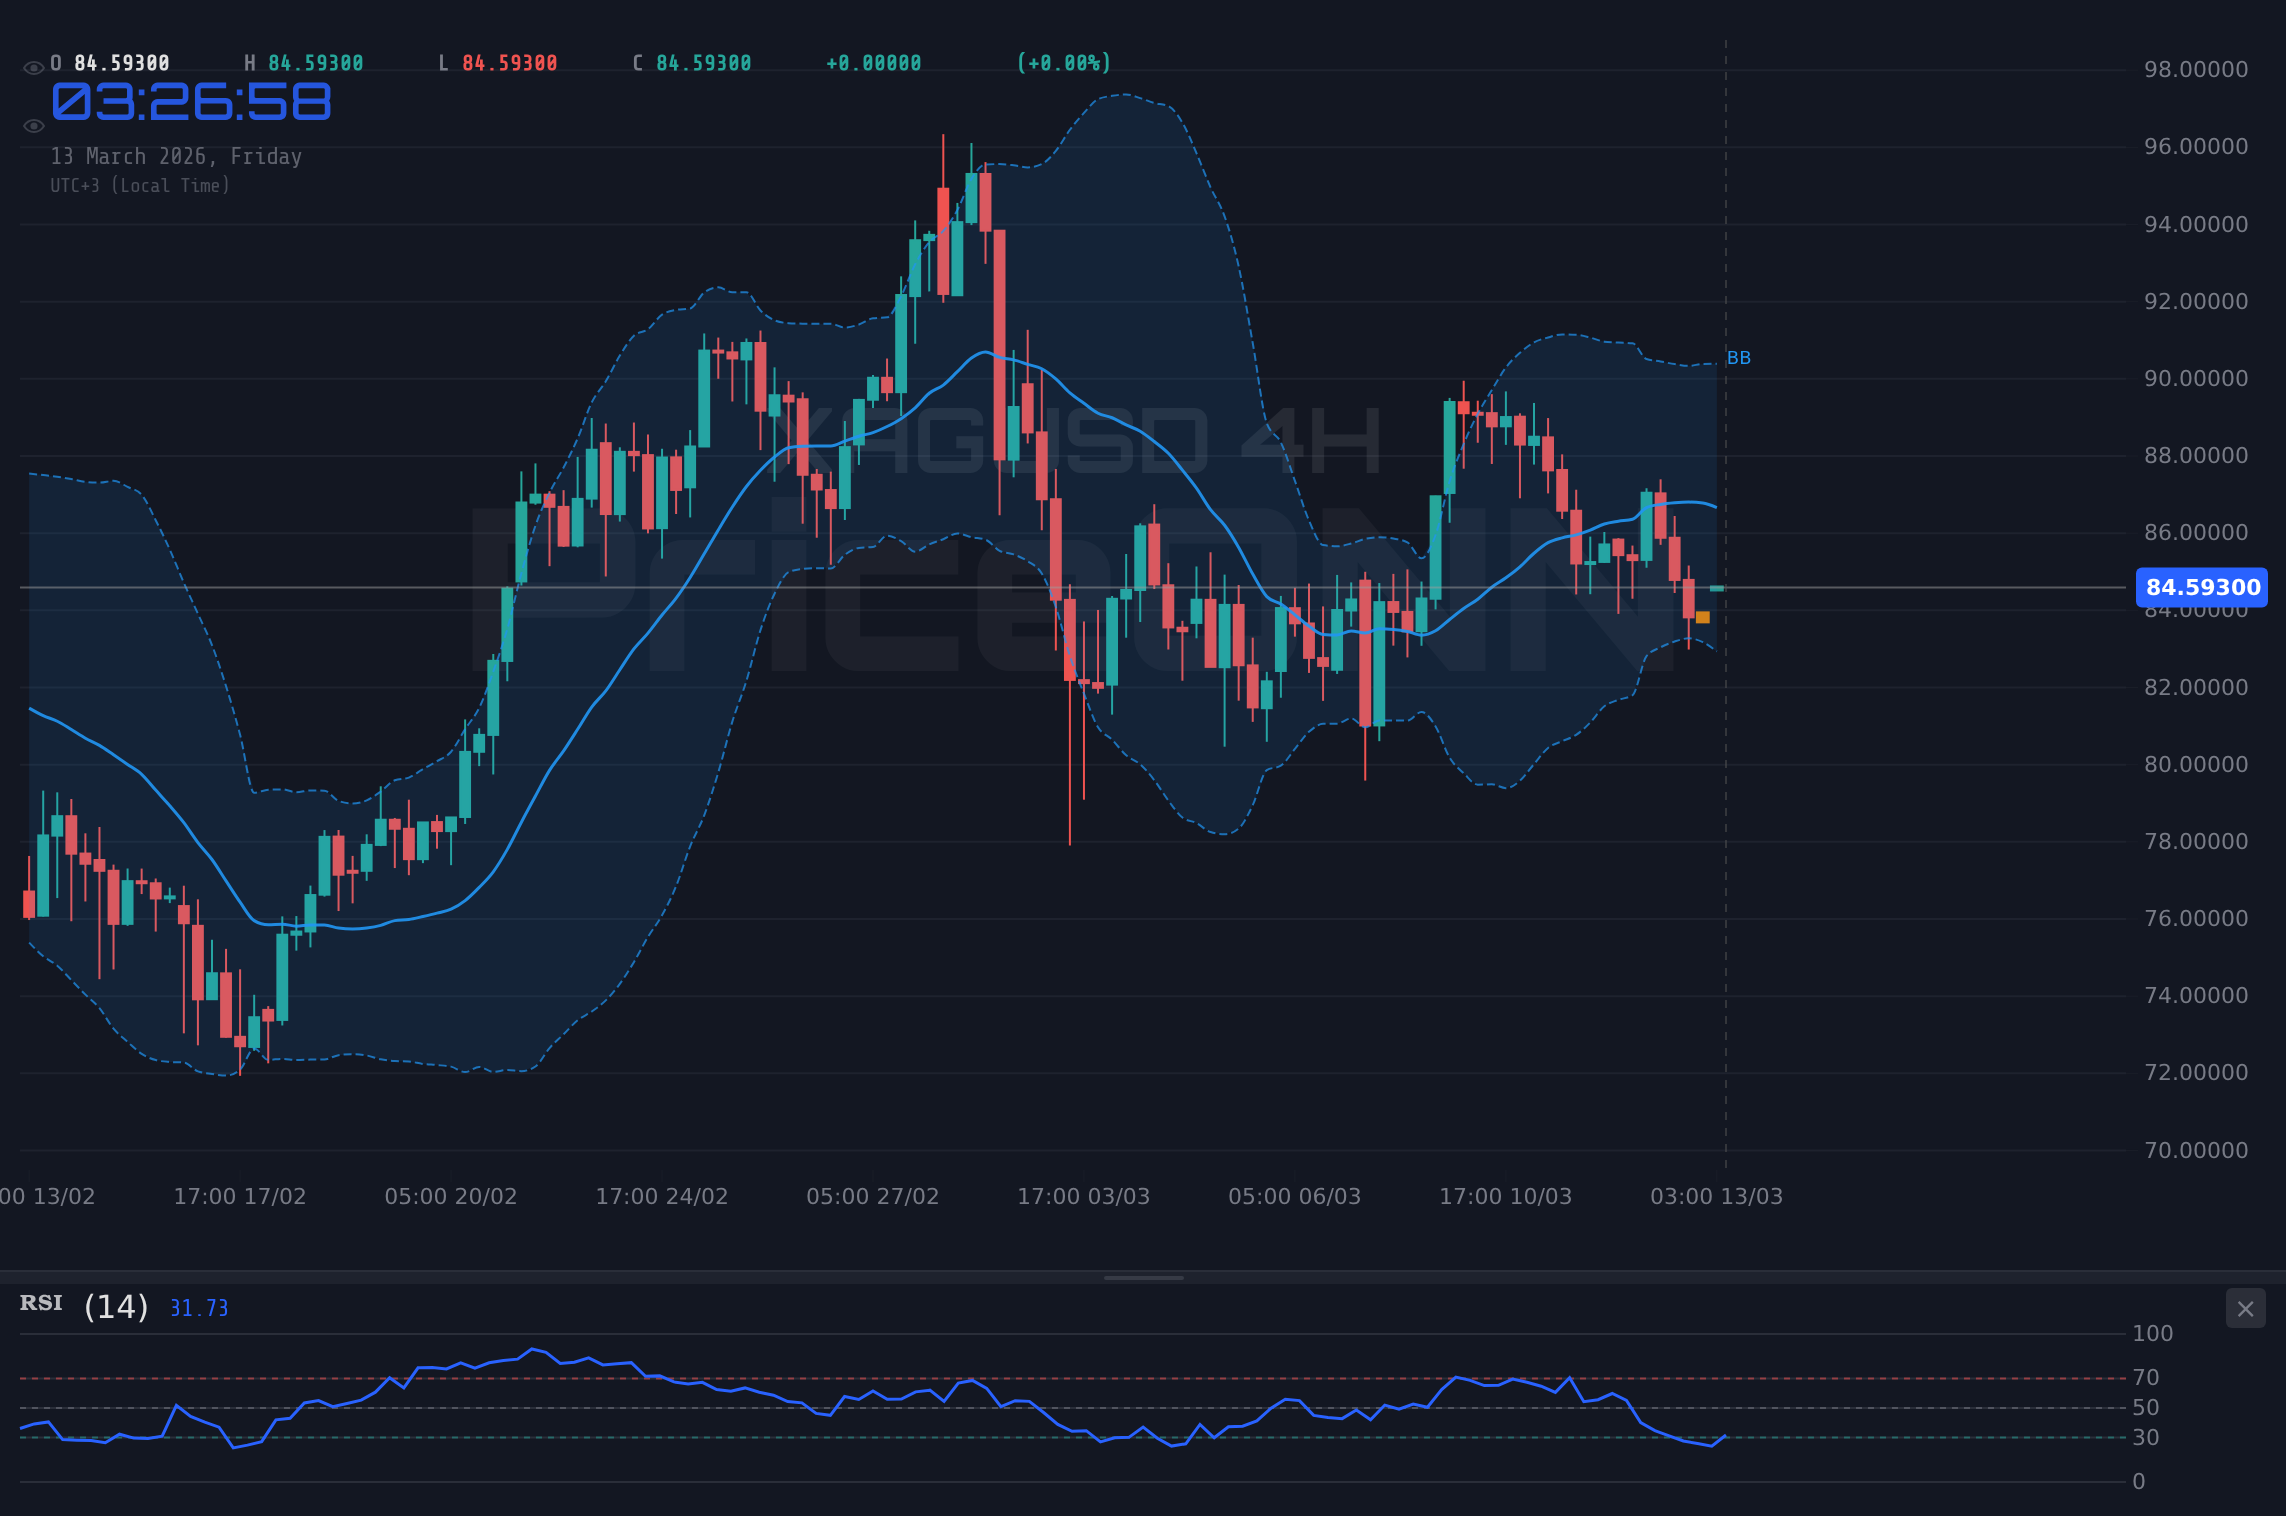
4시간 차트를 보면 추세는 중립적이지만 기술 지표는 여전히 약세로 기울어져 있습니다. RSI는 44.66으로 중립 영역에 있지만 하향 편향을 보입니다. Stochastic은 K=33.13 및 D=32.87로 매수 신호를 제공하여 단기 상승 잠재력을 보여주지만 MACD는 음의 모멘텀을 보여 약세가 여전히 통제하고 있음을 나타냅니다. ADX는 24.47로 중간 강도의 하락 추세를 나타냅니다.
일일 차트는 혼합된 전망을 제공합니다. 추세는 약세이지만 RSI는 49.68로 50에 매우 가까워 가능한 반전을 보여줍니다. MACD는 양의 모멘텀을 보이고 있지만 Stochastic은 매수를 알리고 ADX는 14.98로 약한 추세를 보여줍니다. 이 상충되는 정보로 인해 은 가격이 일일 시간 프레임에서 어디로 향할지 예측하기 어렵습니다.
1시간 차트에서 주목해야 할 주요 지지선은 $83.70이며, 그 다음은 $83.06 및 $82.74입니다. $83.70 아래로 하락하면 더 낮은 수준을 테스트할 수 있습니다. 상승세에서는 즉각적인 저항선이 $84.66에 있고, 그 다음은 $84.98 및 $85.62입니다. 강세는 단기 매도 압력을 완화하기 위해 $84.66을 넘어야 합니다. 장기적으로 주목해야 할 지지선은 $83.62, $81.54 및 $78.66이고 저항선은 $88.58, $91.46 및 $93.55입니다.
로이터 통신에 따르면 Fed 관계자들은 인플레이션을 면밀히 주시하고 있습니다. 이로 인해 금요일에 발표될 GDP 및 실업 수당 청구 건수와 같은 다가오는 USD 데이터 발표가 중요합니다. 예상보다 나은 데이터는 달러 강세를 부추기고 은 가격에 부담을 줄 수 있는 반면, 약한 데이터는 일시적인 유예를 제공할 수 있습니다. 투자자들은 이러한 발표를 주의 깊게 모니터링하고 그에 따라 포지션을 조정해야 합니다.
지정학적 긴장도 역할을 하고 있습니다. 이번 주 초에 보도된 바와 같이 중동 분쟁으로 인해 유가가 급등하고 있습니다. 이는 인플레이션 우려와 결과적으로 달러 강세에 기여하고 있습니다. 종종 인플레이션 헤지로 여겨지는 은은 달러의 안전 자산 매력이 현재 시장 심리를 지배하고 있기 때문에 예상만큼 큰 혜택을 누리지 못하고 있습니다.
거래 심리적 관점에서 볼 때 이러한 변동성에 직면하여 규율을 유지하는 것이 중요합니다. 많은 거래자들이 "떨어지는 칼날을 잡고" 싶은 충동을 느끼지만 롱 포지션을 취하기 전에 바닥을 확인하는 것이 더 현명합니다. 반대로 은 가격을 Short하는 사람들은 특히 달러가 예상치 않게 약세를 보일 경우 급격한 반등 가능성을 염두에 두어야 합니다. 이러한 불확실한 시기에는 위험 관리가 가장 중요합니다.
귀금속 거래는 상당한 손실 위험을 수반하며 모든 투자자에게 적합하지 않습니다. 높은 레버리지는 귀하에게 유리하게 작용할 수도 있고 불리하게 작용할 수도 있습니다. 거래를 결정하기 전에 투자 목표, 경험 수준 및 위험 감수성을 신중하게 고려해야 합니다.
다양한 시장 주기를 통해 XAGUSD를 추적한 결과 달러 강세 기간은 장기적으로 은 가격에 대한 훌륭한 매수 기회를 제공하는 경우가 많다는 것을 알게 되었습니다. 그러나 타이밍이 중요합니다. 자본을 투입하기 전에 바닥에 대한 기술적 확인을 기다리는 것이 필수적입니다. 달러 지수 상승은 은 가격에 압력을 가하고 있습니다.
역사적으로 RSI가 XAGUSD에서 이러한 수준에 도달했을 때 결과는 매우 다양했으므로 주의가 필요합니다. 이 패턴은 1월 초에 마지막으로 나타났으며, 가격은 통합 기간 후 반등했습니다. 이는 롱 포지션을 취하려는 사람들에게 인내가 보상받을 수 있음을 시사합니다.
요약하면 은 가격에 대한 단기 전망은 달러 강세와 지정학적 불확실성으로 인해 약세입니다. 그러나 장기 투자자는 주요 지지선을 주시하고 잠재적인 매수 기회를 활용할 준비를 해야 합니다. 변동성은 기회를 창출한다는 것을 기억하십시오. 준비된 자는 보상을 받을 것입니다.
자주 묻는 질문: XAGUSD 분석
XAGUSD가 $83.70 지지선 아래로 하락하면 어떻게 되나요?
$83.70 지지선 아래로 하락하면 추가 매도세가 촉발되어 1시간 차트에서 $83.06 및 $82.74의 다음 지지선을 목표로 할 수 있습니다. 이는 약세 추세를 확인하고 더 깊은 손실의 문을 열 것입니다.
달러 강세 속에서 현재 $84.72 수준에서 XAGUSD를 매수해야 할까요?
달러 강세와 약세 기술 지표를 감안할 때 현재 수준에서 매수하는 것은 위험합니다. 롱 포지션을 취하기 전에 바닥 확인 또는 달러 약세를 기다리는 것이 더 현명합니다. 확인 신호로 $84.66 저항선 위로 돌파를 기다리는 것을 고려하십시오.
음의 MACD 히스토그램이 지금 XAGUSD에 대한 강력한 매도 신호인가요?
음의 MACD 히스토그램은 약세 심리를 강화하지만 독립 실행형 매도 신호는 아닙니다. 다른 지표 및 전반적인 시장 상황과 함께 고려하십시오. 주요 지지선 아래로 하락하면 추가 확인이 추가됩니다.
다가오는 USD 데이터가 이번 주 XAGUSD에 어떤 영향을 미칠까요?
예상보다 나은 USD 데이터는 달러 강세를 부추겨 XAGUSD에 더 많은 압력을 가할 수 있습니다. 반대로 약한 데이터는 달러를 약화시키고 은 가격에 일시적인 유예를 제공할 수 있습니다. 발표를 면밀히 모니터링하고 그에 따라 포지션을 조정하십시오.
기술적 전망 요약
| 지표 | 값 | 신호 |
|---|---|---|
| RSI (14) | 43.24 | 중립 |
| MACD 히스토그램 | 음수 | 약세 |
| Stochastic | 33.22/17.79 | 강세 |
| ADX | 34.49 | 강한 하락 추세 |
| Bollinger | 중간 밴드 | 약세 |