BRENT Bullish at $65.73: Eyes on Crude Oil Inventories
BRENT crude oil is currently trading at $65.73, showing bullish signs. The market's attention is focused on upcoming U.S. crude oil inventories data.
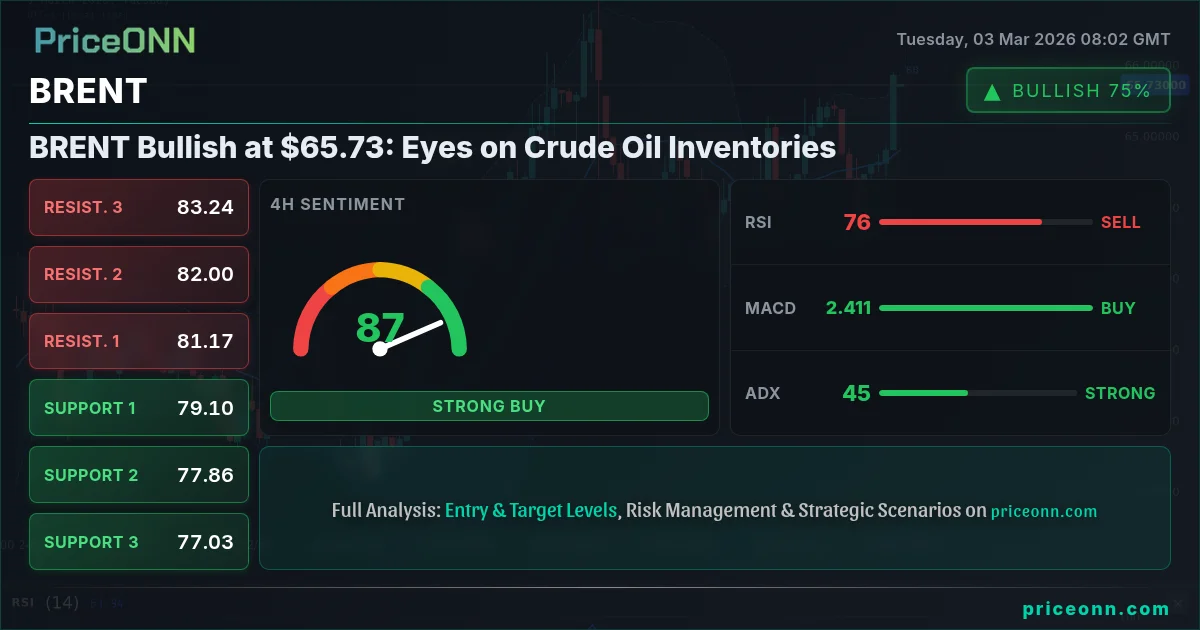
BRENT crude oil is displaying a resilient bullish outlook, currently trading at $65.73. This upward momentum has traders closely monitoring upcoming U.S. crude oil inventories data for further confirmation and potential breakout opportunities. Will this rally continue, or will profit-taking kick in?
- RSI at 71.16 on the 1H chart indicates overbought conditions, potentially signaling a pullback.
- Immediate resistance lies at $65.41, a break above which could trigger further upside.
- U.S. crude oil inventories data on Wednesday, March 4th, is expected to be a significant catalyst.
- Strong DXY performance continues to put pressure on correlated assets, including BRENT.
Decoding BRENT's Bullish Momentum
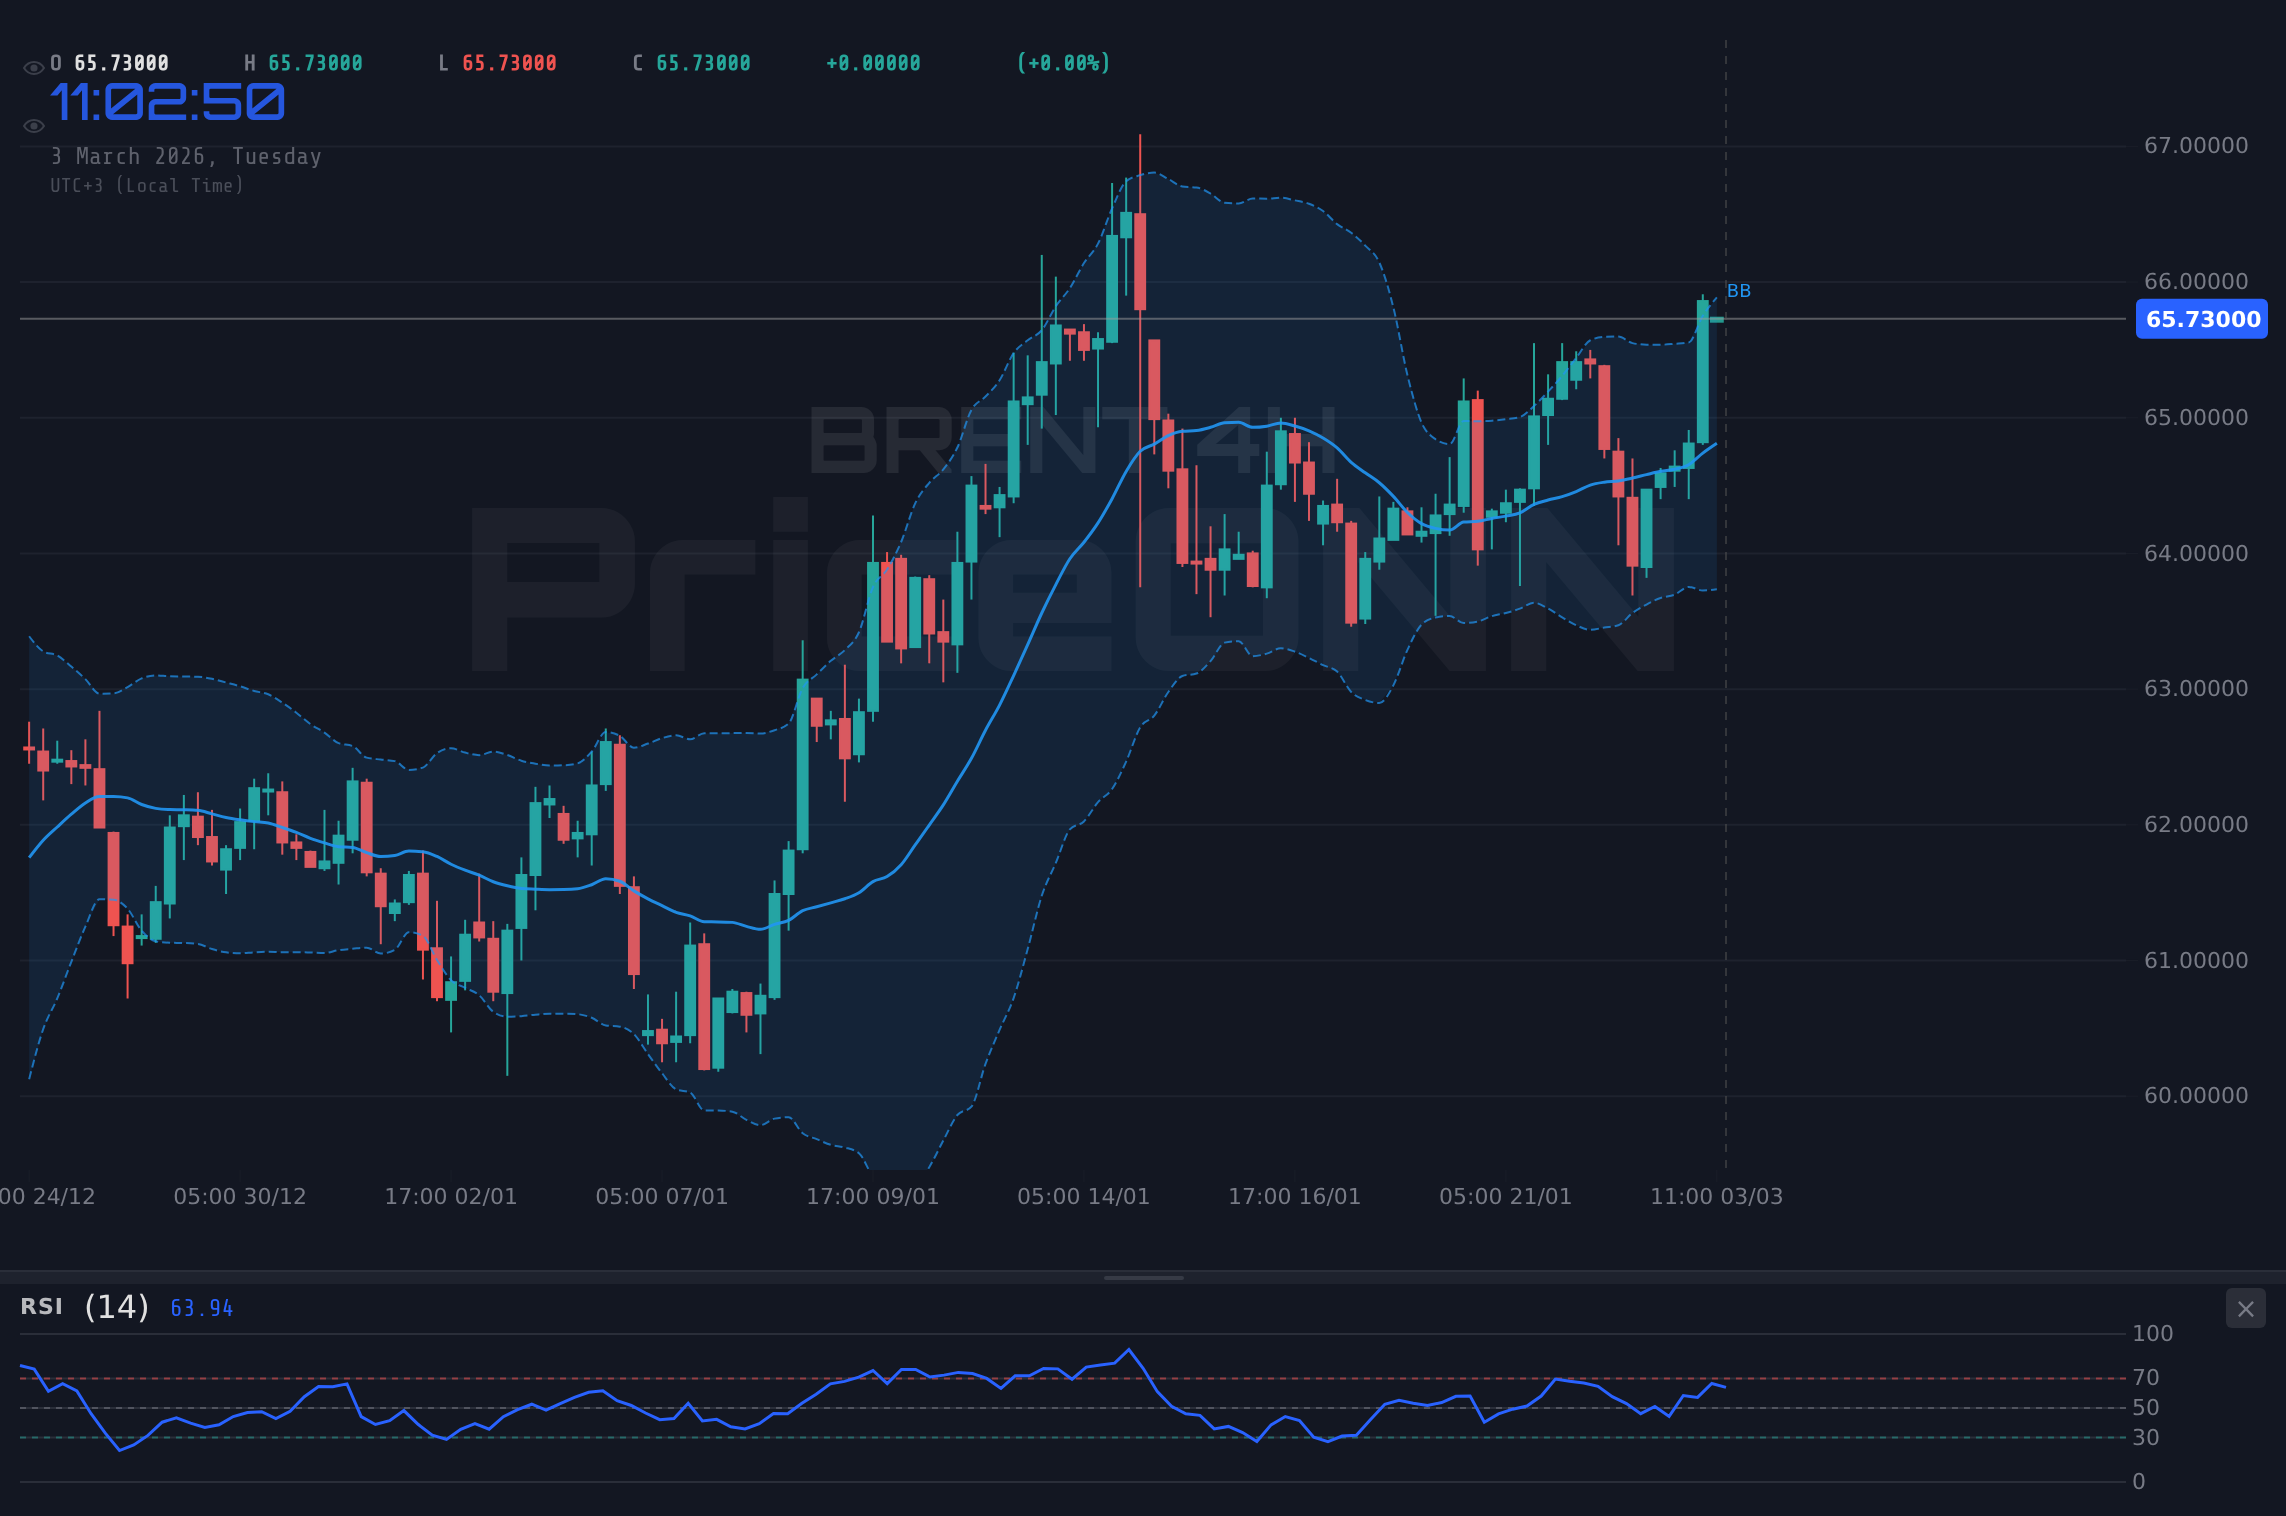
The current price action in BRENT crude is fascinating. After a period of consolidation, the market appears to be positioning itself for a potential breakout. The $65.73 level is proving to be a key pivot point. BRENT today analysis suggests that bulls are aiming for higher targets, but the overbought conditions on shorter timeframes warrant caution.
One of the primary factors supporting this bullish sentiment is the anticipation surrounding Wednesday's U.S. crude oil inventories report. Traders are keenly awaiting this data, as a significant drawdown could further fuel the upward momentum. The previous report showed a build of 15.989 million barrels, so a reversal of this trend could be interpreted as a positive sign for demand.
Technical Indicators Paint a Mixed Picture
A multi-timeframe analysis reveals a complex scenario. On the 1-hour chart, the RSI is flashing a warning signal, hovering at 71.16, indicating overbought conditions. This suggests that a short-term pullback might be in the cards. However, the 4-hour and daily charts present a more bullish picture. The 4H RSI at 62.33 is trending upwards, while the daily RSI, at 59.99, still has room to run before reaching overbought territory.
The ADX indicator provides another layer of insight. The 1H ADX at 19.03 is weak, reflecting the choppy nature of recent price action. However, the 1D ADX at 28.64 indicates a strong uptrend is in play. This disparity highlights the potential for short-term volatility within a broader bullish trend.
The MACD histogram on the 1H timeframe is showing positive momentum, further supporting the bullish outlook. However, traders should be mindful of the potential for a bearish divergence, which could signal a weakening of the uptrend. The Stochastic oscillator on the 1H chart is in overbought territory with K=90.49, D=81.87, reinforcing the potential for a short-term pullback.
Key Levels to Watch
Identifying key support and resistance levels is crucial for navigating the current market conditions. Immediate resistance lies at $65.41 on the 1H chart. A decisive break above this level could pave the way for a test of higher targets, such as $66.36 on the daily chart. On the downside, immediate support sits at $65.20. A break below this level could trigger a deeper correction towards $64.50 on the 4H chart.
From a psychological perspective, the $65 level is likely to act as a significant support zone. Traders may look to defend this level, as a sustained break below it could undermine the current bullish narrative. Conversely, a sustained break above $66 could attract further buying interest and propel BRENT towards higher price levels.
Impact of Geopolitical Tensions and Market Sentiment
Geopolitical tensions in the Middle East continue to be a major factor influencing crude oil prices. Recent reports of disruptions to tanker traffic and refinery operations have added a risk premium to the market. According to Reuters, "escalating tensions in the Strait of Hormuz are driving up European energy costs." This highlights the vulnerability of global energy markets to geopolitical events.
Market sentiment is also playing a significant role. The SP500 is showing a decline of -1.02%, indicating a risk-off environment that typically supports safe-haven assets. However, BRENT is bucking this trend, suggesting that supply-side concerns and expectations of increased demand are outweighing the broader market's risk aversion.
The DXY (Dollar Index) is currently trading at 98.57, showing a gain of 0.35%. A stronger dollar typically puts downward pressure on commodities, including crude oil. However, BRENT's resilience in the face of DXY strength suggests that other factors are at play. The upcoming U.S. crude oil inventories data could be the catalyst that determines whether BRENT can continue to defy the dollar's strength.
Economic Calendar: Key Data Releases Ahead
In addition to the U.S. crude oil inventories report, traders should also be mindful of other key economic data releases this week. On Tuesday, March 3rd, the United Kingdom Spring Forecast Statement and Eurozone Consumer Price Index (CPI) will be released. These data points could provide further insights into the global economic outlook and potentially impact energy demand.
On Wednesday, March 4th, the U.S. ADP Nonfarm Employment Change and Services Purchasing Managers Index (PMI) will be released. These data points will provide clues about the strength of the U.S. economy and potentially influence the Federal Reserve's monetary policy decisions.
Lastly, on Thursday, March 5th, the U.S. Initial Jobless Claims data will be released. A higher-than-expected number could signal a weakening of the labor market and potentially weigh on risk appetite.
What's Next for BRENT?
Given the current market conditions, it's prudent to expect some volatility in BRENT crude oil prices. The overbought conditions on shorter timeframes suggest that a pullback is possible, but the broader bullish trend remains intact. Traders should closely monitor key support and resistance levels, as well as upcoming economic data releases, for clues about the market's next move.
The key takeaway for traders is to remain flexible and adapt to changing market conditions. BRENT's price action is a tug-of-war between short-term overbought conditions and bullish longer term trends. With disciplined risk management, these choppy waters can be navigated safely.
Frequently Asked Questions: BRENT Analysis
Is BRENT a good buy right now?
BRENT is showing bullish momentum, but the 1H RSI at 71.16 indicates overbought conditions. A potential buy opportunity could arise on a pullback towards the $65.20 support level, provided the broader uptrend remains intact.
What is the BRENT price forecast for this week?
The BRENT price forecast for this week hinges on the U.S. crude oil inventories data. A significant drawdown could propel BRENT towards the $66.36 resistance level, while a build could trigger a correction towards $64.50.
What are the key support and resistance levels for BRENT?
Key support levels for BRENT are $65.20 (1H chart) and $64.50 (4H chart). Key resistance levels are $65.41 (1H chart) and $66.36 (1D chart).
Why is BRENT moving today?
BRENT is moving today due to a combination of factors, including anticipation of U.S. crude oil inventories data, geopolitical tensions in the Middle East, and a mixed technical picture with short-term overbought conditions and bullish longer term trends.
Track markets in real-time
AI-powered analysis, technical indicators and real-time price data.
Join Our Telegram Channel
Breaking market news, AI analysis and trading signals instantly.
Join Channel